Bitcoin to 60k? Inverted head and shouldersHello
Bitcoin has made an nice looking inverted head and shoulder pattern. The right shoulder is higher than the left one which tells there is eager buyers, and makes the pattern more bullish
Target is around 60k but ofc we need to break the 50-52k hard resistance area to get there.
Take a note also that the 10EMA (blue) and 25EMA (yellow) has also been flipped to support , as we can see bitcoin bounced from there
For my views of bear trend to change we need to break 53k and close above. If we do that I believe we will go test the highs and eventually make a new All time high. BUT let's not get a head of ourselves
If you do take trades always use stop loss!
Otherwise you will get your ass burned!
-Jebu
Invertedheadandshoulders

SOFI: Many GOOD chart patterns around SUPPORT level.Hello traders and investors! Let’s see how SOFI is doing today! We’ll do a complete Multiple Time Frame Analysis (MTFA) and analyze the H, D and W charts.
First, we see that SOFI is doing what seems to be an Ascending Triangle chart pattern in the 1h chart. It is reacting near its support level, which is expected, and in theory, it is heading to the resistance at $ 13.41.
As someone who’s out, I see SOFI as a possible buy opportunity, as the Risk/Reward ratio makes much more sense for long trades than short trades. The time to short was at $ 24, when it did a Double Top pattern in the daily chart, now it makes sense to buy. Speaking of daily chart:
I see an inclined Inverted H&S chart pattern, which is a bullish reversal structure. If SOFI triggers upwards its Ascending Triangle in the hourly chart, we’ll probably see a confirmation of a breakout of this IH&S in the daily chart. This dual-pattern confirmation is quite interesting to see.
What’s more, this reaction couldn’t come in better time, as seen in the weekly chart:
In January, we just retested its support near the IPO price level, around the $ 11, and SOFI is trying to stabilize now. The volume is increasing, another good indicator, and if it confirms the patterns we discussed before, it could seek the next resistance at its 21 ema, or even the $ 16 again.
This is why I’m telling you, the Risk/Reward ratio is attractive, however, we must wait for better signs around. If you are already in, you must keep these points in mind, especially the support at $ 11, which SOFI must not lose at all cost.
I hope I helped you here, and I’ll keep you guys updated on this, so, remember to follow me to not miss any of my future analyses.

HIND ALUMINIUM BASE BREAKOUT BSE:HINDALUMI broke out from a 2 year accumulation area formed after a strong downtrend of 80%
The accumulation zone slightly resembles a head and shoulder reversal pattern.
The accumulation zone is at the same price range of the previous accumulation zone from which price moved 200%
Increasing volume in the accumulation zone prior to breakout shows increasing interest in the stock.
Breakout volumes are also excellent with price also giving a retest.
A positional trade of at least 1:3 to 1:4 can be taken, but the stop loss can be trailed after the uptrend is established.
Place sl below 44
Targets are open after 1:3 and 1:4 are achieved.
Holding period 2 months to 1year +
Position size accordingly. HAPPY TRADING!

heromotocorp breakoutafter breaking out channel.
making insider candle with inverted head and shoulder
entry 2780 stoploss 2680 target 2940,3000

UPDATE On Funky Head And Shoulders On Gold. Retest Confirmed!*UPDATE Looking at the 4-Hour view on Gold, we see that we have a potential inverted head and shoulders pattern playing out.
We have seen a retrace to the neck zone (Labeled on the chart ).
As we are Breakout/Retest traders, we always always always like to see a retrace back to where the initial break out occurred from before we considered entering.
Now that we have seen our retest of the neck zone, I have opened a long position targeting 1810.4 as a target

SONIC | Inverted Head & Shoulders | Entry Setup | TF4HPrice Action & Chart Pattern Trading
> Confirmed Inverted Head & Shoulders in 4 hour timeframe
> Entry Zone@Breakout Setup
> Target Zone @ Volume Profile Point of Control
> Stoploss Zone @ Neck Line to right shoulder
Indicator signal support:
> Smart Money and Banker Fund Volume
> BBD bullish signal golden cross baseline 0
> Fundflow reversal signal confined
> KDJ uptrend reversal purple ribbon
Trade with affordable risk ratio 3:1
Always respect your stoploss
Good Luck

EURCHF upward momentumI see inverted HEAD AND SHOULDERS ob 4h chart soo we ay go up if we broke the neckline and the target is shown on the chart

Inverse Head & Shoulders on Nintendo: Hidden Bullish DivergenceNintendo is breaking through the Neckline of an Inverse Head and Shoulders pattern visible on the Daily timeframe and looks to be targeting the a Fibonacci Retrace to the upside. I will be targeting the .786 and the .886 for Profit Taking.

EURAUD upward momentumWE can see an inverted EURAUD Head and shoulders which gonna make us go up to the shown target s in the chart

EUR/CHF - LongMonthly:
The price just create this impulse and touch a strong level of support. I think we see correction at least to 38.2%
Weekly:
It's look like the price forming inverted Head & Shoulders pattern from this support level
Daily:
Double bottom and now test of neckline
4 Hour:
I will wait for breakout of 4h trendline. This will confirm my point of view and will make buy position with my strategy confirmation.
This is not financial advice!
Good luck!

NECTAR LIFESCIENCE HEAD AND SHOULDER COMPLETENSE:NECLIFE broke out from an inverted head and shoulder pattern after a sharp correction of 40-50% from 52-week high.
Price at upper circuit and volumes look bullish.
Look to enter 30% position at tomorrow's open and add the rest after consolidation.
A 1:2 to 1:3 setup can be looked at from C.M.P
Price also gave breakout from 30 week MA and retested it.
Risky trade as it is a penny stock.
Targets: 40/45/55+
sl- below 30
Position size accordingly. HAPPY TRADING!

Newgen -Long Consolidation/IHSBreakout Inverted Head and Shoulder breakout in newgen Softwares - Fundamentals also well Enough

FARM / USD - Harvest Finance: High Risk / High Reward PotentialThis is the two week Heiken Ashi candle chart for Harvest Finance, crypto-ticker FARM. FARM has been sitting in a range between ~57-100 and ~279-300ish since October 2020.
Two week Heiken Ashi chart shows a clear inverted HS pattern forming. Our right shoulder's highs and lows followed new listings on both Binance and Coinbase, this is the Uniswap chart which has the most history I could find. Marketcap has been hovering around 100 million for a while, circulating supply is 665k, development on the project has made good progress and has some unique features.
The point here is that FARM has never really gotten out of its range. Even despite having seen a near 300% jump overnight after seeing sub 100 dollars back in mid to late December, we've remained between 57 & 300 on our weekly candle closes. Recently, we made a move back to the top of the range (around 279) and then fell back to the middle near 150. If this move continues and we can break up and out of this range, holding above 279-300, we'll complete our HSi and FARM starts to have massive potential. We also could see a golden cross on the Daily 50/200 MAs following another significant move up.
I've indicated 3 potential target ranges should this occur:
- Conservative: Purple TPs 1 and 2
- Normal: Yellow TPs 1 and 2
- Aggressive: Pink TPs 1 and 2
Farm's opening week highs on Uniswap ranged between 1375 and 5194. So, there's also potential it could move significantly higher than the targets listed above, but I'd suggest that we need to see us get and stay comfortably above these first before considering that possibility.
The title says this has high risk / high reward potential. High risk because it's obviously crypto, but especially so with its low cap / low supply. It could just as easily break down out of its range and lose most of its value.
Be safe, good luck, thanks for taking the time to read!


Outlook ARTO Retest Neckline Arto keeps get inflow from foreign keep its path to bullish, chasing to 22.000 price target from inverted head and shoulder. its common that movement after break neckline resist of inverted head and shoukder, retesting its support at neckline.
14 jan 2022 already prove arto made its swing low at neckline and chasing nearest resistant at 19.000 then 19,600 (fibo 1,272), and hopefully can reach target ihns at the end

SPY Super Predictable.Hello Traders,
It's been awhile since I've shared with the class, so I figured I'd give a little Christmas treat.
In Dec., SPY has been extremely predictable so far. Those trendlines (the 2 red and 2 long green and blue), those were drawn around the 6th. As you can see, the PA has been very true to the trend.
Now, this is where it gets a little more exciting. IF TODAY CLOSES ABOVE THE NECKLINE, which happens to be the trendline, or one of the upcoming days... There is a potential IH&S (inverse head & shoulders aka H&S bottom).
I realize that is a little tight with that right shoulder only a point or so away from the bottom of the head, but technically it still applies. Since it is I would guess that this means there could be more Throwback (moves down before up) and this would hurt post breakout performance.
Note: this IHS could totally wipe since it's unconfirmed so far. Also, the target is not a prediction of date, could happen sooner, could happen later. The other wrench is the throwback, if we see a lot of it, the target will significantly be reduced. Even if we decide it's not going to be a IHS it's still an (Eve & Adam) double bottom with a fast reversal on the Adam side, so bullish either way.
With all that said, I think we are looking at a nice little melt up to end the year and pending any crazy news, we should also have a pretty bullish January. So move all of your doomsday predictions out at least a month bears.
Good luck and Merry Christmas.
Sincerely,
Mike
****Be sure to Like, Follow, Support****

GDX: Inverted hand and shouldersGold usually performs the last month of the year, entering a strong seasonal phase. Gold miners tends to anticipate gold's move.
GDX is a Gold miners ETF .
The price is currently reaching a resistance level. Should we be bearish?
Not necessarily.
If you look at the chart you can see an inverse head and shoulders , also called a "head and shoulders bottom".
This pattern is similar to the standard head and shoulders pattern, but inverted.
Investors typically enter into a long position when the price rises above the resistance of the neckline , which is currently between 33 and 33.64.
As for the target, you measure the distance between the bottom of the head and the neckline of the pattern and use that same distance to project how far price may move in the direction of the breakout (see green arrow). The target I have is about 37.74.
The pattern is only confirmed when the neckline is broken. If so, don't expect the price to reach its 37 target immediately. I have placed all the resistance lines on the chart.
Trade safe!

MTCH: INVERTED HEAD AND SHOULDERS PLAYMTCH has been in a very well defined range since November 2020. Support and resistance are clear.
Are we finally going to break above this range? We had several breakout in the past but the price always came back very quickly in the range.
One could initiate a long position if we break, with a stop below the line.
I see an inverted head and shoulders on the chart. The target move is on the chart.
Trade safe!

DOUBLE YOUR MONEY PART 3 NSE:VERTOZ broke out from base after a sharp downtrend.
Price jumped above the 30 week EMA, breaking out of a head and shoulders pattern.
Could be a positional gem.
Place a deep sl below 100. Enter at C.M.P and after retrace. Aim a minimum of 1:2 first and then trail stoploss.
Judging by previous high, price could give 100% (1:4) in 3 months to 1 year time.
Position size accordingly now and add more at dips during uptrend.
HAPPY TRADING!

ETH in possible inverted head and shoulders 4hETH is in a potential head and shoulder. WAITING FOR CONFORMATION ON RIGHT SHOULDER!

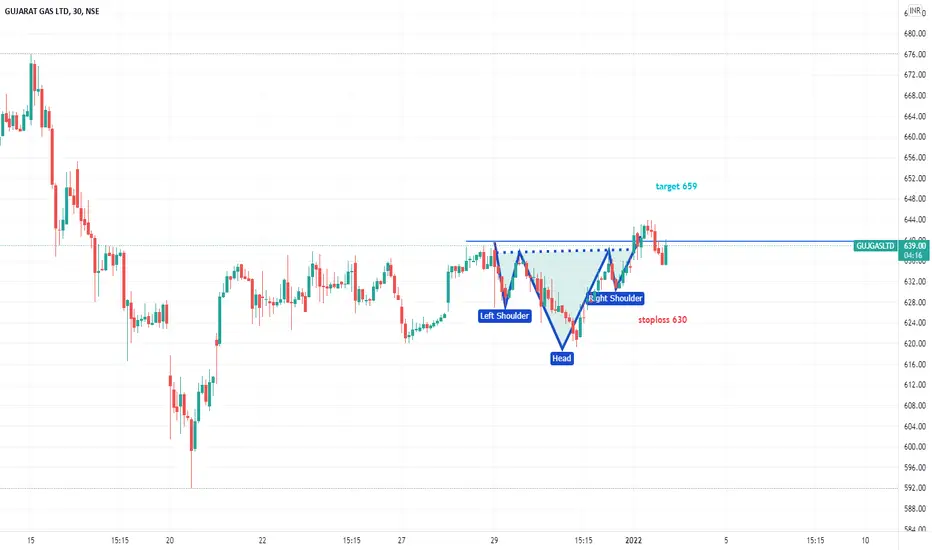
GUJGASLTDGujgas made inverted head & shoulder in 30 min chart.
Should be bought with mentioned stoploss & targets.
WiproWipro made an inverted head & shoulder on hourly charts.
Wipro can b bought with sloss below right shoulder & tgt 705.

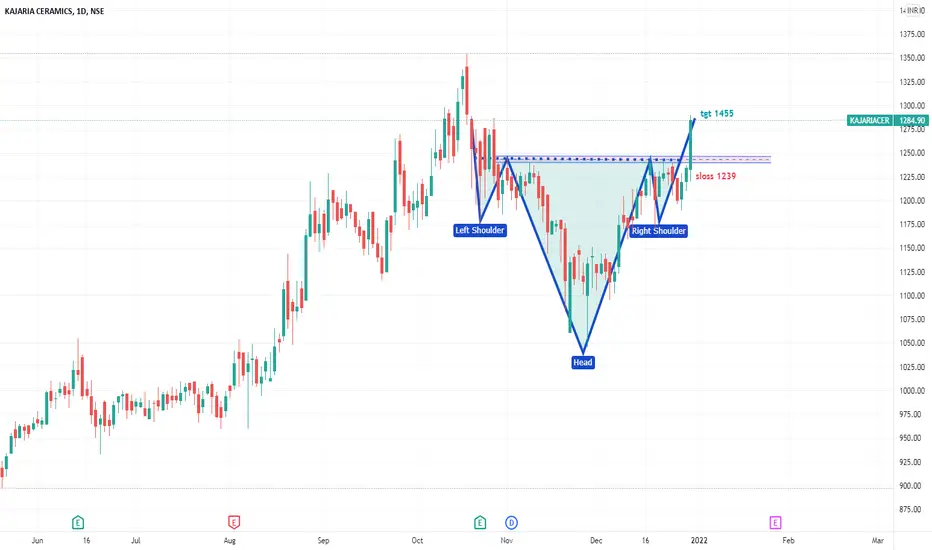
KAJARIACERKajariacer made inverted head & shoulder on daily
Could b bought here or on dip till 1350-60 with mentioned sloss & tgts.