EURJPY Idea 9/23/2021Please check out details of the position on the chart.
if you agree, please give this chart a like and follow for more.
Invertedheadandshoulders

Huge inversion for platinum after long term trendline breach!Hello my beauties,
Platinum has breached a long term trendilne and accumulated for about 4/5 years. After a spring and an SOS, the price retested a very long term trendline. Please check my previous analysis below this text.
It is now forming an inverted head and shoulders with a price target of 995.
Don't miss out on monitoring the price around the green area!
If you find this idea to be helpful like, follow, and drop a comment below if you'd want me to analyse a different pair.
Consider supporting me if you think I am providing you with value.
Peace.
Luca, TrickleDownFX

CRYPTOCURRENCY BITCOIN (BTCUSDT) SMALL PULLBACK BITCOIN ( BTCUSDT ) 30 minutes timeframe -> Inverted Head and Shoulder. A strong buying level when market is consolidating/downtrend.
This indicates after long bearish trends, the price falls to a trough and subsequently rises to form a peak.
It has taken support also from 20 EMA and a good green candle ready to make a breakout. RSI also supports it.
It can do a retest on 20 EMA and then go towards the target.
Only take entry when 15 min candle closes above 43219.
First target - 44038. Book profits there or trail your stop loss for 2nd target 44500. Stop loss should be 42672.

USDCHF LONG/SHORT ?This pair formed an inverted head and shoulder pattern, broke the neckline and continued with it's bullish move. I expect this pair to retest the neckline formed for it to continue with it's bullish move. If the pair doesn't retest the neckline, i would wait for a consolidation to go long on it

EUR/USD - Inverted Head and Shoulders - Analysis Possible Head and Shoulders formation on Daily chart.
If EUR/USD break the neck line we can see a bull movement in medium term.
Possible trend reverse can occur.


EUR/USD possible to Long next week!!!Daily Chart: DXY is moving inside Ascending channel. Checked channel lower trend line for 2 days and heading to the upside and forming falling wedge pattern in lower time frames (4 hours). If DXY can't break the 93.2 level it is possible to complete the Heading & Shoulder pattern.
Ref:
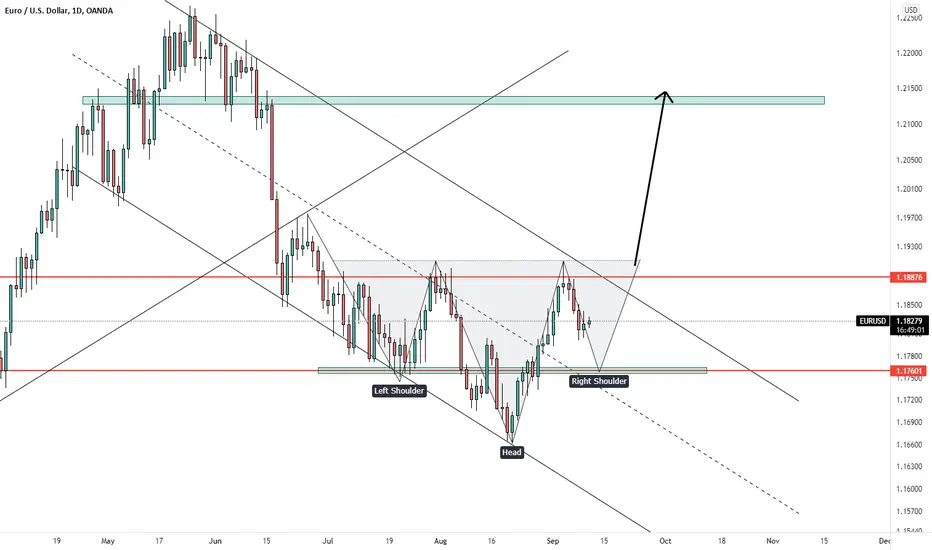
Daily chart: EURUSD is also in descending channel and forming the Inverted Head & Shoulder pattern in the daily chart. If the price bounce from 1.17 level and back to 1.18, it is possible to go to 1.21.
MASSIVE DAILY INVERTED HEAD AND SHOULDERS ON GBP/USD!Hello my beauties.
I noticed this massive head and shoulders has formed during the pandemic.It has led the price to break a bearish trendline that had been lasting since November 2007.
Since the pound has been in such a prolonged downtrend, I wouldn't be surprised if it came back down to kiss the trendline, so I'd be wary of opening longs right now.
The ideal scenario would be a drop around the trendline and a price reversal from there. I will be observing this pair as I believe it will be providing multiple opportunities.
Check out my other analysis in the description.
If you find this idea to be helpful like, follow, and drop a comment below if you'd want me to analyse a different pair.
Consider supporting me if you think I am providing you with value.
Peace.
Luca, TrickleDownFX

USDCHF, D1 - waiting for breakoutSome range move on the pair USDCHF, D1. Visible structure of inverted head and shoulders pattern. So breakout above the area 0.923-0,924 will bring some uptrend. Alternatively, breaking below trendline can cause decline towards 0.904.

Antony waste - Inverted H&SInverted head and shoulders formation.
Strong buildup at resistance.
Breakout will give us a good swing trade opportunity.

MKR - money MAKER once againInverted Head and Shoulders in the making with target $4270 (my interpretation). Let's make it, baby! 💰
Don't forget to check also the related ideas and my other analyses (link below). Cheers! 🥂
www.tradingview.com

ETHUSD | Inverted H+S Forming? | Volume MiddlingDespite the formation appearing to be an inverted head and shoulders complex, I remain a little bearish on the short term with the prices struggling to get above 3930 consistently (let alone 3950+) and with the volume being so middling. Look for well above avg volume on breakout upon potential pattern completion. Keep in mind almost in uncharted waters so here there be dragons! Only put up what you can risk. Even if the patterns play out don't FOMO in. The volume for that last relative high was mostly FOMOing buyers (hence the LUS on the candle).
Possible near resistance pull-backs identified but we could go lower.
I am still long and believe we will see a break toward ATH sooner (next couple of days or so) or later (next couple of weeks). If not please see the other idea for musings as to price targets for long(er) entries. Could be as low as 3000-3200, but 3600-3800 more likely given recent falls to major supports.
This is not financial advice. This is my opinion.
Good luck.

RUNE USDT inverted head with shoulders BULLthe chart 4H shows an inverted head and shoulders pattern. BULLISH
1st target 14,30 - 15,00
2st target ATH
3st target MOON
this is not financial advice.

AMD: You must pay attention to these patterns! Next Key Points!Hello traders and investors! Let’s how AMD is doing today!
It just did what it should’ve done, and it is in a short-term bull trend, as we have higher highs/lows. The 21 ema is pointing up, and there’s not a single pullback/reversal sign around.
The moment to buy AMD was at $ 106.07, as I warned you last week ( link to my previous analyses below this post), and now it is too late to buy. Unless if AMD does a decent pullback, but we can’t count on that. But AMD has an open gap at $ 118.18, which will probably be filled in the next few days/weeks.
However, we have some good signs in the daily chart:
After it hit the dual-support level at the 21 ema/50% Fibonacci’s Retracement , AMD reacted nicely as we expected, and it seems it is trying to do a very nice chart pattern: An Inverted H&S.
If triggered, AMD will have a technical target at the All-Time High . The only thing missing here: A good volume after a breakout.
Either way, it is interesting to pay attention to what AMD will do next, because maybe if it is not a perfect buy, we still have some upside left.
If you liked this analysis, remember to follow me to keep in touch with my daily updates.
Have a good weekend!

usdchf next week strategy on usdchf this is a good pattern where there is an inverted head and shoulders with a target point of around 0.95 but it will take a long time to reach the target, it seems, so just anticipate it

$U Unity software, retest of INV H&S Trading opportunityI quite like the look of this setup. After a nice break out of the neckline of the inverted head & shoulders formation - which was accompanied by some decent volume, we have recently seen a retest and hold of this level which also comes in just above the 200dma. I think once can buy this retest between $115-118 ,using a stop loss as a move below the breakout (or 107 if you want to give it some room). Target of the pattern comes in at approximately $151

Short-term long UNIHello. This is my first published trading idea. Any critic or suggestion is welcomed!
In 30 minute chart, the pattern is forming. Go long when the neckline is broken and go for long. Take profit at the distance between neckline and head also put the stoploss at the last shoulder.
Disclaimer: Trade at your own risk.

ZOMATO INTRADAY for 16.08.2021BREAKOUT DONE!!!
INVERTED HEAD AND SHOULDER PATTERN!!
Breakout with good volume!!
CAN make a good high!!
TARGET PRICE=147/145/150
STOP LOSS= 135 or go with trailing stop loss OR can do till 44 EMA LINE!!
200 EMA LINE IS BELOW THE BREAKOUT CANDLE SO CAN MAKE A GOOD TRADE!!
(ABOVE analysis is only for study purpose do not take as any buy or sell call!!)

Inverted Head & Shoulder Buy Tracking quantity 2133 add more above 2154 for Target of 2215 Conservative and 2250 by August END. NSE:RELIANCE

WABIBTC Price Prediction for August**Disclaimer** the content on this analysis is subject to change at any time without notice and is provided for the sole purpose of assisting traders to make independent investment decisions.
Traders!! if you like my ideas and do take the same trade as I do, please write it in a comment so we can manage the trade together.
_____________________________________________________________________________________________________________________
Thank you for your support ;)
GWBFX

INVERTED head & shoulder on IOTXGET ready for a massive pump right now folks!! Pretty much everything right now looks very bullish!!!

DNKG: Many interesting patterns to watch this week!Hello traders and investors! Let’s see how DKNG is doing today!
The trend is clearly bullish in the 1h chart, as we have higher highs/lows . The 21 ema is going up too, and it is working as a nice support level.
Another relevant support to keep an eye on is the black line at $ 51.25. This point worked as support, and it was a previous resistance on July 29. DKNG is following the Principle of Polarity too.
Yes, it is a bull trend, and we have a good bullish reaction above the 21 ema, but the challenge is to defeat the resistance at $ 53.38 (red line).
The daily chart looks interesting. We are not in a bull trend, but at least the trend is not bearish anymore. We are in a congestion , and the 21 ema is flat, but this Inverted Head & Shoulders chart pattern is a good sign.
The $ 51.25 was a pivot point , but it seems the $ 53.38 is a strong resistance, along with the $ 56.07. I see some early signs of reversal, but the situation is risky . Of course, higher the risk, better the reward. If we lose the $ 51.25 along with the 21 ema the congestion will prevail and DKNG will keep moving erratically.
If this analysis helped you, remember to follow me to keep in touch with my daily updates.
Have a good day.

Inverted Head and Shoulder AUDCADOn the daily there appears to be a Inverted Head and Shoulders pattern forming.
