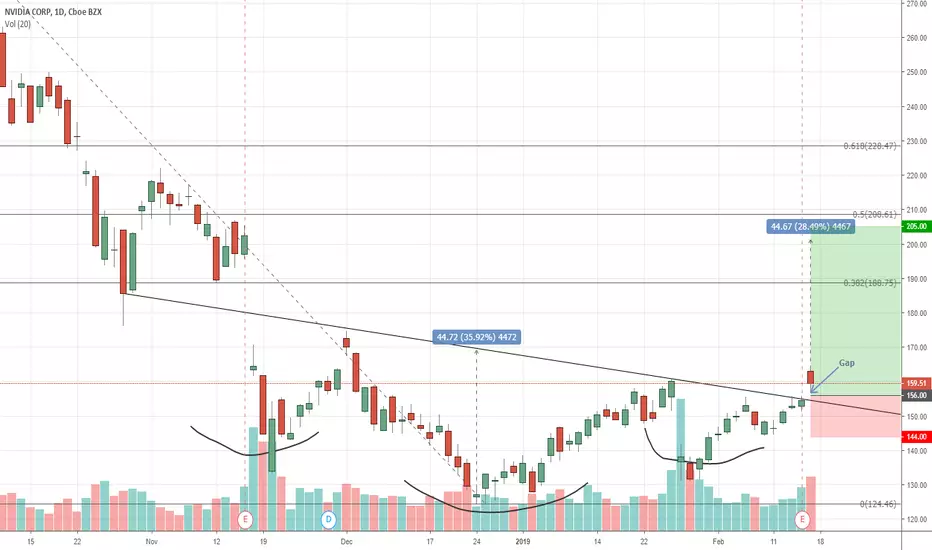
NVDA - Inverted Head & Shoulders (Bullish Reversal)The formation of an inveted Head & Shoulders Pattern plus a gap above the neckline today looks to confirm that the trend is reversing up. It would have been double confirmation if the gap was stronger (ie decisive green candle with a large gap prefered). Nevertheless this could be the start of a new bullish trend with target around 200 mark. I would put a stop loss just below the right shoulder at 143. Let's hope it plays out.
Invertedheadandshoulders
BTCUSD H4/D1 charts (2/15/2019)Good morning, traders. Price is attempting to push its way through the descending wedge's resistance as H4 RSI is pushing through its own resistance. H4 MACD is curled up and nearing a bullish cross above centerline. As we can see, the green target, which is based on the height of the wedge, is near the previous swing high. Traders need to be cautious as price nears that area. A close above that swing high is what is needed. A wick above but close below prints a bearish SFP which will likely have price reversing. However, a close above that swing high opens up the targets I discussed yesterday as price begins closing above the pattern resistances. While anything is possible at all times, there is little-to-no reason to think price is ultimately headed down from here at this time. At the very least, we should see price move up toward $3900. A daily close above $3615 should make this much more likely as that gets price back above the daily pivot. I am still not a big fan of the possible IHS but have left it for those of you who are interested in it.
BTCUSD Shorts may be finding a temporary bottom at the very least. More importantly, they are nearing the area where they have previously bounced and price headed down as a result. Just because it has happened before does not mean it will continue to happen, though, but it is something to keep an eye on. If Shorts happen to drop below that level this time around it may be an indication that the market is reversing.
Every day, we have a choice to act positively or negatively, so if you get a chance, do something decent for someone today which could be as simple as sharing a nice word with them. You just might change their day, or even their life.
Remember, you can always click on the "share" button in the lower right hand of the screen, under the chart, and then click on "Make it mine" from the popup menu in order to get a live version of the chart that you can explore on your own.

USOIL Long (Daily)We got a inverted head-and-shoulder here. We need a weekly close above 63.90/64.00. Potential target to at least Ma200 and 23.6% Fibonacci.
TVC:USOIL

BTCUSD H4/D1 charts (2/14/2019)Good morning, traders. Price continues to consolidate within a flag/descending wedge. The target based on the height of the wedge remains, as it was yesterday, the ascending red "neckline" of the possible IHS. But, as I mentioned previously, we need to see increasing candle spread and expanding volume as the right shoulder is completed and price pushes through the neckline. If we see diminishing volume and/or small candle spread then the possibility of further movement up through the descending channel's resistance is significantly reduced. But we do have a few targets if demand shows itself. The shallowest target of $3730 will get price to the red line and is based on the height of the local wedge, $3970 is based on the height of the flagpole, $4100 is based on the IHS, and $4400 is based on the height of the large descending channel. A breakdown of this wedge has price looking for initial support around $3475-$3510 with secondary support around $3430. Currently, price has retraced almost 50% of the February 8th advance.
H4 RSI continues to move within the descending broadening wedge it printed, but appears to be finding a possible floor as it flattens out around 45-50. MACD is also showing growing bullish momentum over the past two days. D1 shows price just below the daily pivot with decreasing volume the past three days and doji candles printing. This suggests that supply may be exhausting itself and, if so, we should see price move upward as demand takes over. Until it happens, however, this is just speculation. Traders should always look for confirmation of direction via pattern completions or breakdowns at the very least. The short green horizontal lines on the D1 chart mark the aforementioned targets.
Every day, we have a choice to act positively or negatively, so if you get a chance, do something decent for someone today which could be as simple as sharing a nice word with them. You just might change their day, or even their life.
Remember, you can always click on the "share" button in the lower right hand of the screen, under the chart, and then click on "Make it mine" from the popup menu in order to get a live version of the chart that you can explore on your own.

NZDUSD Buy Setupprice complete cypher pattern on support level .
this will give us some opportunity to find best buy level.
setup will be on the smaller timeframe, buy on pullback inverted head and shoulders
or price keep going down, we can try to buy from the support area/red area

Dash sees bullish surge after inv h&s/4 hour golden cross comboDash has had an incredibly bullish last 2 days after triggering a 4 hr chart inverted head and shoulders pattern and following it up soon after with a golden cross on the 4hour chart as well. Now may not be the best time to go long on Dash however as it is just now seeing a slight bit of red and seeing as how it has reached well above the inverted head and shoulder breakout target, a small retracement may be due before more upside...It's best if you aren't already in a dash position here to wait and see what its next move might be....the 4hr stoch rsi is definitely at its ceiling here but on a bull run that doesn't always matter. I will be watching to se whether or not it tries to complete a cup and then retrace to create a handle and also be keeping a close eye on the 1 day chart(not shown here) to see whether or not dash can get the coveted dashbtc 1 day golden cross...the 1 day golden cross has coincided with several other alts' bull runs the past few months so this will likely also be the case for Dash as well. A definite coin to watch...only reason this idea is neutral is because it is currently due for a small retrace. Jumping in on DASH slightly after the retrace seems like a good point to get in for anyone who isn't already in.. but its also possible that it may not retrace until it is finished forming the cup on the 1 day chart. If so patience and timing is key FOMOing in erratically is never a good idea. Just my opinion though so don't mistake this as financial advice :P It is -NOT-. Thanks for reading.

Binance Coin seeing flood of technical & fundamental bullishnessIt appears that binance's upcoming decentralized exchange will be using binance coin(BNB) as it's base pair an extremely bullish fundamental development for the coin. That coupled with the technical bullishness of the 1 day bnbbtc golden cross and the recent breakout from a 1 day head and shoulders pattern has BNB mooning with ease.

LTC Breakout! Cup and Handle? IH&S? Or Both? As expected, LTCBTC has broken bullishly after its recent golden cross on the 1 day chart. We can see its already wicking down from the Cup and Handle breakout target suggesting the pattern that has been triggered was the cup and handle and not this much larger potential Inverted Head and Shoulders pattern. We could easily also hit the inverted head and shoulders target considering that we just recently had the golden cross...but the volume profile for this IH&S so far isn't what I'm used to seeing...I'm more used to seeing a significant amount of volume at the beginning of the left shoulder which seems absent here...also the breakout volume is typically more notable as well, although we can certainly see a surge in volume here just not as much as anticipated....So for now I think it is only the cup and handle that has triggered but I anticipate the ih&s will likely trigger to after a brief retracement. Even with the lack of the left shoulder volume.

EURCHF heading to resistance areaafter break channel and complete inverted head and shoulders, price may going up to reach resistance level and shark territory.
currently price retesting inverted head and shoulders neckline, which is a good level to take a buy

XRP falling wedge longer than originally thought…no breakout yetWhat started as a 4hour falling wedge that appeared to breakout but hit nowhere near its projected target is now seeming more and more valid as a considerably longer 1 day falling wedge instead of which we have not broken out of yet. If this is indeed the case then it's possible that we may not see xrp break up from this wedge until we revisit 28 cents r possibly even as low as 23 cents which would be a zone that could provide a massive double bottom along side the falling wedge breakout. we will have to wait and see but at this current time it does appear the adjusted trendlines here for the longer wedge are now more valid than the previous wedge. Of course we also currently have a potential Inverted head and shoulder on the 4hour chart that could play out as well as a descending triangle on the 4hour that comes just after a nice bullish green candle making that pattern bullish....both of these patterns could potential send us upward and nullify the chances of a longer falling wedge but the 1 day stochrsi suggest we will be headed slightly further south still and this new longer wedge does seem to line up with btcs falling wedge timeframe a lot better too.

Another touch DOWN? HIGH REWARD, low RISK!Looks like corrective volume, perfect retracement matching fib levels and trend lines. Does not line up with typical inverse shampoo pattern for continued upside. Stop hit will re-assess.


CADJPY - Breakout From The Bullish PatternHey!
CADJPY could make bounce upwards to the next resistance.
- We have a breakout from the bullish chart pattern called Inverted Head and Shoulders
- The price is above the 100 and 200 EMA
- The bottom has an RSI Divergence.
Please, do not forget to support my idea post by hitting the "LIKE button!
Thank You very much!
Cheers!
*This information is not a recommendation to buy or sell. It is to be used for educational purposes only!

Afterpay - Breakout from an inverted H & S formation Afterpay (APT) formed an inverted Head and shoulder formation. It then broke out with a gap in price and retested the support around $15.
I calculate the next resistance around $18.75, though the move could extend to $19.50. This is not investment advice.

Wow! Complex Invert Head & Shoulder inside an Isosceles TriangleIn a previous analysis (Jan 19), I had already identified this possible complex Inverted Head & Shoulders !
It is composed of a double head and an inner small inverted H & S in the right shoulder
as explained on the link that I had already given in comment of my previous idea.
Above all, everything seems to fit inside an isosceles triangle!
This pattern is composed of two straight lines, one bullish and the other bearish.
The two lines are roughly equivalent, the triangle to be valid must have at least 4 impacts, two on each line, which is the case here.
This kind of pattern takes shape after a strong upward or downward movement. In our case, it is due to the decline of the end of 2019!
During this period, stakeholders are wondering what trend to give the market.
The main purpose of this triangle is to be able to give a precise objective of the movement at the exit.
Inside the triangle it's very difficult to guess the tendency to exit, but when the output is done you can easily give a goal.
To be valid, the exit in this kind of configuration must be done before the last quarter of the triangle,
if the exit is done after, the figure is no more valid and the given signals will be false or unreliable!!
The volumes when entering the triangle must be rising, inside the triangle they must be packed, which is the case here!
... until the exit which must be done with a maximum of volumes. The larger the volumes, the more likely the goal will be realized.
The objective can be calculated in two ways, the first is to postpone the height of the triangle taken at the second impact (arrow inside the triangle), the exit point of the value of the figure (arrow at break of the triangle ). This gives a precise objective of the increase.
The other method is to draw a parallel, to the right that has not been broken, passing through the vertex of the triangle.
This method is more approximate, but it gives an idea of the objective.
There are limitations, the goal must be achieved before the two straight components of the triangle meet.
If this is not the case the objective can be achieved but nothing guarantees it!

Bitcoin - Immediate Trend - BearishAny major price jump after an Inverted head and shoulder has proved to detrimental to the price action so far.
Next fall could be to USD3.5k or lower.
