Invest

AMD, short to 28.94 after market opening.AMD show big volumes on sell and small one on purchasing also there is a lot of closing at bulls candles (it show x-volume indicator).I mark a strong resistance as red color level its 28.32 and 28.04. Transit level is 30.84 (its means there is no big player on it and level can be free going by price).
Levels thanks to X-Lines indicator. Volumetric analys with X-volume. I wait your quastions and likes. Follow me;)

ETHUSD, long after sell, first target 273.0.What about ETH. We have strong sell after breakout X-Lines daily level 276.21. But X-Volume indicator show slow accumulation at 268.0 so we can test 273.0 and go more upper. But you know there can been flat zone betwen 268.0 - 276.0 in medium term lets see. And dont forget there is a small chanse to go more lower to 260.2.
Levels thanks to X-Lines indicator. X-Lines always better than another .. ;)
Wait your likes. Follow me.

Litecoin: big overhead resistancesIllustrated as thick maroon lines. First would be at 180, from previous levels where we would drop to. It would match the pre-halving pump we got in 2015 that shot up from lows to over 800%. 800% up from 22.50 puts us right in the 180 sweet spot. We have already come so far, we may see a final push to go up to 180. If we break past that, next would be about 200. IF. I expect we drop significantly after that, but I'm not sure for how long. We could be stuck in a small range trading for a while, we could make new ATHs this year, but whatever happens I'll be holding or accumulating, depending on conditions.
I'm not saying we will necessarily hit those levels above 180, but I could be blown away. I hear there is some big news coming out for Litecoin in terms of marketing which could send it *really* parabolic. I know this as I am somewhat in an inside loop, but I'm also not going to get my hopes up or share much more info than that. Each day that goes by, Litecoin is securing its future in the top 5 cryptos.
Referring to the short term drop today, we are still printing weekly green candles so I'm not too worried. A few red daily candles wouldn't even put me off too much. To put it shortly, "Litecoin dropping to prices not seen since yesterday." It needs to cool off, calm down. It's still looking strong in the low 30s as I watch movements on lower time frame charts. I'm here for the long game.

Another bull market trap? Bear market swing?Are we going to see a repeat of this years false gains? Remember than back a few months ago when Bitcoin started gaining in price, there was the thought that the bear market was over and the bull run started. Eagerly, lots of novice investors started dumping money to catch the "wave" only to get slaughtered with a straight drop. These are called Bear Market Swings. Is this another one? Absolutely. Is there any concrete evidence to point that Bitcoin has any reason (aside from hype) that it should continue upward? No. Here is a list of facts about crypto and bitcoin, people seemly forget:
- It's expensive to send, and its slow.
- It can lose 100% of its value in 1-minute, there are no safe guards or "circuit breakers".
- It is not anonymous since all exchanges require extensive identification checks.
- Its not finite, it can fork 1,000,000 times. Bitcoin is worthless, it has no intrinsic value.
- It requires HUGE amounts of electricity to mine and transfer.
But here is the absolute truth about crypto/bitcoin: The the only reason people even buy that worthless "asset", is because "investors" aka day-traders want more FIAT, amazing isn't it? You see, the hold argument falls flat on its face about "fiat is bad" when gaining more fiat is the entire goal of crypto trading. The problem is fiat right? Yet that's the VERY thing you want more of with Bitcoin. No one is rich in bitcoin, because there is no value to bitcoin. Bitcoin is a money grab, its worthless, with ZERO stability. By the time someone gets paid in BTC, it may have lost 20%. Idiotic "asset" to invest in. Also to clear it up, Bitcoin is NOT an asset, an asset is defined as "a useful or valuable thing, person, or quality" of which Bitcoin or crypto is neither of.

CAD\JPY Short IdeaIf we get a click break of the correct market structure on the 1hr chart
we can look to take a short position into new lows


GBP\JPY Short IdeaFollowing the strong bearish momentum, we are seeing recently on GBP pairs
We can possibly see this pair creating new lows before correcting to the upside

Stellar Lumens $XLM to the moon, easy and brainless!People who are jumping back into the Coinbase train are going to be looking for a quick jug. XLM is the perfect go to, as we are going to have it rise consistently and people will buy in without knowledge. Buy in large amounts, cash out consistently on the way up. Enjoy. ;)
Target goals
.00003000
.00007500
.00025000
.00050000
.00100000
.00250000
ENJOY THE RIDE FELLAS!!!


XTZUSD, strong short to better price 0.70.I continue writing about Kraken. And Today is XTZ USD. Volume analysis show strong short and this idea confirmed by level analysis in Kraken trade glass. Target for bears is 0.70.
Levels thanks to X-Lines indicator.

XBTUSD (BTCUSD), long to real interesting price 6465.I continue the cycle of good investment ideas and today the main cryptocurrency. Volume analisys with x-volume indicator show big purchases without nice sells last day. Big player purchase from 4400 (its on Kraken) and i think they want full 50% profit! On Day timeframe x-lines show 6465. So we go up!
Levels thanks to X-Lines indicator! Follow me)

EOSUSD, long to transit (7.83) or gold interesting price - 8.87.Ok, guys, today its Kraken and EOSUSD. I automaticaly mark all interesting price with X-lines indicator. Like you can see 8.87 its a real strong and interesting price (marked gold color). Also gold status have strong resistence level 5.47 there is a big seller on it. Volumetric analisis by X-Volume indicator show good medium purchases without obstacles. So i think you can do two things:
1) Purchase now and sell on 5.4.
2) Purchase now and wait 7.0 or higher.
It all depends on your trading activity.
Levels thanks to X-Lines indicator.

Eventbrite, long on market opening.Eventbrite do interesting thing they sell part of shares to liquide their finance problem so i think its just best time for investing. I purchase to first strong level 19.8.


LYFT IPO TRADESince Lyft went public it has had a straight up beating to its price. Still looking for lower prices. Looking for a retest of 67$ and then targeting the 45$ price level which would mean a 50% decrease of its initial price at offering.

CADJPY Bearish Bat PatternCADJPY Bearish Bat Pattern and Short Opportunity
Description: CADJPY completed a Bearish Alt Bat PAttern on the H4 Chart. Bearish correction is predicted.
OSMA divergence confirms the bearish reversal
Trade Setup
TRADE: Short
Trade Period:Intraday / Midterm
Estimated completion time: 2-8 H4 Candle Stick
The trend in the Timeframe: Bullish
The trend in the Daily Chart: Bullish
The accuracy of the pattern: 86 %
Recommended Lot Size: 0.10 at 10K
Entry: 83.60-83.65
Stop: Above X 84.05
Target 1: 83.40 / Reached … We take partial profit and move Stop Loss to entry.
Target 2: 83.10
Target 3: 82.88

EURUSD Possible UpEURUSD price action have been trading in a quite narrow range, price has almost reached the prior lows where I see convergence developing.
Looking 1.1176 a good area to build long positions with a 50 pips stop, targeting 1.1338 area.
t.me/traderfromhell (CHANNEL)

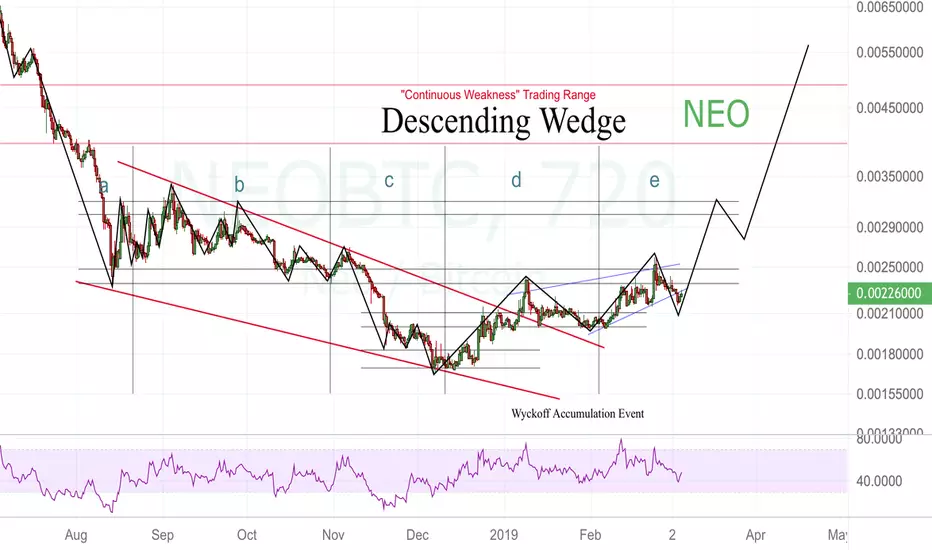

ADA Head and Shoulders Wyckoff Accumulation EventAnother Accumulation pattern found on ADABTC chart: Traditional "Saucer" or "Rounding Bottom" Trading Range also known as Head and Shoulders (inverted) bottom.
Price still in E phase, so there is a good opportunity to buy for holding mid term.
Targets are 1600—1800—2300—2500—3000

NXT: Great investment tool to make 200%—600% profit Next yearWhy NXT pumping after breakout from BlackDowntrend line?!
— I Have No Idea...
This TA for NXT I made in Live Stream show, so stay tuned to Youtube channel. We do live every Wednesday.
Targets here can be 2800 or 4500 which is 200% or 600%.
Have a nice trade, CYA!

