Disney - Swing Trade🚨 NYSE:DIS Swing Trade 🚨
🎯$119 🎯$125
- H5 Indicator Bullish Cross
- WCB Formed and Thriving
- Volume Shelf Launch
Not financial advice
Investing

How to pick a benchmark for you portfolio and beat the market What is a benchmark?
A benchmark is an index or a basket of assets used to evaluate the performance of an investment portfolio In the context of portfolio analysis the benchmark serves as a point of comparison to determine whether a fund a strategy or an investment is performing better worse or in line with the reference market.
In the current chart, Bitcoin ( BINANCE:BTCUSDT ) is displayed with a solid and larger blue line in relation to other cryptocurrencies for the current period.
Benchmarks are essential tools for institutional and private investors as they allow measuring the effectiveness of asset allocation choices and risk management Additionally they help determine the added value of an active manager compared to a passive market replication strategy.
Benchmark analysis example: NASDAQ:TSLA - NASDAQ:NDX
Benchmark analysis example: NASDAQ:TSLA - NASDAQ:AAPL - NASDAQ:NDX
What is the purpose of a benchmark
The use of a benchmark in portfolio analysis has several objectives
1) Performance Evaluation: Provides a parameter to compare the portfolio's return against the market or other funds
2) Risk Analysis: Allows comparing the volatility of the portfolio against that of the benchmark offering a measure of risk management
3) Performance Attribution: Helps distinguish between returns derived from asset selection and those linked to market factors
4) Expectation Management: Supports investors and managers in assessing whether a portfolio is meeting expected return objectives
5) Strategy Control: If a portfolio deviates excessively from the benchmark it may signal the need to review the investment strategy
How to select an appropriate benchmark?
The choice of the correct benchmark depends on several factors:
1) Consistency with Portfolio Objective: The benchmark should reflect the market or sector in which the portfolio operates
2) Representativeness of Portfolio Assets: The benchmark should have a composition similar to that of the portfolio to ensure a fair comparison
3) Transparency and Data Availability: It must be easily accessible and calculated with clear and public methodologies
4) Stability Over Time: A good benchmark should not be subject to frequent modifications to ensure reliable historical comparison
5) Compatible Risk and Return: The benchmark should have a risk and return profile similar to that of the portfolio
Most used benchmarks
There are different benchmarks based on asset type and reference market Here are some of the most common.
Equity
FRED:SP500 Representative index of the 500 largest US companies.
NYSE:MSCI World Includes companies from various developed countries ideal for global strategies
FTSE:FTSEMIB Benchmark for the Italian stock market
NASDAQ:NDX Represents the largest technology and growth companies
Bonds
Barclays Global Aggregate Bond Index Broad benchmark for the global bond market
JP Morgan Emerging Market Bond Index EMBI Benchmark for emerging market debt
[* ]BofA Merrill Lynch US High Yield Index Representative of the high-yield bond market junk bonds
Mixed or Balanced
6040 Portfolio Benchmark 60 equities SP 500 and 40 bonds Bloomberg US Aggregate used to evaluate balanced portfolios
Morningstar Moderate Allocation Index Suitable for moderate-risk investment strategies
Alternative
HFRI Fund Weighted Composite Index Benchmark for hedge funds
Goldman Sachs Commodity Index GSCI Used for commodity-related strategies
Bitcoin Index CoinDesk BPI Benchmark for cryptocurrencies
A reference benchmark is essential in portfolio analysis to measure performance manage risk and evaluate investment strategies The selection of an appropriate benchmark must be consistent with the strategy and market of the portfolio to ensure meaningful comparison.
Understanding and correctly selecting the benchmark allows investors to optimize their decisions and improve long-term results.

S&P 500 Daily Chart Analysis For Week of Feb 28, 2025Technical Analysis and Outlook:
In the recent weekly trading session, the S&P 500 did not succeed in retesting the Mean Resistance level of 6082. Instead, the index experienced a notable decline, reaching the Mean Support level of 5939 and narrowly approaching the Key Support level of 5827.
Following this downturn, a significant rebound occurred, resulting in the establishment of a new Mean Support level at 5860. The index is now positioned to target the Mean Resistance level of 5967. Should the index initiate an upward movement from its current level and successfully surpass the critical Mean Resistance of 5967, it may continue to rise toward the Mean Resistance level of 6032, potentially reaching the Key Resistance level of 6143.
Conversely, if the index declines from its present position, it may create a retest pullback to revisit the Mean Support level of 5860 before resuming further upward momentum.

Let it SNOW - Long Term SETUP! 183% UpsideLet it SNOW - Long-Term SETUP! 183% Upside
If you have time on your hands and are looking for a patient buy and hold then here is your name!
- Rising Wr%
- Bullish Cross on H5 Indicator
Bull market continues this name will fly.
Bull market ends then retest the breakout area and could hold as long as earnings stay good.
Again, LONG TERM (Noted by Monthly chart) Trade or Investment here.
$470 Target
Not financial advice

Markets have Bottomed - Here's WHY!I believe Markets have Bottomed - Here's WHY! NASDAQ:QQQ AMEX:SPY AMEX:IWM CBOE:MAGS TVC:VIX
In this video, I will go over what I believe is going on in the markets and where we will go next from here.
Doing all this while looking at all the probabilities and what they are telling us.
Not financial advice

S&P500 How Expensive Is It?The Average Wage Earner Needs To Work166.5 Hours To Buy One Share Of The S&P500
If this chart does not drive the point home. Nothing will.
Sometimes simple common sense is more powerful than all the fancy analysis one can buy or think of to create.
Price is what you pay, and value is what you get! Remember that my friends.
DANGER IS SCREAMING AT YOU!

NN GROUP ($NN) Q4—INSURANCE CASH SHINES IN EUROPENN GROUP ( EURONEXT:NN ) Q4—INSURANCE CASH SHINES IN EUROPE
(1/9)
Good evening, TradingView! NN Group ( EURONEXT:NN ) is humming—H2 revenue hit $ 7.94B, topping estimates 📈🔥. Q4 earnings and a cash boost spark buzz—let’s unpack this Dutch dynamo! 🚀
(2/9) – REVENUE RUSH
• H2 Haul: $ 7.94B—beats $ 7.41B est. 💥
• Full ‘24: $ 12.36B—up 12% from $ 11.03B 📊
• OCG: $ 1.9B—hits ‘25 goal early
EURONEXT:NN ’s cash flow’s sizzling—steady wins!
(3/9) – BIG MOVES
• Buyback: $ 300M—shares get a lift 🌍
• Dividend: $ 3.44—up 8%, juicy payout 🚗
• Deals: $ 360M settled—risks trimmed 🌟
EURONEXT:NN ’s flexing—insurance muscle shines!
(4/9) – SECTOR SNAP
• P/E: ~10—below 11.9x avg 📈
• P/B: 0.57—vs. sector’s 1.04—cheap?
• Edge: 12% growth tops peers 🌍
EURONEXT:NN ’s a bargain—or just quiet strength?
(5/9) – RISKS ON DECK
• EPS Miss: $ 2.21 vs. $ 3.60—hiccup ⚠️
• Rates: Volatility stings returns 🏛️
• Climate: Claims could climb—yikes 📉
Solid run—can it dodge the bumps?
(6/9) – SWOT: STRENGTHS
• Cash: $ 1.9B OCG—rock solid 🌟
• Payouts: 8% divvy, $ 300M buyback 🔍
• Europe: 20% new biz—growth zip 🚦
EURONEXT:NN ’s a steady beast—built tough!
(7/9) – SWOT: WEAKNESSES & OPPORTUNITIES
• Weaknesses: EPS slip, Dutch lean 💸
• Opportunities: Eastern Europe perks 🌍
Can EURONEXT:NN zap past the risks?
(8/9) – EURONEXT:NN ’s Q4 cash surge—what’s your vibe?
1️⃣ Bullish—Value shines bright.
2️⃣ Neutral—Solid, risks hover.
3️⃣ Bearish—Misses stall it out.
Vote below! 🗳️👇
(9/9) – FINAL TAKEAWAY
EURONEXT:NN ’s $ 7.94B H2 and $ 1.9B OCG spark zing—insurance hums 🌍. Low P/E, but EPS wobbles—gem or pause?

BERKSHIRE HATHAWAY ($BRK.A) Q4—INSURANCE & CASH SHINEBERKSHIRE HATHAWAY ( NYSE:BRK.A ) Q4—INSURANCE & CASH SHINE
(1/9)
Good afternoon, TradingView! Berkshire Hathaway ( NYSE:BRK.A ) is humming—Q4 operating earnings soared 71% to $ 14.5B 📈🔥. Insurance and a record cash pile spark buzz—let’s unpack this titan! 🚀
(2/9) – EARNINGS SURGE
• Q4 Ops: $ 14.5B—up from $ 8.5B last year 💥
• Full ‘24: Insurance jumps 51%—key driver 📊
• Net: $ 19.7B Q4—profit stays juicy
NYSE:BRK.A ’s flexing—steady as she goes!
(3/9) – BIG MOVES
• Cash Hoard: $ 334B—up from $ 270B mid-year 🌍
• No Buybacks: Q4 skips—$ 7B spent earlier 🚗
• Apple Trim: Half sold off—cash king 🌟
Buffett’s stacking bucks—ready for action!
(4/9) – SECTOR SNAP
• Market Cap: ~$ 1.075T—top tier 📈
• P/B: 1.55—vs. JPM’s 1.9, Allstate’s 1.3
• Outrun: 25.5% ‘24 vs. S&P’s 25% 🌍
NYSE:BRK.A ’s a beast—value or peak?
(5/9) – RISKS IN SIGHT
• Stocks: Apple, Chevron swings—volatility nips ⚠️
• Succession: Buffett’s exit looms—jitters? 🏛️
• Economy: Rail, retail soften if cash tightens 📉
Solid, but not ironclad—watch out!
(6/9) – SWOT: STRENGTHS
• Diverse: Insurance leads—51% growth 🌟
• Cash: $ 334B—ultimate cushion 🔍
• Track: 19.8% CAGR—beats S&P’s 10.2% 🚦
NYSE:BRK.A ’s a fortress—built tough!
(7/9) – SWOT: WEAKNESSES & OPPORTUNITIES
• Weaknesses: Insurance lean, cash sits 💸
• Opportunities: Deals, yields lift—$ 14.5B zing 🌍
Can NYSE:BRK.A zap the next big win?
(8/9) – NYSE:BRK.A ’s Q4 surge—what’s your vibe?
1️⃣ Bullish—Cash rules, value shines.
2️⃣ Neutral—Solid, risks balance.
3️⃣ Bearish—Growth stalls, succession bites.
Vote below! 🗳️👇
(9/9) – FINAL TAKEAWAY
NYSE:BRK.A ’s $ 14.5B Q4 and $ 334B cash spark zing—insurance flexes 🌍. Premium P/B, but steady wins—champ or chill?

ARISTA NETWORKS ($ANET) ZAPS Q4—AI & CLOUD FUEL SURGEARISTA NETWORKS ( NYSE:ANET ) ZAPS Q4—AI & CLOUD FUEL SURGE
(1/9)
Good evening, TradingView! Arista Networks ( NYSE:ANET ) is buzzing—$ 7B in 2024 revenue, up 19.5% 📈🔥. Q4 shines with AI and cloud demand—let’s unpack this tech titan! 🚀
(2/9) – REVENUE RUSH
• 2024 Haul: $ 7B—19.5% jump from $ 5.86B 💥
• Q4 Take: $ 1.93B—25.3% up, beats $ 1.9B 📊
• EPS: $ 0.65—tops $ 0.57, up 25%
NYSE:ANET ’s humming—cloud’s got juice!
(3/9) – BIG PLAYS
• Q1 ‘25 Guide: 1.93 − 1.97B—above $ 1.907B 🌍
• Stock Split: 4-for-1—shares for all! 🚗
• AI Ties: Meta, NVIDIA deals spark buzz 🌟
NYSE:ANET ’s wiring the future—full throttle!
(4/9) – SECTOR SNAP
• P/E: ~54—premium vs. Cisco’s 17 📈
• Growth: 19.5% smokes sector’s 7%
• Edge: 70-80% Microsoft share—kingpin 🌍
NYSE:ANET ’s hot—value or stretch?
(5/9) – RISKS IN VIEW
• Clients: Microsoft, Meta—big eggs, one basket ⚠️
• Comp: Cisco bites back—AI race heats 🏛️
• Economy: Capex cuts could sting 📉
High flyer—can it dodge the turbulence?
(6/9) – SWOT: STRENGTHS
• AI Lead: $ 750M ‘25 target—cloud king 🌟
• Margins: 64.6%—profit punch 🔍
• Cash: 95% flow jump, no debt 🚦
NYSE:ANET ’s a lean, mean machine!
(7/9) – SWOT: WEAKNESSES & OPPORTUNITIES
• Weaknesses: Client lean, high P/E 💸
• Opportunities: AI clusters, enterprise zip 🌍
Can NYSE:ANET zap past the risks?
(8/9) – NYSE:ANET ’s Q4 buzz—what’s your vibe?
1️⃣ Bullish—AI keeps it soaring.
2️⃣ Neutral—Growth’s solid, risks linger.
3️⃣ Bearish—Premium fades fast.
Vote below! 🗳️👇
(9/9) – FINAL TAKEAWAY
NYSE:ANET ’s $ 1.93B Q4 and AI deals spark zing—$ 7B year shines 🌍. Premium P/E, but growth rules—champ or chase?

$DXY HOLDS FIRM—TRUMP TARIFFS & FED FUEL 2025 BUZZTVC:DXY HOLDS FIRM—TRUMP TARIFFS & FED FUEL 2025 BUZZ
(1/9)
Good afternoon, Tradingview! The U.S. Dollar Index ( TVC:DXY ) sits at 106.47 today—tariffs and Fed vibes keep it humming 📈🔥. Down a hair from 106.60—let’s unpack this greenback glow! 🚀
(2/9) – YEARLY SURGE
• 2024 Run: From 100.16 to 107+ by Dec 💥
• Today: 106.47—off 0.12% from yesterday 📊
• Driver: Trump tariffs juice inflation fears
TVC:DXY ’s got grit—2025’s off to a zesty start!
(3/9) – BIG BOOSTERS
• Tariffs: Auto, chip threats—dollar darling 🌍
• Fed: Slow cuts—rates outshine abroad 🚗
• Crypto Nod: Pro- AMEX:USD admin vibes 🌟
Greenback’s flexing—policy packs a punch!
(4/9) – MARKET PULSE
• Vs. Peers: Outpaces euro, yen—rate gaps shine 📈
• X Chatter: 107 peak, post-swearing dip?
• Edge: U.S. growth trumps global woes 🌍
TVC:DXY ’s steady—king of the currency hill?
(5/9) – RISKS IN PLAY
• Deficits: Fiscal bloat looms long-term ⚠️
• Geo-Tension: Wars nudge safe-haven bets 🏛️
• Fed Pivot: Faster cuts could dim shine 📉
Tough tailwinds—can TVC:DXY dodge the drag?
(6/9) – SWOT: STRENGTHS
• Tariffs: Inflation lift—dollar darling 🌟
• Rates: Fed’s edge over ECB, BOJ 🔍
• Haven: Chaos loves $ USD—rock solid 🚦
TVC:DXY ’s got muscle—global star!
(7/9) – SWOT: WEAKNESSES & OPPORTUNITIES
• Weaknesses: Debt piles—future wobble? 💸
• Opportunities: Tariff hikes zap rivals 🌍
Can TVC:DXY keep the crown or stumble?
(8/9) – TVC:DXY at 106.47—what’s your vibe?
1️⃣ Bullish—108+ by spring.
2️⃣ Neutral—Holds steady, risks hover.
3️⃣ Bearish—Dips below 100 soon.
Vote below! 🗳️👇
(9/9) – FINAL TAKEAWAY
TVC:DXY ’s 106.47 glow—tariffs, Fed, and grit shine 🌍🪙. Deficits lurk, but strength rules—bull or bust?

MERCADOLIBRE ($MELI) SOARS IN Q4—E-COMMERCE & FINTECH SHINE MERCADOLIBRE ( NASDAQ:MELI ) SOARS IN Q4—E-COMMERCE & FINTECH SHINE
(1/9)
Good evening, Tradingview! MercadoLibre ( NASDAQ:MELI ) is sizzling—Q4 revenue up 37%, a $ 6.1B haul 📈🔥. Fintech and e-commerce fuel a 33% surge—let’s unpack this Latin dynamo! 🚀
(2/9) – REVENUE RUSH
• Q4 Take: $ 6.1B—37% leap, tops $ 5.9B est. 💥
• EPS: $ 12.61—blasts past $ 7.94 hopes 📊
• Net Income: $ 639M—beats $ 402M dreams
NASDAQ:MELI ’s humming—growth’s got zing!
(3/9) – BIG MOVES
• GMV: $ 14.5B—56% jump FX-neutral 🌍
• Payments: $ 58.9B TPV—49% up 🚗
• Credit Boom: $ 6.6B—74% growth 🌟
NASDAQ:MELI ’s flexing muscle—full throttle!
(4/9) – MARKET VIBE
• P/E: ~60—above Amazon’s 40, PDD’s 20 📈
• Growth: 37% smokes peers’ 10%
• Targets: 2,400−3,000—10-38% upside 🌍
Premium price—worth the juice?
(5/9) – RISKS ON DECK
• FX Woes: Brazil, Mexico currencies wobble ⚠️
• Comp: Amazon, locals eye the prize 🏛️
• Rates: $ 6.6B credit—defaults lurk? 📉
Hot run—can it dodge the heat?
(6/9) – SWOT: STRENGTHS
• E-comm: $ 14.5B GMV—LatAm king 🌟
• Fintech: $ 58.9B TPV—Pago’s gold 🔍
• Logistics: 6 new centers—zippy edge 🚦📉
NASDAQ:MELI ’s a double-threat dynamo!
(7/9) – SWOT: WEAKNESSES & OPPORTUNITIES
• Weaknesses: High P/E, FX swings 💸
• Opportunities: Ad bucks, untapped markets 🌍
Can NASDAQ:MELI zap past the bumps?
(8/9) – NASDAQ:MELI ’s Q4 surge—what’s your vibe?
1️⃣ Bullish—$ 3,000 in sight.
2️⃣ Neutral—Growth’s hot, risks hover.
3️⃣ Bearish—FX bites back.
Vote below! 🗳️👇
(9/9) – FINAL TAKEAWAY
NASDAQ:MELI ’s $ 6.1B Q4 and fintech flex spark buzz—$ 14.5B GMV shines 🌍🪙. High P/E, but growth rules—champ or chase?

VERTEX ($VRTX) SHINES IN Q4—PAIN & CF FUEL GROWTHVERTEX ( NASDAQ:VRTX ) SHINES IN Q4—PAIN & CF FUEL GROWTH
(1/9)
Good evening, Tradingview! Vertex ( NASDAQ:VRTX ) is buzzing—Q4 revenue up 16%, new drugs hit the scene 📈🔥. $ 2.91B and a bold 2025 forecast—let’s unpack this biotech beast! 🚀
(2/9) – REVENUE RUSH
• Q4 Haul: $ 2.91B—16% jump from last year 💥
• Full ‘24: $ 11.02B, up 12%—Trikafta’s king 📊
• ‘25 Outlook: $11.75-$ 12B—6-9% growth
NYSE:CF keeps humming—newbies add zest!
(3/9) – BIG WINS
• Journavx: Non-opioid painkiller greenlit Jan ‘25 🌍
• Alyftrek: CF drug for 6+—ships now 🚗
• Cash: $11.2B—loaded for action 🌟
NASDAQ:VRTX storms pain—CF stays golden!
(4/9) – SECTOR CHECK
• Valuation: 11x sales—above 9x avg 📈
• Vs. Peers: Gilead’s 4x, Regeneron’s 8x—premium?
• Growth: 12% beats biotech’s 5-7% 🌍
NASDAQ:VRTX flexes—value or stretch?
(5/9) – RISKS ON TAP
• Payers: Journavx needs coverage—hiccups? ⚠️
• Trikafta: 93% of sales—big lean 🏛️
• Comp: Pain rivals, CF safe—for now 📉
Hot streak—can it dodge the bumps?
(6/9) – SWOT: STRENGTHS
• CF King: Trikafta, Alyftrek lock it in 🌟
• Pain Play: Journavx eyes $ 4B peak 🔍
• Cash: $11.2B—war chest ready 🚦
NASDAQ:VRTX ’s got muscle and moolah!
(7/9) – SWOT: WEAKNESSES & OPPORTUNITIES
• Weaknesses: Trikafta reliance—eggs in one basket 💸
• Opportunities: Casgevy rolls, pain grows 🌍
Can NASDAQ:VRTX zap past the risks?
(8/9) – NASDAQ:VRTX ’s Q4 surge—what’s your vibe?
1️⃣ Bullish—Pain pays off big.
2️⃣ Neutral—Solid, but risks linger.
3️⃣ Bearish—Growth hits a wall.
Vote below! 🗳️👇
(9/9) – FINAL TAKEAWAY
NASDAQ:VRTX ’s $2.91B Q4 and Journavx/Alyftrek wins spark buzz—$11.2B cash backs it 🌍🪙. Trikafta rules, risks hover—champ or chaser?

CELSIUS ($CELH) ZAPS UP 33%—Q4 & ALANI NU IGNITE BUZZCELSIUS ( NASDAQ:CELH ) ZAPS UP 33%—Q4 & ALANI NU IGNITE BUZZ
(1/9)
Good evening, Tradingview! Celsius Holdings ( NASDAQ:CELH ) just surged 33%—Q4 earnings and a $1.65B Alani Nu buyout lit the fuse 📈🔥. Energy drink market’s buzzing—let’s unpack this jolt! 🚀
(2/9) – EARNINGS SNAP
• Q4 Revenue: $332M, topped $329M expected 💥
• Margin: Jumped to 50.2%—beats 47.1% hopes 📊
• EPS: $0.14, above $0.11—solid grit
Growth slowed, but NASDAQ:CELH flexed resilience!
(3/9) – ALANI NU DEAL
• Price: $1.65B—$1.275B cash, $500M stock 🌍
• Alani’s Pull: $595M ‘24 sales, 78% growth 🚗
• Combo: 16% energy drink share—$ 2B ‘25 goal 🌟
NASDAQ:CELH snags a rival—big playtime!
(4/9) – MARKET VIBE
• Surge: 33% to $33-$35—shorts burned 📈
• Vs. Peers: 6x sales, below 9x avg—value?
• X Hype: “Top gainer”—bulls cheer 🌍
NASDAQ:CELH heats up—bargain or buzz?
(5/9) – RISKS IN SIGHT
• Overlap: Alani vs. CELH—cannibal clash? ⚠️
• Slowdown: North Am. down 6%—Pepsi hiccups 🏛️
• Comp: Rivals eye shelf space—tight race 📉
Hot move, but bumps lurk ahead!
(6/9) – SWOT: STRENGTHS
• Deal: $1.65B Alani—growth rocket 🌟
• Margin: 50.2%—profit punch 🔍
• Global: 39% intl. leap—worldwide zip 🚦
NASDAQ:CELH ’s firing on all cylinders!
(7/9) – SWOT: WEAKNESSES & OPPORTUNITIES
• Weaknesses: Q4 dip, overlap risks 💸
• Opportunities: $ 2B sales, $50M synergies 🌍
Can NASDAQ:CELH juice up the doubters?
(8/9) – NASDAQ:CELH ’s 33% zap—what’s your vibe?
1️⃣ Bullish—$40+ in sight.
2️⃣ Neutral—Growth’s cool, risks hover.
3️⃣ Bearish—Hype fades fast.
Vote below! 🗳️👇
(9/9) – FINAL TAKEAWAY
NASDAQ:CELH ’s Q4 and Alani Nu deal spark a 33% leap—$332M, $1.65B buy 🌍🪙. Resilience shines, but overlap looms—champ or chase?

ETHEREUM’S 2025—$ETH POWERS UP WITH ETFs & DEFIETHEREUM’S 2025— CRYPTOCAP:ETH POWERS UP WITH ETFs & DEFI
(1/9)
Good morning, Tradingview! Ethereum’s flexing muscle—ETFs and DeFi keep CRYPTOCAP:ETH humming 📈🔥. Institutional cash and altcoin grit shine—let’s unpack this crypto king! 🚀
(2/9) – ETF BUZZ
• Inflows: $SEED_TVCODER77_ETHBTCDATA:3B+ into ETH ETFs since July ‘24 💥
• Feb Surge: $500M+ in a week—BlackRock leads 📊
• Outlook: $10-15B by year-end?
Big players bet big— CRYPTOCAP:ETH ’s got juice!
(3/9) – DEFI DOMINANCE
• TVL: $120B locked in Feb ‘25—up from $78B 🌍
• Share: 60%+ of DeFi’s action 🚗
• Goal: $200B by Dec? Steno says maybe 🌟
Ethereum’s the DeFi backbone—unshaken!
(4/9) – ALTCOIN EDGE
• Altcoin Cap: $1.6T— CRYPTOCAP:ETH holds 10-12% 📈
• ETH/BTC: Climbing to 0.06—alt season whispers
• Vs. BTC: 57% dominance— CRYPTOCAP:ETH stands tall
Resilient king—altcoins rally behind! 🌍
(5/9) – RISKS ON RADAR
• Regs: Rules could snag ETF, DeFi growth ⚠️
• Rivals: Solana bites at CRYPTOCAP:ETH ’s heels 🏛️
• Price Dip: $2,632—off Jan highs 📉
Solid, but not bulletproof—watch out!
(6/9) – SWOT: STRENGTHS
• ETFs: $ 3B+ inflows—cash keeps flowing 🌟
• DeFi: $120B TVL—ecosystem champ 🔍
• Stake: 54M+ ETH locked—rock steady 🚦
CRYPTOCAP:ETH ’s the muscle in crypto town!
(7/9) – SWOT: WEAKNESSES & OPPORTUNITIES
• Weaknesses: $ 2,632 lags inflows—sentiment lags 💸
• Opportunities: $ 200B TVL, Pectra lifts 🌍
Can CRYPTOCAP:ETH zap to new heights?
(8/9) – CRYPTOCAP:ETH ’s ETF & DeFi run—what’s your vibe?
1️⃣ Bullish—King keeps ruling.
2️⃣ Neutral—Growth’s cool, risks hover.
3️⃣ Bearish—Rivals steal the crown.
Vote below! 🗳️👇
(9/9) – FINAL TAKEAWAY
CRYPTOCAP:ETH ’s humming—$ 3B ETFs, $120B DeFi, altcoin grit 🌍. $ 200B TVL in sight, but rivals lurk. Champ or challenger?

$US30 DOW JONES—STEADY AMID THE STORMDOW JONES—STEADY AMID THE STORM
(1/9)
Good morning, Tradingview! The Dow Jones is the cool-headed cousin—less wild than Nasdaq’s growth party 📈🔥. Blue-chip stability shines, even as inflation bites—let’s unpack it! 🚀
(2/9) – WHY SO CALM?
• Makeup: 30 big, steady names—Walmart, Goldman 💥
• Price-Weighted: High flyers lead, not tech zingers 📊
• Edge: Less sway from growth stock swings
Dow’s the tortoise—slow and steady wins?
(3/9) – RECENT VIBES
• Feb 22: 1.7% dip—support at 43,400 holds 🌍
• VIX: Stays chill—Nasdaq would’ve freaked 🚗
• CPI Hit: 400-point drop, 300 back—meh 🌟
Stability’s the Dow’s secret sauce!
(4/9) – SECTOR SNAP
• Vs. Nasdaq: Tech’s jittery—Dow’s diversified 📈
• Volatility: ~15-20% vs. Nasdaq’s 25-30%
• Champs: Blue-chips buffer the chaos
Steadier ship—less Nasdaq nuttiness! 🌍
(5/9) – INFLATION RIPPLES
• CPI Spike: 3% YoY—400-point jolt ⚠️
• Fed: No rush to cut—rates sting 🏛️
• X Buzz: Tariffs, inflation spook recovery 📉
Even the Dow feels the heat—but shrugs!
(6/9) – SWOT: STRENGTHS
• Stability: Blue-chip backbone holds firm 🌟
• Dividends: Cash flows steady the ship 🔍
• Mix: Less tech tantrums—broad base 🚦
Dow’s the rock in choppy waters!
(7/9) – SWOT: WEAKNESSES & OPPORTUNITIES
• Weaknesses: Inflation nicks costs—ouch 💸
• Opportunities: Safety shines if tech flops 🌍
Can Dow dodge the inflation blues?
(8/9) – Dow’s steady play—what’s your vibe?
1️⃣ Bullish—Stability’s golden.
2️⃣ Neutral—Holds, but inflation looms.
3️⃣ Bearish—Growth wins anyway.
Vote below! 🗳️👇
(9/9) – FINAL TAKEAWAY
Dow’s less jittery—blue-chips cushion the storm 🌍🪙. Inflation’s a nag, but stability rules. Rock or relic?

SPX Finally Moves, Will 6000 Hold?SPX Finally Moves – But Will 6000 Hold? | SPX Market Analysis 24 Feb 2025
Last week’s market action was like watching a cat decide whether to jump off a shelf—hesitation, commitment, regret, and then chaos.
SPX pushed through the bull trigger on Wednesday, only to whip back through the hedge & bear trigger, finally showing some real movement on Friday. But before we get too excited, SPX is still stuck inside a larger range, with 6000 as the next key battleground.
Will we see a range breakout or another rejection?
Let’s dive in.
---
Deeper Dive Analysis:
SPX Moves – But Is It Just Another Range Play?
Last week gave us plenty of action, but SPX hasn’t truly escaped its larger range yet.
📌 What happened last week?
SPX broke the bull trigger on Wednesday 🚀
Immediately flipped back through the hedge & bear trigger 🤦♂️
Friday’s move finally opened things up 🔓
Now, we’re eying 6000 as the next decision point.
📌 Two potential setups:
✅ Range Reversal – Price rejects 6000 and moves back inside the range
✅ Breakout Trade – SPX clears 6000, confirming a new leg up
Either way, I’ll be watching closely for the next trade setup.
VIX Says ‘No Crash… Yet’
📉 The volatility index (VIX) remains below 20, meaning:
No imminent crash signals 🛑
Fear is elevated but not panicking
Still room for surprises, but not full-blown chaos (yet!)
If VIX jumps past 20 and keeps climbing, then we’ll talk about more extreme downside risk.
Overnight Futures – A Small Bounce, But No Turn Yet
🌅 Futures are slightly green, but they don’t confirm:
A major bullish turn ❌
A full-blown breakdown ❌
Right now, it’s more noise than signal.
What’s Next?
📌 I remain bearish on my income swing trades 📉
📌 Waiting for confirmation—either:
Bullish reversal (v-shaped price action shift) 🔄
Bearish breakdown (clean range break below 6000) 🚨
For now, it’s another waiting game—but one that could pay off big when the next major move arrives.
---
Fun Fact
📢 Did you know? In 2010, the Flash Crash wiped out nearly $1 trillion in market value in just 36 minutes, only to recover almost entirely by the end of the day. The culprit? A single trader’s algorithm running wild.
💡 The Lesson? Sometimes, market chaos isn’t about fundamentals—it’s just a rogue algorithm losing its mind.

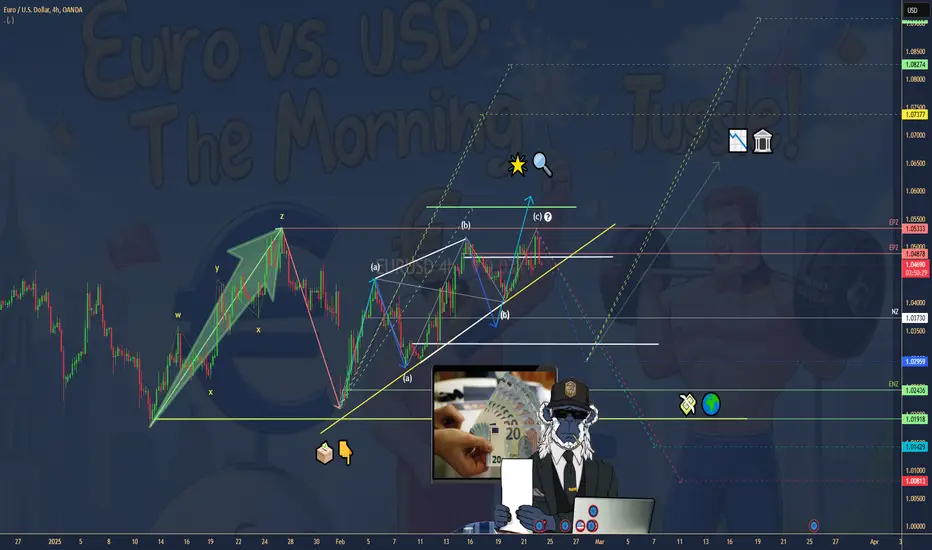
EURO LIFTS POST-GERMAN VOTE—BUT USD BITES BACKEURO LIFTS POST-GERMAN VOTE—BUT USD BITES BACK FX:EURUSD
(1/9)
Good morning, Tradingview Fam! Germany’s election—Merz and CDU on top—gave the euro a quick jolt, up 0.44% to $1.0507 📈🔥. Markets dig the stability vibe, but it’s fading fast—let’s unpack this tussle! 🚀
(2/9) – ELECTION SPARK
• Euro Bump: Hit $1.0530 overnight—election cheer 💥
• Markets: DAX futures up 1.2%, EUROSTOXX 50 +0.66% 📊
• Fade: Now at $1.0480—USD’s flexing back
Brief lift—stability’s sweet, but not sticky!
(3/9) – TECH TELLTALE
• Resistance: $1.0500-1.0510 wall holds firm 🌍
• Support: $1.0470 pivot, then $1.0440 if it slips 🚗
• Charts: Double top whispers at $1.0530 🌟
Traders on X see a retreat—bearish juice brewing?
(4/9) – USD PUSHBACK
• Jobless Claims: Weak last week, USD softened a tad 📉
• Fed: No rush to cut—rates steady, Nvidia looms
• Muscle: Dollar’s clawing back—ballast holds
AMEX:USD ’s got grit—euro’s nudge ain’t enough! 🌍
(5/9) – RISKS IN PLAY
• Volatility: PMI data, Nvidia earnings stir the pot ⚠️
• Sentiment: X split—liquidity grab or bear turn? 🏛️
• Levels: Below $1.0470 opens $1.0390 risk 📉
Quick sprint—can euro keep the pace?
(6/9) – SWOT: STRENGTHS
• Election Lift: CDU win sparks euro hope 🌟
• Markets: European futures pop—optimism flows 🔍
• Cash: $1.0530 peak shows buyer guts 🚦
Euro’s got some spark—briefly lit!
(7/9) – SWOT: WEAKNESSES & OPPORTUNITIES
• Weaknesses: $1.0510 cap, USD fights back 💸
• Opportunities: PMI beats could push $1.0600 🌍
Will euro dodge the dollar’s jab?
(8/9) – Euro’s election bump—what’s your call?
1️⃣ Bullish—Stability wins out.
2️⃣ Neutral—Blip, not a trend.
3️⃣ Bearish—USD takes the ring.
Vote below! 🗳️👇
(9/9) – FINAL TAKEAWAY
Euro spiked to $1.0507 on Germany’s vote—CDU’s steady hand 🌍🪙. Now $1.0480—USD’s got claws. Resistance bites, downside looms—blip or bust?
$HIMS - Please give us this DIP!If the gods bless us we can have a DIP BUY on NYSE:HIMS at $42-$48 range!
Have a GAP to fill at $46.34 as well.
Earnings Monday after the bell, could be the last time to see NYSE:HIMS at these levels if they crush!
Not financial advice

RobinHood - A bounce looks imminent!A bounce looks imminent on NASDAQ:HOOD
- At previous S/R Zone ✅
- At volume shelf ✅
- At green support beam ✅
I see a snapback higher to $56 🎯
Not financial advice

Nebius - A MASSIVE 113% Upside Potential!NASDAQ:NVDA recently bought shares of NASDAQ:NBIS
I'm riding as I see a 113% upside to $85! 🎯
- Bullish Channel
- Inverse H&S Breakout-retest-HIGHER!
- At Green Support Beam
- At Volume Shelf
- At Previous resistance to flip into support.
Not financial advice

Oscar Health is gearing up for a BIG MOVE!NYSE:OSCR is gearing up for a BIG MOVE!
Falling wedge is forming while Wr% is climbing!
Breakout = $28 🎯
Sitting on a MASSIVE Volume shelf as well.
Not financial advice

RKLB - Rocket ride to $28 inbound!NASDAQ:RKLB
Rocket ride to $28 inbound! 🎯
Have seen this play out here before...
Chart explains itself
Not financial advice

Tempus Ai is not done yet! 70% UpsideNASDAQ:TEM
Called the DIP, Now calling the RIP!
$115 Inbound! 🎯
- Volume Shelf
- Retesting previous highs to flip into support
- WCB Creating support and bottom
- H5 is GREEN with BUY SIGNAL
- Down on market weakness
Not financial advice
