Bitcoin(BTC/USD) Daily Chart Analysis For Week of May 30, 2025Technical Analysis and Outlook:
Bitcoin has undergone a significant decline during the current week's trading session and is presently situated at the Mean Support level of $103,000. This downward trajectory has the potential to establish a temporary pause, which may facilitate the emergence of upward momentum from this level, and it could pose a challenge to the Key Resistance level at 109500. A successful breach of this resistance may lead to the completion of the Inner Coin Rally target at $114500. However, it is crucial to acknowledge the possibility of renewed downward momentum from the current level, as this could result in a decline toward the Mean Support of 99000.
Investing

NEAR to $45? The Signs Are All There…Just imagine traveling through time.
Many people look back with regret, wishing they had invested in cryptocurrencies before previous bullish cycles. We've all heard phrases like "If only I had bought Bitcoin at $100, I'd be a millionaire by now."
But the real question is: Will you have the courage to make the right decision when the moment comes?
You might think I'm crazy for presenting these targets today — and that's okay. But trust me, in a few months, you'll witness the phenomenal power of our analysis system. The market is fractal by nature; what happens on lower timeframes inevitably plays out on higher ones.
NEAR is one of the most promising blockchains, and all signals are aligning for a move toward $45.
The question is: Do you have the courage to take action now?

$AMD When, not IF! 105% UPSIDENASDAQ:AMD - It's not a matter of if, but when...🚀
Once this downtrend on the weekly is broken out of with a big fat engulfing candle we will launch off this volume shelf like a SpaceX rocket to mars!
All indictors are curling up and I think the time is coming for AMD to make their ascent higher and back to ATHs!

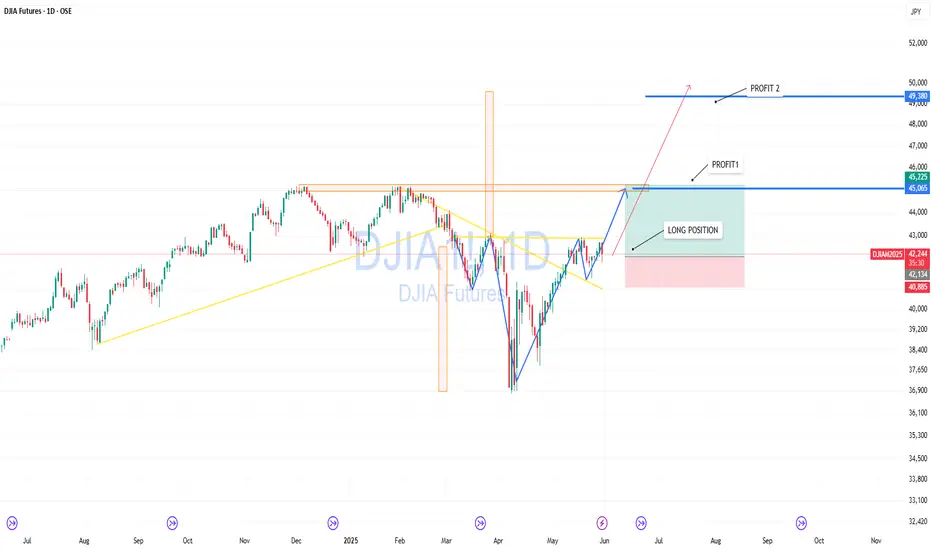
DJIA — Setting Up for Breakout and New ImpulseThe Dow Jones Index is approaching a critical resistance zone. After a deep V-shaped recovery and clear bullish structure, price is preparing for a breakout.
Chart shows a clean long entry with a stop below the recent consolidation. A break and hold above 45,000 could lead to a move toward 46,000, and if momentum holds — up to 49,300.
Partial profit-taking levels:
— Target 1: 45,225
— Target 2: 49,380
Fundamentally, US equity markets remain strong, and DJIA may play catch-up after lagging during the last correction.
$MBLY is BREAKING OUT - 224% UpsideNASDAQ:MBLY is breaking out - 224% Upside! 🚀
🎯$18.09🎯$20.03🎯$24.66🎯$34.26🎯$49.20
- Bullish H5_L Indicator
- Volume Shelf with GAP
- Inverse H&S with a MM to $49.20 (Already broke out and retested)
- Rising WR%
- Undervalued and at the forefront of AV Tech

Round 2 on $FUBO! 92% UpsideEarlier this year we caught the MASSIVE 400% move on NYSE:FUBO 🚀
1st PT is $4.89 🎯
2nd PT and MM of Falling Wedge is $5.86 📏
We've come full circle and we are back in them for another MASSIVE move!

$TEM - GET READY! 30%+ UpsideNASDAQ:TEM - GET READY!
✅ Inverse H&S Breakout
✅ Falling Wedge Breakout
🎯 Targets: $77.43 & $90.63 Before August!

Archer Aviation: Fact or Fiction in the Skies?Archer Aviation, a prominent player in the burgeoning electric vertical takeoff and landing (eVTOL) industry, recently experienced a significant stock surge, followed by a sharp decline. This volatility was triggered by a report from short-seller Culper Research, which accused Archer of "massive fraud" and systematically misleading investors on key development and testing milestones for its Midnight eVTOL aircraft. Culper's allegations included misrepresentations of assembly timelines, readiness for pilot-controlled flights, and the legitimacy of a "transition flight" to unlock funding. The report also criticized Archer's promotional spending and claimed stalled progress on FAA certification, challenging the company's aggressive commercialization timeline.
Archer Aviation swiftly and forcefully refuted these claims, labeling them "baseless" and questioning Culper Research's credibility, citing its founder's "shorting and distorting" reputation. Archer emphasized its strong first-quarter 2025 earnings, which saw a dramatic narrowing of net losses and a substantial increase in cash reserves to over $1 billion. The company highlighted its operational momentum, including strategic partnerships with Palantir for AI development and Anduril for defense applications, a $142 million U.S. Air Force contract, and significant early customer orders exceeding $6 billion. Archer also pointed to its progress on FAA operational certifications, having secured three of four essential licenses, and its preparation for "for credit" flight testing for Type Certification, a critical step towards commercial passenger operations.
Culper Research's past track record presents a mixed picture, with previous targets like Soundhound AI experiencing initial stock declines followed by strong financial rebounds, though some legal challenges persisted. This nuanced history suggests that while Culper's reports can cause immediate market disruption, they do not consistently predict long-term corporate failure or fully validate the most severe allegations. The eVTOL industry itself faces immense challenges, including stringent regulatory hurdles, high capital requirements, and the need for extensive infrastructure development.
For investors, Archer Aviation remains a high-risk, long-duration investment. The conflicting narratives necessitate a cautious approach, focusing on verifiable milestones such as FAA Type Certification progress, cash burn rate, successful commercialization execution, and Archer's comprehensive response to the allegations. While the "fraud" thesis might be "overblown" given Archer's verifiable progress and strong financial position, ongoing due diligence is crucial. The company's long-term success hinges on its ability to navigate these complexities and meticulously execute its ambitious commercialization plan.

GBPCHF: Long Setup – Bounce from Trendline + EMA CrossThe price has bounced from the lower boundary of the ascending channel and confirmed a bullish reversal after EMA cross. Current momentum supports a long position.
📌 Entry: Market buy (current price ~1.1142)
🎯 Targets:
TP1: 1.1291 – minor resistance
TP2: 1.1394 – upper channel border
🛡️ Stop-loss: Below 1.1090 (under channel + EMAs)
This setup favors continuation of the bullish trend after liquidity grab and structure shift.

$CPNG is flying and has more room: 61% UpsideNYSE:CPNG has been on a heater! 🚀
First target is $35 🎯
CupnHandle breaking out = $43.65 📏
Looking for a pullback off the red barrier to enter this name after the breakout! 💪

S&P 500 Daily Chart Analysis For Week of May 23, 2025Technical Analysis and Outlook:
The S&P 500 Index demonstrated a consistent downward trend during this week's trading session, reaching a significant target at the Mean Support level 5828. The index is currently trending lower, targeting the Inner Index Dip at 5730, with additional marks identified at the Mean Support levels of 5660 and 5600. Conversely, the index has the potential to rebound from its present position, advancing toward the Mean Resistance level of 5860 and retesting the previously completed Outer Index Rally at 5955.

EUR/USD Daily Chart Analysis For Week of May 23, 2025Technical Analysis and Outlook:
The Eurodollar has demonstrated significant strength during this week's trading session, attaining a notable Inner Currency Rally at 1.129 and encountering Mean Resistance at 1.137. Recent analyses indicate that the Euro will likely progress towards the forthcoming target levels, specifically the Mean Resistance at 1.142 and the Key Resistance at 1.151. A retest of the completed Outer Currency Rally at 1.157 may facilitate this advancement. However, a potential downward pullback could emerge from the current price range, particularly in proximity to the Mean Resistance level of 1.137, with a possibility of declining to the Mean Support at 1.127.

Bitcoin(BTC/USD) Daily Chart Analysis For Week of May 23, 2025Technical Analysis and Outlook:
In the course of this week's trading session, Bitcoin demonstrated significant upward movement, surpassing both Mean Resistance at 105000 and Key Resistance at 106100. This progression also facilitated the surpassing completed Inner Coin Rally at 108,000, and the highly anticipated Outer Coin Rally marked at 110000. As a result, the cryptocurrency experienced a substantial decline, currently aiming toward Mean Support at 105600, with a potential further decline toward an additional Mean Support target at 101500.
It is essential to acknowledge the possibility of an upward momentum emerging from the current level, which may enable a challenge to Key Resistance at 111700. Success in this regard could result in reaching the Inner Coin Rally at $114500 and, subsequently, the Outer Coin Rally at 122000.

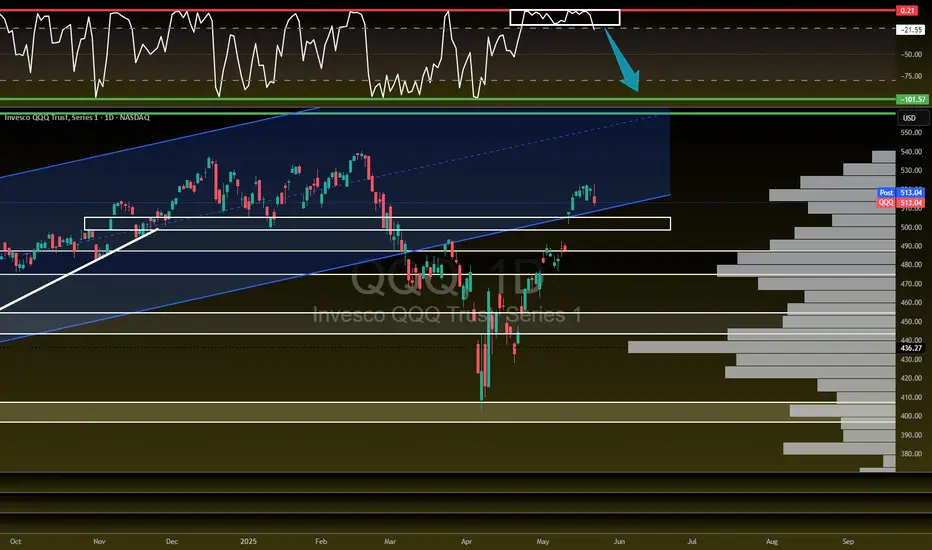
$QQQ Needs this pullback to happen!NASDAQ:QQQ a healthy pullback to fill the GAP and retest the 100/200DMA here going into next week.
A break through these MA's would be very bearish.

QQQ about to FLUSH?! Let's talk about it!I'm not saying it's over but you have to admit it does feel like we are going to see a decent size pullback...2-6% over the next few weeks on the NASDAQ:QQQ AMEX:SPY
- TVC:VIX back over 20
- US20Y hit 52 week high
- USDJPY starting to creep towards April lows
- $491.54 GAP to fill on NASDAQ:QQQ
- $447.58 Bigger GAP to fill on NASDAQ:QQQ
- Credit starting to become and issue
- Banks/ Credit companies tanked today
There is bullish pieces as well but we do look extended here and a healthy 2-6% would be welcomed...A break of $475 level spells trouble on QQQ.
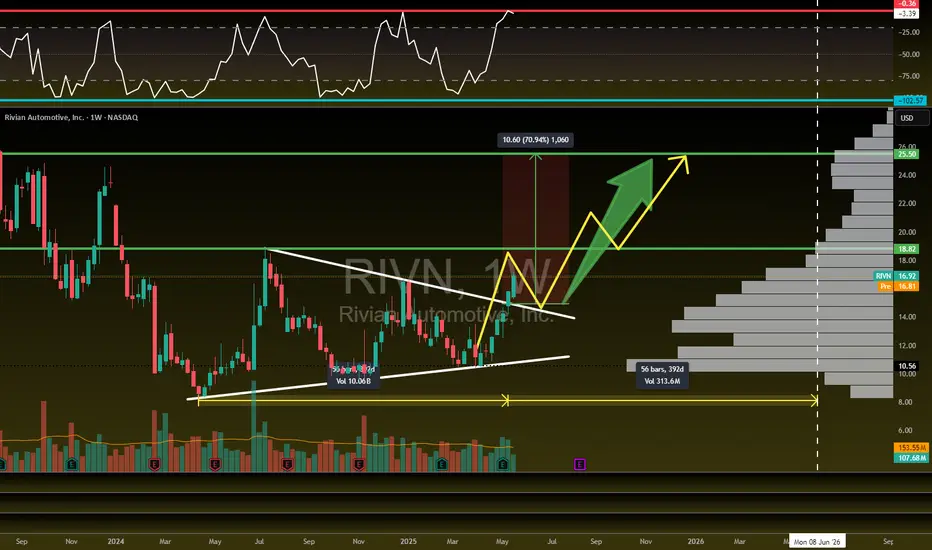
Rivian is flying! 71% UpsideNASDAQ:RIVN is flying! ✈️
Looking for a pullback to retest our breakout then move higher to our profit targets...Posted this setup last week in the community.
🎯$18.82📏$25.50
- Bullish H5_L Indicator
- Running into Red barrier (Need WCB to form)
- Volume shelf launch
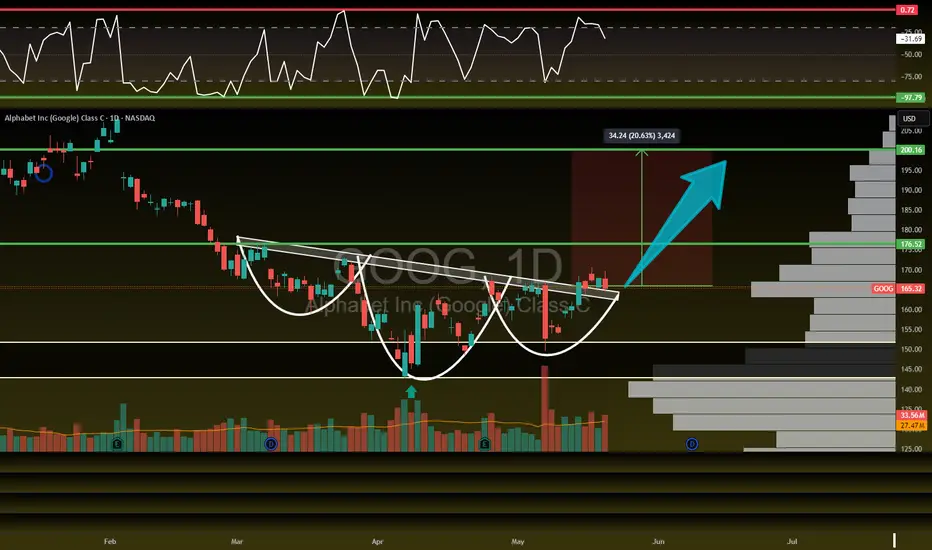
Google primed for a 20% move!NASDAQ:GOOG NASDAQ:GOOGL looks COILED! 🚀
Currently retesting Inverse H&S breakout and H5_S Indicator here.
Bounce will lead us too...🎯$176.52📏$200.16
- Volume shelf launch
- Bullish WR%
- Bullish weekly uptrend
- Severely undervalued
$RDDT is setup for a big fall! 44% DownsideI was looking at a bullish setup on NYSE:RDDT but it invalidated and the bearish setup is way stronger!
Bear Flag Breakdown = MM of $61.81 🎯
- Below H5_L indicator
- Breaking down out of bear flag
- Below volume shelf with GAP to fill
- Bearish WCB formed

THIS TIME IT'S DIFFERENT!🔥 THIS TIME IT'S DIFFERENT! 🔥
Can you see the shift?! VOLUME IS HERE—AND IT'S MASSIVE. 💪💰
Unlike those weak, fleeting rallies that got crushed under waves of red, this one is packed with bullish buyers and offside hedge funds READY TO SEND IT HIGHER. 🚀📈
Not to mention the last time we had this level of above average volume for this long was in October 2023 when we were coming out of a bear market and it was only the beginning of our ascent higher!
I'm not saying we can't have a pullback soon...I'm just simply saying the volume is here and it looks like dips will indeed be shallow.
ATH retest INBOUND!
Are you positioned for the move? 👀
AMEX:SPY NASDAQ:QQQ

Europe’s Political Powder Keg: Markets on Edge!🔥 Europe’s Political Powder Keg: Markets on Edge! 🔥
Europe’s elections just dropped a BOMB! 💣 Poland (May 18), Portugal (May 18), and Romania (May 4 & 18) rejected far-right surges, but the center’s crumbling. 🇪🇺 Poland’s pro-EU Trzaskowski barely leads—June 1 runoff could flip it! Portugal’s Chega is shaking the old guard, and Romania’s Nicușor Dan rides an anti-corruption wave.
Why care? Political chaos = market volatility. 📉 EUR/USD is wobbling, DAX could tank, and defense stocks (🇺🇦 ties) are in play.
💡 Trade Idea: Overlay EUR/USD with election dates (May 4, May 18, June 1) to catch volatility spikes.
❓ What’s your move? Will Europe’s turmoil crash markets or spark a rally? Drop your take below! 👇

Gold Fields Limited $GFI: A Golden Opportunity in 2025? Gold Fields Limited ( NYSE:GFI ): A Golden Opportunity in 2025? 🏅💰
1/10
Gold production at NYSE:GFI declined 4% to 2.30 million ounces in 2023, but the company's All-In Sustaining Costs (AISC) stayed strong at US$1,295/oz, beating expectations. Stable cost control is key here. 📉 Can gold prices lift revenues?
2/10
Gold Fields' Salares Norte project is set to ramp up production in 2025. Investors see potential— NYSE:GFI rose 4.1% on Feb 3, 2025, closing at $17.63. Optimism is brewing. 🌄 Will Salares Norte be a game-changer?
3/10
Gold stocks are heating up! NYSE:GFI is outperforming peers like Harmony Gold and AngloGold Ashanti in 30-day returns. Yet analysts hold a neutral "hold" rating. 🏆 Are they underestimating future upside?
4/10
Gold Fields is focused on high-grade gold projects while controlling costs. Market valuation may not yet reflect its potential gains if gold prices keep rising due to inflation and geopolitical tensions. 📊
5/10
But there are risks... Gold price volatility remains a double-edged sword. Economic conditions, inflation, and sentiment can drive sharp swings in gold demand and prices. ⚖️ Can NYSE:GFI weather these storms?
6/10
Strengths: Gold Fields boasts efficient cost management and diversified operations across multiple countries. Geographic diversification helps mitigate risks tied to any single government or policy change. 🌍
7/10
Weaknesses: High capital expenditures for projects like Salares Norte could weigh on short-term cash flow. Plus, Gold Fields has limited growth prospects outside current regions. 🏗️ How fast can expansion pay off?
8/10
Opportunities: The Salares Norte project is a major catalyst. If successful, it could significantly boost production and revenue. Rising gold prices further enhance this outlook. 🚀
9/10
Threats: Delays or operational hiccups at Salares Norte could derail projections. Global economic downturns might also reduce investor appetite for gold. 🛑 Can GFI stay on track?
10/10
What’s your take on Gold Fields Limited NYSE:GFI ? Will it shine or stumble in 2025? Vote below! 🗳️
Golden buy opportunity 🏆
Hold for now 🔄
Too risky, avoid ⚠️

Barrick Gold Corporation ($ABX): Golden Opportunity or Risky
Barrick Gold Corporation (ABX): Golden Opportunity or Risky Prospect? 🏆💰
1/10
Barrick Gold TSX:ABX has seen a solid financial performance recently. EPS for the last quarter hit C$0.42, with next quarter estimates at C$0.63. They beat estimates 75% of the time in the past year. 📈
2/10
Analysts are bullish! The average price target is C$33.57, implying a potential upside of 50.13% from the current C$22.36 price. Strong Buy ratings dominate: 10 Buy, 2 Hold. 🔍 What do analysts know that the market doesn’t?
3/10
However, ABX is facing operational challenges. A suspension in Mali due to government intervention highlights geopolitical risks in mining. 🛑 Regulatory challenges are part of the gold mining game.
4/10
Stock price check: ABX currently trades at C$23.15. That’s 20.94% below its 52-week high of C$29.28 but 21.59% above its low. What does this tell us? Room for recovery, but risks loom. 📊
5/10
Valuation time! Compared to sector peers, Barrick offers an attractive price level, especially given the 50% upside target. Analysts love undervalued plays like this, but what about the risks? 🤔
6/10
Strengths: Barrick operates across multiple countries, ensuring diversified production. That’s crucial in a volatile gold market. 🌍 Diversification is a key defensive strategy here.
7/10
Challenges: High operational costs are always a concern. Pair that with political instability, like the Mali suspension, and ABX faces a steep uphill climb. 🏔️ How much risk are you willing to take on?
8/10
Opportunities: Expansion is always on the table. With gold prices looking stable, Barrick could capitalize on new projects or mines. But timing matters in this market. ⛏️
9/10
Threats: Regulatory and political risks never sleep. Changes in mining laws or political unrest can hit Barrick hard—Mali’s situation is a prime example. Always know your risks. ⚠️
10/10
What’s your take on Barrick Gold TSX:ABX ? Will it strike gold again? Vote here! 🗳️
Buy for the long term 📈
Hold and watch growth 🔄
Too risky, avoid 🚫

Deposits All Commercial Banks & US DebtWhen a politician and their buddy start spouting nonsense about the US debt spiraling out of control, but then insist that tax cuts are great because they’ll create jobs, and all that money will somehow trickle down to the rest of us, magically boosting tax revenue to "make up" for the lost funds.
Especially when that same politician was re-elected bc inflation & the economy were just so horrible, promising he would come in and save the day bringing prices down again with more tax cuts because they worked so great the first time around.
That's the extreme right. What about the extreme left #MMT?
#MMT is just as bad as MAGAs! They will tell you deficits are great! Deficits add to our savings! Deficits make us all richer! It's accounting, they say! it has to be that way! Except for the little fact that it's not based on empirical evidence.
So the next time some B.S. Artist tells you their little version of a fictional money story, you will know what reality is since 2018. You will have seen this chart with your own eyes and cannot unsee it! No matter what you do, no matter what side you lean politically, it's irrelevant.
Public debt since the tax cuts have grown exponentially, while the private sector deposits have lagged to the point they have stagnated completely since 2021. Barely rising 6%.
Defunding CIA, FBI, USAID, Dept of Education etc.. will do absolutely nothing to make up for all the lost tax revenue since 2018 and the next tax cuts to follow. In fact, when we enter a recession, the deficits will explode even higher as tax revenues collapse and social and economic stabilizers (if there are any left) kick in. Then what?
Don't shoot the messenger!
