EURUSD1h - On the hourly timeframe, there has been aggressive movement over the past two days without any correction, resulting in significant unabsorbed liquidity above. It would be beneficial to observe sideways movement in the Asian session with liquidity absorption below, followed by a structural shift to a long context.
Investing

EURUSD 1D1D - On the daily timeframe, we continue to remain in a short context. Based on the aggressive end of the week, I anticipate the beginning of a corrective movement to build liquidity, with targets aiming for partial overlapping of the FVG.

EURUSD 1W1W - On the weekly timeframe, we've switched to a short context. I anticipate that the next week will largely be characterized by sideways movement, after which we'll continue the movement towards the specified targets below.

S&P 500 Daily Chart Analysis For Week of April 12, 2024Technical Analysis and Outlook:
The Spooz continue to experience a severe drop in this week's trading session, hitting our two Mae Sup levels: 5150 and 5120, respectively. The current price action indicates that the market will pursue an upside movement to target our Mean Res 5208 and beyond. On the downside, Spooz may continue on a downward spiral to the Mean Support level of 5070 and Outer Index Dip at 5045, which is expected to act as a launching point to reignite its bullish trend.

EUR/USD Daily Chart Analysis For Week of April 12, 2024Technical Analysis and Outlook:
The Eurodollar has completed an Inner Currency Dip of 1.065. This momentum is expected to generate further selling pressure, resulting in a decline to the next Inner Currency Dip of 1.054. Ultimately, the Eurodollar is expected to reach an Inner Currency Dip of 1.045. It is worth emphasizing, however, that an interim rebound to the Mean Resistance level of 1.075 may be feasible before the Eurodollar resumes its downward trajectory.

Bitcoin(BTC/USD) Daily Chart Analysis For Week of April 12, 2024Technical Analysis and Outlook:
This week's trading session Bitcoin completed the forthcoming Inner Coin Rally 72500, and as expected, the coin retraced to our designated Mean Sup 65600. Bitcoin is in the process of rebounding back to the 72500 scene of crime. On the downside, the market potential decline may occur, resulting in Bitcoin falling to Key Sup 61300 and an Inner Coin Dip 57200. The bull stage movement will arise from current price action or Key Sup 61300 and an Inner Coin Dip 57200, respectively.

5% Trade Ideas #5PercentTrade -JUBLINGREA #5PercentTrade #Equity
5% Trade Ideas is a type of Equity Investment which is designed to give you 5% to 10% return in lest than 21 days via #Equity #Investment.
✅ Stock Name - NSE:JUBLINGREA
Trade Process :-
✅ - Buy only at Buy Level as recommended in the chart. Use GTT feature available with all online brokers
✅ - On successful purchase, immediately create a SL GTT (Stop Loss level asper chart).
✅ - Once Stock Price is at Target 1 level, move your SL to Cost Price or 3% down from Target 1.
✅ - Keep Trailing the SL as Stock Price moves to next Targets.

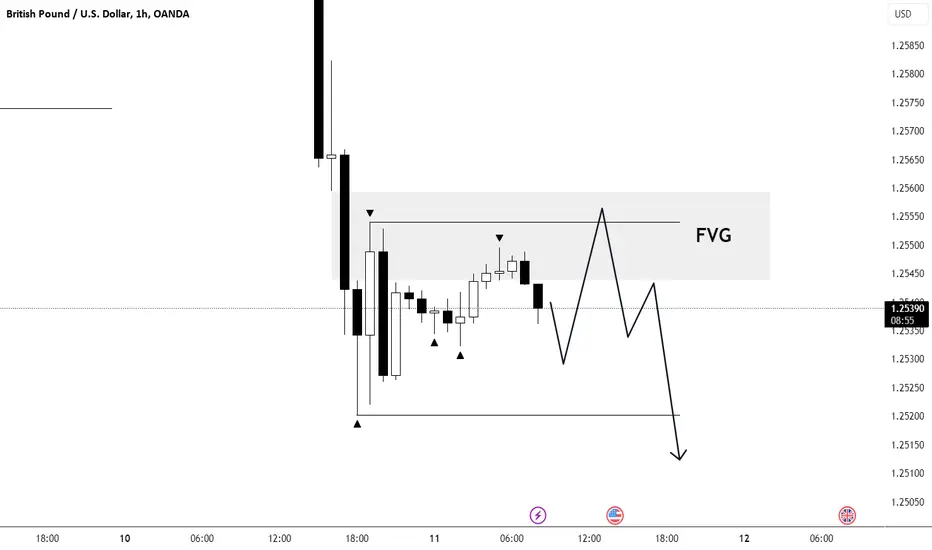
GBPUSDOn the pound, there are no significant differences observed compared to the euro. There is also a clear short order flow, and positions can be considered based on reactions to FVG with targets for continuation in short direction

EURUSD Day PlanWe continue with the short order flow on the euro, and the context remains short as well. There are no significant signs of a reversal observed yet. For a change in sentiment on the primary timeframe, it is important for the price to establish itself above 1.0735. I don't expect any particularly clear movements for the day since the intraday target at PDL has been reached.

8000 MARKET CAP IS BOUND TO 11 THOUSAND MARKET CAP IN 100 DAYSArchean Chemical Industries Ltd, incorporated in the year , has its registered office in No 2 North Crescent Road, T Nagar, Chennai, Tamil Nadu, 600017, 91-44-61099999. The main industry in which Archean Chemical Industries Ltd operates is Chemicals.
Auditor/Auditors for Archean Chemical Industries Ltd is/are PKF Sridhar & Santhanam LLP. In the main management, is chairman and G Arunmozhi is the company secretary for Archean Chemical Industries Ltd.
SPOT 653
DATE 12 APRIL 24
777 EXPECTED TO GO
ADD UPTO 636
MAIL US FOR MORE VIJAY at Vijaymarketingg . com
HAPPY INVESTING

EURUSD#EURUSD
day plan. Short context on all TF planinng to open possitions with a target of PDL.
lots of news today, in NY open be careful

EURUSD 1D1D - We removed the fractal liquidity above on the daily timeframe, and the target for further movement is the nearest fractal minimum. Until then, I continue to consider positions for a downtrend.

EURUSD - Expecting Further DropRight now, the value of the Euro (EUR) compared to the US Dollar (USD) is low (around 1.0740) as per strong Dollar (USD) considering the following factors:
The European Central Bank (ECB) will likely keep interest rates the same this Thursday, but might consider lowering them in June.
The US Federal Reserve (Fed) might wait longer to lower interest rates because the US economy is doing well and inflation is higher than expected.
This difference in interest rates between the ECB and Fed is making the EUR weaker.
Unexpectedly high inflation in the US in March caused people to believe the Fed won't lower rates as soon as they thought. This made the USD even stronger.
Investors are waiting to see what the ECB decides about interest rates later today and what other economic data comes out of the US.
Overall, our sentiment is still bearish, and we expect some pullback before seeing a further drop in EUR, please see the chart for details.

NVIDIA (NVDA): Why $1,077 Could Be Just the Beginning!NVIDIA (NVDA): NASDAQ:NVDA
In our last analysis of NVIDIA, we presented an alternative scenario. However, given NVIDIA's relentless momentum, we find ourselves needing to adjust this scenario once more. We are now inclined to believe that we are still within a subordinate Wave 3 of the overarching Wave (3), anticipating that the price must reach at least the $1,030 mark, particularly considering the subordinate Wave ((iii)) precisely hit the 461.8% level.
Following a rapid sell-off to Wave (a), we've observed the formation of Wave (b) with a three-wave structure right at the 100% mark. This leads us to position an entry for Wave (c) or Wave ((iv)), as we theoretically should achieve the 100% mark here too, aligning with the minimum 23.6% level for a Wave 4 around the 100% mark, thus establishing our entry point.
Moreover, the gap present, along with the underlying support zone, could be crucial. Hence, we're setting our stop-loss just below this zone. For the upward movement, we anticipate that the subordinate Wave ((v)) of Wave 3 could reach at least up to $1,077, fitting within our minimum target range for Wave 3 and aligning well with our expectations. Should the price drop below this level, other zones could potentially accommodate a Wave ((iv)), but such a scenario would not be as rule-compliant, making this current scenario more likely than others.
Considering NVIDIA's recent performance, this setup presents a favorable risk-to-reward ratio for a short-term trade.
R:R - 6.3
Risk: max. 1%

NEO FOR FUNDING TRADERS For all funding traders who deal with this business, mostly the broker gives you some of the cryptocurrencies to trade. Neo is one of them.
I see some liquidity between 14-15 and at the same time a vector candlestick that appears and it fills up until 12.18. Wait for the market makers to do what they have to do and come back at low prices, maybe a little higher, maybe a little lower. Another scenario that can happen is a breakthrough from a double bottom that has been in place for more than a year. Targets can be POC range 08 December 2021 - 01 May 2022, VAH and at the same time the maximum target of pattern 29.37.
