EUR/USD Daily Chart Analysis For Week of March 28, 2025Technical Analysis and Outlook:
The Euro has experienced a downward trend in the current trading session, surpassing the Mean Support level of 1.078, where an intermediate price reversal occurred. The analysis indicates that the Eurodollar is expected to retest the Mean Resistance level at 1.086, with a possible resistance level marked at 1.095. A downward momentum may be initiated from either the Mean Resistance of 1.086 or 1.095.
Investing

Bitcoin(BTC/USD) Daily Chart Analysis For Week of March 28, 2025Technical Analysis and Outlook:
Bitcoin underwent several significant peaks as it completed the Interim Coin Rally 88400. Subsequently, it experienced a decline, moving towards the Mean Support 82500, with the possibility of extending its trajectory to retest the previously completed Outer Coin Rally 78700. An upward momentum may be initiated from the Mean Support of 82500 or the Key Support of 79000/completed Outer Coin Dip of 78700.

Eternal Sunshine of the Spotless MindHere you have Charles Thomas Munger, the permanent vice president of one of the most successful companies in the world, Berkshire Hathaway. He was not at the origins of this business, but it was Charles, together with Warren Buffett, who turned a dying enterprise into a star of the world stock market. It didn't take a Master's degree in Business Administration or incredible luck. As Mr. Munger said, to succeed you don't necessarily have to strive to be the smartest, you just have to be not stupid and avoid the standard ways of failure. He worked as a meteorologist, then a lawyer, and finally as someone we know well - an investor who inspired many to take a smart approach to business and their own lives.
“I don’t think you should become president or a billionaire because the odds are too great against you. It is much better to set achievable goals. I didn't set out to become rich, I set out to be independent. I just went a little overboard”, Charles joked. Wake up every morning, work hard, be disciplined and surprisingly, everything will work out very well. This commandment sounds a little archaic in times of rapid rise and easy money. However, for anyone who thinks years and decades ahead, it is difficult to come up with something better.
Speaking to students at his hometown University of Michigan, Mr. Munger said the most important decision you make in life is not your business career, but your marriage. It will do more good or bad for you than anything else. He attached such great importance to human relationships. This correlates strongly with a study of human happiness that has been ongoing for over 85 years under the auspices of Harvard University. The scientists' main conclusion was that everything we build (portfolios, businesses, strategies) is worthless if there is no person in our lives to whom we can say a simple “I'm here”. Or “Thank you”. Or “I love you”.
The healthiest and happiest in old age were not those subjects who earned the most. And those who have maintained good, trusting relationships. Marital. Friendly. Related. And in this light, Charles Munger's words about caution, moderation and common-sense sound quite different. It's not about money. It's about a life that can be lived with the feeling that you have enough. That you don't have to be a hero. That you can just be a reasonable person. Loving. Healthy. Calm.
Perhaps this is the main secret of Mr. Munger's success in the stock market? In the long run, the one who has already won achieves a positive result.
November 28th, 2023, was the last day of the cheerful Charlie's life. There were 34 days left until his 100th birthday.

The Power of Commitment in Trading Psychology: A Key to Success
The Power of Commitment in Trading Psychology: A Key to Success 📈💡
Hey TradingView community! I’ve been diving into some trading books lately, and one chapter really hit home: it’s all about commitment. Turns out, it’s the key to making it as a trader—especially in the crypto space where volatility can test your emotions. Here’s what I learned and how I’m applying it to my trading mindset.
Commitment isn’t just about showing up—it’s about promising yourself to be the best trader you can be. I read about a guy who made a ton of money but lost it all because he wasn’t fully in. It made me realize: you can’t just dabble in this game. You gotta go all in. For me, this means sticking to my trading plan, even when the market (or my emotions) tempts me to stray. In crypto, where prices can swing wildly, this is crucial.
One big thing that messes with commitment is the battle between wanting quick wins and sticking to a plan. I’ve caught myself following random advice without thinking—anyone else been there? It’s a trap. Commitment means getting your mind, emotions, and actions on the same page. I’m working on staying disciplined by focusing on my system, even during losing streaks. For example, I use stop-losses and take-profits to keep my emotions in check when trading BTC or ETH.
Here’s a 3-step process I picked up to build commitment:
1️⃣ Figure out what you really want from trading (e.g., steady growth, not just mooning coins).
2️⃣ Spot what’s getting in your way (like fear of losses or FOMO).
3️⃣ Make a plan to push through—like setting clear risk management rules.
For me, this has been a game-changer in staying consistent, especially in volatile markets like crypto.
Psychology matters so much! A lot of traders fail not because their system sucks, but because they can’t stick with it. I’m starting to see how knowing myself better helps me stay committed. Some practical stuff I’m trying: starting small to build confidence, sticking to my system no matter what, learning from experienced traders, and not letting fear of losses throw me off. My current focus is on keeping my position sizes small (1-2% risk per trade) and reviewing my equity curve weekly to ensure I’m on track.
Biggest takeaway: commitment is what makes or breaks you as a trader. It’s about knowing yourself, staying disciplined, and pushing through the tough times. I’m ready to step up—how about you?
What’s your biggest challenge with staying committed in trading?
Let’s discuss in the comments! 👇

Mobileye Lands VW! 50% UpsideNASDAQ:MBLY - Wedge Breakout
Look for a retest of wedge for entry in the $16's.
Price Targets are $22 & $25 🎯
Mobileye inks deal with Volkswagen Group!
Not financial advice

Vanguard - “We are the invisible hand of Adam Smith” John BogleIf anyone ever thought of erecting a monument to the person who did the most for American investors — the choice would fall on John Bogle. These words are not from a promotional brochure but a quote from Warren Buffett himself.
Book summary
But most people don’t even know who Bogle is. And certainly don’t realize that he didn’t just “create index funds.” He built an invulnerable power machine disguised as client care.
📈 From a thesis to $10 trillion under management
Bogle’s story begins with an ordinary guy born during the Great Depression. Through poverty, scholarship-based education, and working from age 10 — he makes his way into Princeton, where he writes a thesis on a topic that would change the industry: "mutual funds."
Over the years, his philosophy turned into what we now know as "passive investing." From day one, the Vanguard he created operated on the principle: "maximum benefit to the investor, minimum — to the managers." No fees, no speculation, no marketing. And it worked. But here’s the paradox: ▶ Vanguard gave up profit for the mission.
▶ The world responded — investors were tired of the noise.
▶ As a result — "Vanguard grew into a monster capable of managing the economies of entire nations."
🧠 A revolutionary idea: a fund owned by investors
Bogle built a structure where "the fund owners are the investors themselves."
Sounds beautiful: no shareholders, no profit pressure — only long-term client interests. But then who de facto manages these trillions?
⚠️ Vanguard is not a public company.
⚠️ Its shares are not traded.
⚠️ The real ownership mechanism — a black box.
It’s the perfect system for... "invisible control." And this isn’t a conspiracy theory, but logic:
If you can’t find the ultimate beneficiary — it means they’re either too big, or hiding for a reason.
🕸️ The “Big Three” and the invisible hand effect
Vanguard, BlackRock, and State Street — three funds that hold between 3% to 8% of shares in most of the world’s largest corporations. It seems small, but only 15–20% of shares are in free float.
❗ This gives the Big Three “real power”: from voting at meetings to influencing media narratives and climate policy.
📌 They own stakes in CNN, Fox, and Disney.
📌 Invest in oil companies that violate human rights.
📌 And at the same time — push the “green transition” agenda.
Conflict of interest? No. It’s “total control over both sides of the conflict.”
🤫 Why Vanguard is impossible to destroy
If you think Vanguard is just an investment fund, here are a few facts:
🔒 No company shares → can’t buy a controlling stake.
🔒 Over 400 legal entities → can’t file a single lawsuit.
🔒 Every investor essentially becomes a “co-owner” → responsibility is blurred.
🔒 All stakes split below 10% → bypass antitrust laws.
You can’t sue a ghost.
You can’t attack a network if you don’t know where its center is.
🧭 What’s next?
Today, Vanguard manages over $10 trillion, which is more than the GDP of Germany, India, and Brazil combined.
Though the fund’s founder passed away as “the conscience of Wall Street,” his creation became an "architecture of global control" that even the U.S. Federal Reserve couldn’t handle.
🎤 “We are the invisible hand of Adam Smith,” John Bogle once said.
A more detailed book review will follow below. I understand how important this is in our time and I appreciate it.
📘 General Concept of the Book:
The book is at once the autobiography of John Bogle, the story of the founding and development of Vanguard, and a manifesto of index investing philosophy. A runaway waiter, Princeton graduate, and "Wall Street rebel," Bogle creates Vanguard — a company that changed the investment world by making it more fair and accessible.
📑 Structure of the Book:
The book is divided into four parts:
Part I — The History of Vanguard.
Part II — The Evolution of Key Funds.
Part III — The Future of Investment Management.
Part IV — Personal Reflections, Philosophy, and Values of the Author.
💡 Key Ideas of the Book (Introductory Chapters, Preface):
- Index investing is the most important financial innovation of the 20th century.
- Passive management beats active managers in returns and costs.
- Vanguard’s mission is not to make money off investors, but to serve them.
- Criticism of Wall Street: high fees, conflicts of interest, short-term thinking.
- Financial revolution — a mass shift of investors from active to index funds.
🧠 Bogle's Values:
- Long-term thinking. Don’t give in to market “noise.”
- Honesty and transparency in investing.
- Minimal costs = maximum return for the investor.
- Fiduciary duty: protecting the client’s interest comes first.
📗 Part I: The History of Vanguard
🔹 Chapter 1: 1974 — The Prophecy
Context:
John Bogle is in a difficult position — he’s fired as head of Wellington Management Company.
During a trip to Los Angeles, he meets John Lovelace of American Funds, who warns: if you create a truly mutual investment company, you’ll destroy the industry.
Main Idea:
⚡ Bogle decides to go against the profit-driven industry and creates Vanguard — a company owned by investors, not managers.
Key Moments:
- Vanguard is founded in 1974 — in the middle of a crisis.
- The company has no external shareholders — all “profits” are returned to investors through lower fees.
- In 1975, the first index fund for individual investors is launched — a revolutionary idea, initially ridiculed as “Bogle’s madness.”
Important Quotes:
"Gross return before costs is market return. Net return after costs is lower. Therefore, to get the maximum, you must minimize costs."
– Bogle’s fundamental rule
🔹 Chapter 2: 1945–1965 — Background: Blair Academy, Princeton, Fortune, and Wellington
Early Life:
Bogle studies at Blair Academy on a scholarship, works as a waiter.
He enters Princeton. Struggles with his economics course, but…
In the library, he accidentally finds the Fortune article “Big Money in Boston” — about mutual funds.
Turning Point:
This article inspires Bogle to write his thesis:
“The Economic Role of the Investment Company”, where he argues:
- Funds should work for investors;
- Don’t expect them to beat the market;
- Costs must be minimized;
- Fund structure must be fair and transparent.
Career Start:
Work at Wellington Management (Philadelphia).
Starts from scratch, rising from junior analyst to president of the company.
Under Walter Morgan’s leadership, he learns the principles of discipline and serving investors.
✍️ Interim Summary
What’s important from these early chapters:
- Vanguard was born from the ruins of Bogle’s former career — an example of how failure can be the beginning of greatness.
- Already in college, Bogle saw the issue of conflicts of interest in the industry.
- His philosophy is idealism in action: don’t play guessing games — just invest in the market and reduce costs.
📘 Chapter 3: 1965–1974 — Rise and Fall
🚀 Appointed President of Wellington Management:
In 1965, at just 35 years old, John Bogle becomes president of Wellington.
He decides to modernize the business and bring in young star managers from Wall Street, especially from the firm Thorndike, Doran, Paine & Lewis.
⚠️ Risky Alliance:
Bogle makes a fatal mistake — he merges with the new management company without ensuring value alignment.
The new partners are focused on profit and short-term gains, not building a strong long-term foundation.
This leads to internal conflict, loss of trust, and poor fund performance.
💥 Dismissal:
In 1974, after a series of conflicts, the board removes Bogle.
He loses control of the company he built for nearly 25 years.
Bogle’s comment:
"I was fired, but I was still chairman of the Wellington mutual funds — and that turned out to be a lifeline."
📘 Chapter 4: 1974–1975 — The Birth of Vanguard
🧩 A Unique Legal Loophole:
Though Bogle was fired from the management company, he remained head of the Wellington Fund trustees — giving him the opportunity to build a new independent structure.
🛠 Creating Vanguard:
In December 1974, he launches The Vanguard Group — a company owned by the investors (shareholders) themselves.
Model: the fund belongs to the investors → the fund owns the management company → no outside profit, only cost recovery.
⚙️ "Vanguard" as a Symbol:
The name was inspired by Admiral Horatio Nelson’s ship — HMS Vanguard.
A symbol of leadership, courage, and moving against the tide.
Key Idea:
Vanguard would be the only truly mutual investment organization — a model where clients = owners.
📘 Chapter 5: 1975 — The First Index Fund
🤯 Revolution: The Indexing Approach
Bogle decides to create the first index mutual fund for retail investors.
Name: First Index Investment Trust (later — Vanguard 500 Index Fund).
Idea: invest in all S&P 500 stocks to reflect the market’s return instead of trying to beat it.
🪓 A Blow to the Industry:
The financial world reacts harshly:
- “Bogle’s madness”;
- “This is a failure”;
- “Who would want to just match the market?”
🔧 Humble Beginning:
The goal was to raise $150 million, but only $11 million was collected — tiny by industry standards.
But Bogle didn’t give up:
"It was a small step, but with a powerful message."
💡 Summary of Chapters 3–5: How Vanguard Was Built
🔑 Event 💬 Meaning
Loss of control at Wellington ----- Collapse of the old model, beginning of a new path
Creation of Vanguard------------- Innovative, investor-first structure
Launch of index fund--------------Start of the indexing revolution, Bogle’s core philosophy
📝 Quotes for Thought:
"All I did was apply common sense. I just said: Let’s leave the returns to the investors, not the managers." — John Bogle
"This is a business where you get what you don’t pay for. Lower costs = better results." — Bogle’s favorite saying, debunking “more is better”
📘 Chapter 6: 1976–1981 — The Survival Period
⏳ Tough Start:
After launching the index fund, Vanguard faces slow growth and constant skepticism.
For 83 straight months (nearly 7 years!), Vanguard sees net outflows — investors are hesitant to trust this new model.
🧱 Laying the Foundation:
Bogle and his team focus on:
- Transparency
- Lowering costs
- Investor education (they explain what it means to “stay the course”)
💬 The Core Dilemma:
"All investors want to beat the market. But no one wants to pay the price: high fees, taxes, risks. We offered an alternative — reliability, simplicity, and low cost."
📈 Small Wins:
Despite modest volume, Vanguard starts building a reputation as an “honest player.”
It becomes evident: investors using Vanguard achieve better long-term results than those chasing trendy funds.
📘 Chapter 7: 1982–1991 — Growth and Recognition
💡 The Power of Philosophy:
Bogle keeps repeating: “Stay the course” — don’t try to predict the market, don’t fall for fear and greed.
This message becomes especially powerful after the 1982 and 1987 market crises.
🏆 The First Fruits:
A slow but steady increase in assets begins.
Vanguard launches new index funds:
- Total Stock Market Index
- Bond Index
- International Index
📣 Educational Mission:
Bogle writes books, articles, gives interviews.
He isn’t just running a fund — he’s changing how people think about investing.
A community of followers emerges — the Bogleheads.
📊 Key Stats:
By 1991, Vanguard's assets reach around $130 billion.
Index funds begin receiving positive reviews from analysts, including Morningstar.
📘 Chapter 8: 1991–1999 — Industry Leadership
🚀 Explosive Growth:
In the 1990s, index funds go mainstream.
Investors realize that most active funds underperform the market — and they vote with their money for Vanguard.
🧰 Expanding the Product Line:
Vanguard introduces:
- Retirement funds
- Bond funds
- International and balanced funds
- Admiral Shares — low-cost funds for loyal investors
📢 Open Fight with the Industry:
Bogle continues to harshly criticize Wall Street:
- For greed, manipulation, and lack of transparency
- For prioritizing company profit over client interest
"The industry hates Vanguard because it proves you can be honest and still succeed."
⚠️ Internal Challenges:
In the late 1990s, Bogle’s health declines.
He passes leadership to Jack Brennan but retains influence on company strategy.
📊 Midpoint Summary (Chapters 6–8)
📅 Phase 📈 Essence
1976–1981 Quiet survival: building the model, fighting for trust
1982–1991 Slow growth: philosophy attracts investors
1991–1999 Recognition and leadership: indexing becomes dominant
💬 Bogle Quotes from These Chapters:
"Investing is not a business. It’s a service. Those who forget this lose everything."
"Every dollar spent on fees is a dollar lost to your future."
"Volatility is not the enemy. The real enemy is you, if you panic."
📘 Chapter 9: Leadership as a Calling
💡 A Leader ≠ A Manager:
Bogle contrasts a true leader with just an efficient executive.
A real leader:
- Puts others’ interests above their own
- Has a moral compass, not just KPIs
- Makes hard, unpopular decisions
🛤 His Leadership Style:
"Don’t ask others to do what you wouldn’t do yourself."
"Always explain why — people follow meaning, not orders."
He genuinely believes Vanguard should be more than a successful business — it should be a force for good in the market.
"Leadership is loyalty to an idea bigger than yourself."
🔄 Feedback Principle:
Bogle constantly interacts with clients, employees, and journalists.
He never isolates himself in an “ivory tower” — he believes this openness is a leader’s true strength.
📘 Chapter 10: Client Service — Vanguard’s Mission
🧭 The Mission:
"Maximize investor returns — not company profits."
Vanguard is built around fiduciary responsibility: every decision must pass the test — is this in the investor’s best interest or not?
🧾 How It’s Implemented:
- Fees below market average → investors keep more
- No ads for “hot” funds → Vanguard sells stability, not trends
- No sales commissions → no one profits off pushing funds to clients
- Ethical code — “Don’t do anything you wouldn’t want on the front page of the newspaper.”
"We’re not trying to be the best for Wall Street. We’re trying to be the best for you."
📘 Chapter 11: The Market Should Serve Society
📉 Critique of Modern Wall Street:
Bogle argues that finance has drifted from its original purpose.
Investing has turned into trading.
The investor became a cash cow, not a partner.
"The market now serves itself — and we’re still paying the price."
🌱 What the System Should Look Like:
- Companies should serve society
- Investors should be owners, not speculators
- Funds should be transparent, accountable, and honest
📢 Call for Reform:
Bogle calls for a rethinking of finance:
- Restore the human element
- Make mission more important than profit
- Protect long-term interests of millions of ordinary investors
"If we want capitalism with a human face, we must return finance to serving society."
📊 Summary of Chapters 9–11: Bogle's Philosophy
📌 Direction------------💬 Essence
Leadership-------------Morality, leading by example, purpose-driven
Business---------------First and foremost — service to the client
Financial System-------Must work for society, not just for profit of the few
✨ Inspirational Quotes:
"The most important thing you can invest is not money — it’s your conscience."
"Honesty in business is not a competitive edge. It’s a duty."
"I’m not against capitalism. I’m against capitalism without morals."
📘 Chapter 12: The Future of Investing — Where the Industry Is Headed
🌐 Bogle sees three main trends:
Victory of Passive Investing:
- Index funds continue to displace active management
- Their share of assets under management is growing rapidly
- More investors are realizing the power of simplicity
Fee Pressure:
- Fees are approaching zero (some funds are effectively free)
- Winners: investors. Losers: traditional management companies
The Role of Technology:
- Rise of robo-advisors (automated investment advisors)
- But Bogle warns: Technology without philosophy is just a tool, not a solution
🚨 Threat #1 — Hyperfinancialization:
"The market is turning into a casino. And the fewer the players, the more the house wins."
Bogle reminds us: the goal of investing is owning businesses — not gambling.
The higher the turnover, the more you lose on fees and taxes.
📘 Chapter 13: The Power of Indexing — Threat or Blessing?
📈 Strength in Scale:
The biggest index providers (Vanguard, BlackRock, State Street) own large shares in nearly all companies in the indexes.
This raises the issue of concentrated power — is too much influence in too few hands?
⚖️ The Indexing Paradox:
Index funds don’t actively vote on corporate governance issues.
So the more power they hold, the less oversight there is over company management.
📣 Bogle’s Proposals:
- Establish a code of conduct for index providers
- Require them to vote in investors’ interests
- Mandate transparency in how they use their voting power
"We fought for the democratization of investing. We cannot let it end in a new monarchy."
📘 Chapter 14: Personal Reflections — On Life, Mission, and Faith
🧬 Personal and Eternal:
Bogle shares his core life principles:
- To serve, not to own
- To leave a mark, not accumulate
- To do what’s right, not what’s profitable
He talks about his battle with heart disease — both as a personal journey and a metaphor for resisting the system.
🙏 Gratitude:
He dedicates the book to his family, colleagues, and investors.
Emphasizes: every day is a chance to be useful.
"I created Vanguard, but Vanguard created me. My career isn’t a triumph — it’s a thank you to fate for the chance to be heard."
📊 Summary of Chapters 12–14: Looking Ahead and Within
📌 Theme-----------------💬 Essence
Future of Investing---------Indexing is the new standard, but needs responsible stewardship
Concentration of Power----Index giants must be accountable to society
Personal Legacy-----------Life is about service, honesty, and setting an example
💬 Final Inspirational Quotes:
"Life isn’t about making more money. It’s about doing more good."
"One day, someone will say: ‘Bogle was stubborn. He never compromised his conscience.’ That will be the best reward."
🧩 Bogle’s Principle Summary (from the book):
- Lower costs — pay less = keep more
- Don’t chase returns — be realistic
- Be a long-term investor — ignore market noise
- Invest broadly, passively, regularly
- Don’t try to beat the market — own the market
- Focus on goals, not trends
- Finance = service. Not a business for profit
💡 Investment Philosophy
🟨 “This is a business where you get what you don’t pay for.”
🟨 “Don’t try to beat the market. Just own it.”
🟨 “In the stock market, investors are rewarded for patience and punished for frenzy.”
🟨 “Gross return minus costs = market return. After costs — less. So: reduce costs — and you win.”
🟨 “The problem isn’t that investors know too little. The problem is they know too much of what doesn’t matter.”
🧭 Principles & Morality
🟩 “Investing is not a business. It’s a service.”
🟩 “Honesty isn’t a strategy. It’s an obligation.”
🟩 “The goal of Vanguard isn’t to make more, but to return to the investor what’s rightfully theirs.”
🟩 “If your investments keep you up at night, change them. Or better — change yourself.”
🧠 On Leadership and Mission
🔷 “A leader isn’t the one in front. It’s the one responsible for the rest.”
🔷 “Respect isn’t bought. It’s earned when you do what’s right, even if it’s unpopular.”
🔷 “We didn’t build Vanguard for glory. We built it to leave something better than what was.”
💬 On the Market and Industry
🔴 “Today's stock market isn’t a place for investors. It’s a casino with a shiny sign.”
🔴 “We’re not against capital. We’re against capitalism without a conscience.”
🔴 “The people selling investments always say they can pick the best. But what if the best is just paying less?”
❤️ On Life and Legacy
💠 “I created Vanguard, but Vanguard created me. It’s not my victory — it’s gratitude for the chance to serve.”
💠 “Every day is a chance to do something not for yourself.”
💠 “You can measure success with money. Or with a conscience, you don’t have to justify.”
It was a lot of work!
Click to like + Write in the comments your favorite books about the financial market
Best regards, EXCAVO
_____________________
Disclosure: I am part of Trade Nation's Influencer program and receive a monthly fee for using their TradingView charts in my analysis.

$TEM - MASSIVE Opportunity for this Nancy Pelosi Darling!NASDAQ:TEM - Does History Repeat?! 🤯
Same Draw Down could lead to Same Upside!
My target is $100 🎯
Crazy High Risk/ High Reward if we repeat the same timeframe we get in less than a MONTH!!! (Wouldn't count on it, crazy if happens though)
Not Financial Advice

$OPFI ABOUT TO RUN 108%?! MASSIVE PotentialNYSE:OPFI ABOUT TO RUN 108%?!!! 🤯
Rounded Bottom with a Hammer Candle as a Cherry on Top! 🍒
My Price Targets are ATHs and $22 🎯
- Rounded bottom on daily repeating last move
- Rounded bottom on Monthly Chart with a breakout/ Retest/ now a confirmation of higher if we hold this week higher!
- About to make a Bullish Cross on the - H5_S Indicator (Still Bullish on H5_M Indicator)
- Volume Shelf Gap fill to 12 then 14
- Consistent buying volume. Sellers may be exhausted here
- Daily WCB formed giving us added insurance against the downside
Most of all MASSIVE Buying Volume today which eclipses the last 2 weeks of volume!
Not Financial Advice

Ion Beam Applications S.A. (IBAB) 1WTechnical Analysis
The chart shows a breakout of the weekly ascending trendline and the formation of a "rising wedge", indicating a potential decline.
Key Levels:
- Support: 11.46 EUR, 9.00 EUR
- Resistance: 13.06 EUR, 14.01 EUR
Fundamental Analysis
Ion Beam Applications is a leader in radiation therapy and medical accelerators.
Factors influencing the stock:
- Financials: Revenue growth but high volatility.
- Macroeconomics: Interest rate impact on the tech sector.
- Competition: Rivalry with Varian and Elekta.
A breakdown below 11.46 EUR could open the way to 9.00 EUR. To regain an uptrend, the stock needs to reclaim 13.06 EUR.

Crown Castle Inc. (CCI) 1WTechnical Analysis
- The weekly chart of Crown Castle Inc. (CCI) shows a potential reversal after a prolonged downtrend.
- A breakout above the descending trendline and consolidation above $110.85 (0.786 Fibonacci) could signal the start of an upward movement.
- Key Resistance Levels: $132.06 – $146.95 – $161.85 – $180.28 – $210.07.
- Key Support Zone: $83.83 - $90.
- CCI and RSI indicators confirm improving sentiment.
A sustained breakout above $110-112 could lead to mid-term growth.
Fundamental Analysis
Crown Castle is one of the largest telecommunications infrastructure operators in the US.
- Stable revenues due to long-term contracts with telecom providers.
- Dividend yield of ~6%, making it attractive for long-term investors.
- 5G expansion and IoT growth create long-term opportunities.
Risks: High debt burden, interest rate impact, and competition with American Tower.
CCI has growth potential if it breaks above the $110-112 zone. However, macroeconomic risks remain relevant.

$UBER is HOTT! H5 Swing Trade with 10% Upside!NYSE:UBER is looking nice. Currently in it as a swing.
Undervalued and has been a holding up really well in this correction.
Markets get going next few weeks this name will get to $100 QUICK!
PTs: $82 / $85
WCB forming
Bullish H5_S indicator is bullish Cross
Volume Shelf Launch
Bull flag breakout!
Not financial advice.

Ready to $DASH! H5 Swing TradeReady to NASDAQ:DASH 🏃💨
🎯$215📏$227⏳May2025
Falling Wedge Breakout ✅
Breakout Retest ✅
Bullish WCB ✅
Volume Shelf ✅
Bullish H5_S Indicator ✅
Not Financial Advice

Lockheed Martin 1W Possible Scenario 1WTechnical Analysis 1W
The chart shows a second breakout of the weekly trendline, which could increase downside pressure on the price.
Key Levels:
- Support: $393.08 (0.236 Fibonacci), $324.65 (0 Fibonacci)
- Resistance: $439.70 (0.382 Fibonacci), $471.48 (0.5 Fibonacci), $500.00 (0.618 Fibonacci)
Indicators signal weakness, suggesting a potential continuation of the downtrend.
Fundamental Analysis
Lockheed Martin is one of the world's largest defense contractors, specializing in aerospace, defense, and security. The company is known for producing the F-35 fighter jet, missile defense systems, and space exploration technologies.
Key Factors Affecting the Stock:
Financial Performance:
- Strong revenue growth supported by high government defense spending
- Solid backlog of contracts, ensuring future revenue stability
- However, potential budget constraints or shifting defense priorities could impact future earnings
Macroeconomic & Geopolitical Factors:
- Rising global tensions (Ukraine, Middle East, Indo-Pacific) drive higher defense budgets worldwide
- US interest rates and inflation may affect long-term government contracts
- Potential NATO expansion and Indo-Pacific security agreements could bring new contract opportunities
Competition & Industry Risks:
- Competes with Boeing, Northrop Grumman, Raytheon, and General Dynamics
- Cost overruns and supply chain disruptions could pressure profit margins
- The US government's shift to AI-driven warfare and cyber defense might change future contract allocations
Conclusion:
A breakdown below $393.08 could open the way toward $324.65, signaling a deeper correction. To regain an uptrend, the price must reclaim the $439.70 resistance level.

Nestle - Long term Bottom formation and Breakout for investmentSupport b/w 2100-2150 since Dec 24 has been holding
50 month SMA at 2106— very strong & rarely breaks
200 week SMA rarely breached & now at 2132
Moving averages: Crossed 20/50/100 day SMA
MACD: Daily +ve, Weekly +ve, Monthly -ve
Daily CCI > 100 (bullish)
Resistance Levels:
- 2280 (range)
- 2380-2400 : 2380 (100 week SMA), 2387 (parallel), 2394 (50 week SMA)—converging soon.
Break above 2280 likely coming week, but break above 2380-2400 with volume needed for long term breakout.
2100 support intact currently
At 2268-2280: Strong 2100 support. Buy on every dip for long term or on 2280 breakout.
Target - 2700 in 06 months
Long term Stop loss- below 2100
For short swing- Target 2380 if it breaks & closes above 2280, make 2270 as stop loss

$OSCR - 77% Upside if we HODOR!!NYSE:OSCR - HODOR!!!
Strong Support has been created at $12.15-$13.25 throughout the last two years.
It's held every time, if we hold again and market plays ball then...
🎯$16.50 & $23 are INBOUND!
- All indicators curling up
- At key support
- Name has a lot of big names behind it.
- Extremely undervalued
Not financial advice

S&P 500 Daily Chart Analysis For Week of March 21, 2025Technical Analysis and Outlook:
During the course of this week's trading session, the S&P 500 achieved the designated target for the Inner Index Rally at 5576, which occurred midweek. This target was accompanied by considerable volatility, ultimately hindering upward movement. On the week's final trading day, the index experienced a notable decline, resulting in a significant drop that reached our critical target, Mean Support, at 5603.
Consequently, the index is now poised to target a retest of the Inner Index Rally level 5712, with a subsequent potential target identified at the Mean Resistance level 5840. It is essential to consider that upon reaching the Inner Index Rally target of 5712, a decrease in the current price level is anticipated, which may lead to a retest of the Mean Support at 5601. Furthermore, an extended decline is possible to revisit the completed Outer Index Dip at 5520 before the resumption of an upward rally.

EUR/USD Daily Chart Analysis For Week of March 21, 2025Technical Analysis and Outlook:
As indicated in the analysis conducted last week, the Euro has initiated a downward trend following a successful retest of the Mean Resistance level at 1.093. It is currently trending downward toward the Mean Support level at 1.078, potentially declining further to the Mean Support level at 1.061. Conversely, should the anticipated downward trend not materialize, the Eurodollar will retest the Mean Resistance level at 1.087, with an additional resistance level marked at 1.095.

Bitcoin(BTC/USD) Daily Chart Analysis For Week of March 21, 2025Technical Analysis and Outlook:
This week's trading session demonstrated considerable volatility in Bitcoin's price action. The cryptocurrency made multiple attempts to attain our Interim Coin Rally 88400, yet it ultimately remained at the same level as the week commenced. The current analysis suggests that Bitcoin must reach our Mean Support of 82500 before initiating an upward progression aimed at the Interim Coin Rally of 88400 through the Mean Resistance of 87000. Furthermore, a retest of the completed Outer Coin Dip 78700 is essential before the emergence of a significant rally.

META is coming back to life!NASDAQ:META
As we discussed before a breakdown out of this Bullish Trend since 2022 would be very bearish and take META to the $400's.
Well, they said, hold my beer, and bounced hard exactly at the bottom of the channel and Anchored VWAP.
It's not over yet, as we need to follow through next week with a nice engulfing candle to make people into believers!
Not financial advice.

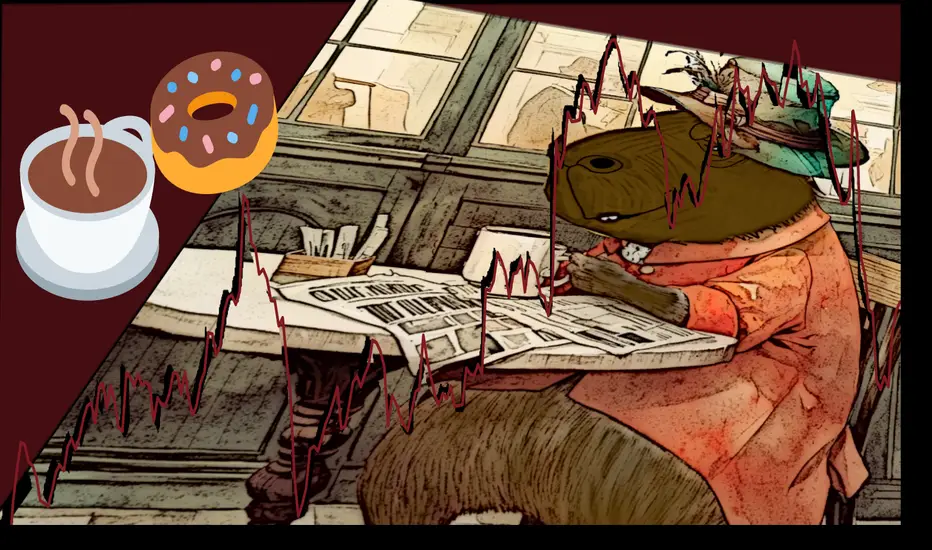
Institute of Intermediation and 24 Coffee LoversWhen the market is efficient, the most efficient strategy will yield zero financial return for the investor. Therefore, firstly, it is necessary to strive to find inefficiencies in the market itself to apply a strategy that will be effective for it.
What creates market inefficiency? First, there are delays in disseminating important information about the company, such as the approval of a contract with a major customer or an accident at a plant. If current and potential investors do not receive this information immediately, the market becomes inefficient at the time such an event occurs. In other words, objective reality is not considered by market participants. This makes the stock price obsolete.
Secondly, the market becomes inefficient during periods of high volatility. I would describe it this way: when uncertainty hits everyone, emotions become the main force influencing prices. At such times, the market value of a company can change significantly within a single day. Investors have too many different assessments of what is happening to find the necessary balance. Volatility can be triggered by the bankruptcy of a systemically important company (for example, as happened with Lehman Brothers), the outbreak of military action, or a natural disaster.
Third, there is the massive action of large players in a limited market - a "bull in a china shop" situation. A great example is the story of 2021, when the Reddit community drove up the price of GameStop shares, forcing hedge funds to cover their short positions at sky-high prices.
Fourthly, these are ineffective strategies of the market participants themselves. On August 1, 2012, American stock market trading company Knight Capital caused abnormal volatility in more than 100 stocks by sending millions of orders to the exchange over a 45-minute period. For example, Wizzard Software Corporation shares rose from $3.50 to $14.76. This behavior was caused by a bug in the code that Knight Capital used for algorithmic trading.
The combination of these and other factors creates inefficiencies that are exploited by trained traders or investors to make a profit. However, there are market participants who receive their income in any market. They are above the fray and are engaged in supporting and developing the infrastructure itself.
In mathematics, there is a concept called a “zero-sum game”. This is any game where the sum of the possible gains is equal to the sum of the losses. For example, the derivatives market is a perfect embodiment of a zero-sum game. If someone makes a profit on a futures contract, he always has a partner with a similar loss. However, if you dive deeper, you will realize that this is a negative-sum game, since in addition to profit and loss, there are commissions that you pay to the infrastructure: brokers, exchanges, regulators, etc.
To understand the value of these market participants and that you are paying them well, imagine a modern world without them. There is only a company issuing shares and investors in them.
Such a company has its own software, and you connect to it via the Internet to buy or sell shares. The company offers you a quote for buying and selling shares ( bid-ask spread ). The asking price ( ask ) will be influenced by the company's desire to offer a price that will help it not lose control over the company, consider all expected income, dividends, etc. The purchase price ( bid ) will be influenced by the company's desire to preserve the cash received in the capital market, as well as to earn money on its own shares by offering a lower price. In general, in such a situation, you will most likely get a huge difference between the purchase and sale prices - a wide bid-ask spread .
Of course, the company understands that the wider the bid-ask spread , the less interest investors have in participating in such trading. Therefore, it would be advisable to allow investors to participate in the formation of quotes. In other words, a company can open its order book to anyone who wants to participate. Under such conditions, the bid-ask spread will be narrowed by bids from a wide range of investors.
As a result, we will get a situation where each company will have its own order book and its own software to connect to it. From a portfolio investor's perspective, this would be a real nightmare. In such a world, investing in not one, but several companies would require managing multiple applications and accounts for each company at the same time. This will create a demand from investors for one app and one account to manage investments in multiple companies. Such a request will also be supported by the company issuing the shares, as it will allow it to attract investors from other companies. This is where the broker comes in.
Now everything is much better and more convenient. Investors get the opportunity to invest in multiple companies through one account and one application, and companies get investors from each other. However, the stock market will still be segmented, as not all brokers will support cooperation with individual companies, for technical or other reasons. The market will be fragmented among many brokerage companies.
The logical solution would be to create another market participant that would have contracts with each of the companies and universal software for trading their shares. The only thing is that it will be brokers, not investors, who will connect to such a system. You may have already guessed that this is an exchange.
On the one hand, the exchange registers shares of companies, on the other hand, it provides access to trading them through brokers who are its members. Of course, the modern structure of the stock market is more complex: it involves clearing, depository companies, registrars of rights to shares, etc.* The formation of such institutions and their licensing is handled by a regulator, for example, the Securities and Exchange Commission in the United States ( SEC ). As a rule, the regulator is responsible for legislative initiatives in the field of the securities market, licensing of market participants, monitoring violations in the market and supporting its efficiency, protecting investors from unfair manipulation.
*Clearing services are activities to determine, control and fulfill obligations under transactions of financial market participants. Depository services - services for the storage of securities and the recording of rights to them.
Thus, by making a transaction on the exchange, we contribute to the maintenance of this necessary infrastructure. Despite the fashion for decentralization, it is still difficult to imagine how one can ensure speed, convenience and access to a wide range of assets due to the absence of an intermediary institution. The other side of the coin of this institution is infrastructure risk. You can show phenomenal results in the market, but if your broker goes bankrupt, all your efforts will be nullified.
Therefore, before choosing an intermediary, it is useful to conduct a mental survey of the person you will be dealing with. Below you will find different types of intermediaries, which I have arranged according to their distance from the central elements of the infrastructure (exchanges, clearing houses, depositories).
Prime broker
Exchange Membership: mandatory
License: mandatory
Acceptance and accounting of your funds/shares: mandatory
Order execution: mandatory
Clearing and depository services: mandatory
Marginal services: mandatory
Remuneration: commission income from trades, clearing, depository and margin services
This category includes well-known financial houses with history and high capitalization. They are easily verified through lists of exchange members, clearing and depository companies. They provide services not only to individuals, but also to banks, funds and next-level brokers.
Broker
Exchange membership: mandatory
License: mandatory
Acceptance and accounting of your funds/shares: mandatory
Order execution: mandatory
Clearing and depository services: on the prime broker side
Margin services: on the prime broker side or own
Remuneration: commission income from trades and margin services
This category includes intermediaries with a focus on order routing. They delegate participation in depository and clearing services to a prime broker. However, such brokers can also be easily verified in the lists of exchange members.
Sub-broker
Exchange Membership: no
License: mandatory
Acceptance and accounting of your funds/shares: mandatory
Order execution: on the broker or prime broker side
Clearing and depository services: on the prime broker side
Margin services: on the broker or prime broker side
Remuneration: commission income from trades
This category includes brokers who have a brokerage license in their country, but do not have membership in foreign exchanges. To provide trading services on these exchanges, they enter into agreements with brokers or prime brokers from another country. They can be easily verified by license on the website of the regulator of the country of registration.
Introducing Broker
Exchange Membership: no
License: optional, depending on the country of regulation
Acceptance and accounting of your funds / shares: no
Order execution: on the side of the sub-broker, broker or prime broker
Clearing and depository services: on the prime broker side
Margin services: on the broker or prime broker side
Remuneration: commission income for the attracted client and/or a share of the commissions paid by them
This category includes companies that are not members of the exchange. Their activities may not require a license, since they do not accept funds from clients, but only assist in opening an account with one of the top-tier brokers. This is a less transparent level, since such an intermediary cannot be verified through the exchange and regulator’s website (unless licensing is required). Therefore, if an intermediary of this level asks you to transfer some money to his account, most likely you are dealing with a fraudster.
All four categories of participants are typical for the stock market. Its advantage over the over-the-counter market is that you can always check the financial instrument on the exchange website, as well as those who provide services for its trading (membership - on the exchange website, license - on the regulator's website).
Pay attention to the country of origin of the broker's license. You will receive maximum protection in the country where you have citizenship. In case of any claims against the broker, communication with the regulator of another country may be difficult.
As for the over-the-counter market, this segment typically trades shares of small-cap companies (not listed on the exchange), complex derivatives and contracts for difference ( CFD ). This is a market where dealers rule, not brokers and exchanges. Unlike a broker, they sell you their open position, often with a lot of leverage. Therefore, trading with a dealer is a priori a more significant risk.
In conclusion, it should be noted that the institution of intermediation plays a key role in the development of the stock market. It arose as a natural need of its participants for concentration of supply and demand, greater speed and security of financial transactions. To get a feel for this, let me tell you a story.
New Amsterdam, 1640s
A warm wind from the Hudson brought the smell of salt and freshly cut wood. The damp logs of the palisade, dug into the ground along the northern boundary of the settlement, smelled of resin and new hopes. Here, on the edge of civilization, where Dutch colonists were reclaiming their homes and future fortunes from the wild forest, everything was built quickly, but with a view to lasting for centuries.
The wooden wall built around the northern border of the town was not only a defense against raids, but also a symbol. A symbol of the border between order and chaos, between the ambitions of European settlers and the freedom of these lands. Over the years, the fortification evolved into a real fortification: by 1653, Peter Stuyvesant, appointed governor of New Netherland by the West India Company, ordered the wall to be reinforced with a palisade. It was now twelve feet high, and armed sentries stood on guard towers.
But even the strongest walls do not last forever. Half a century after their construction, in 1685, a road was built along the powerful palisade. The street received a simple and logical name - Wall Street. It soon became a bustling commercial artery for the growing city. In 1699, when the English authorities had already established themselves here finally, the wall was dismantled. She disappeared, but Wall Street remained.
A century has passed
Now, at the end of the 18th century, there were no walls or guard towers on this street. Instead, a plane tree grew here - a large, spreading one, the only witness to the times when the Dutch still owned this city. Traders, dealers, and sea captains met under its shadow. Opposite the buttonwood tree stood the Tontine Coffee House, a place where not just respectable people gathered, but those who understood that money makes this world go round.
They exchanged securities right on the pavement, negotiated over a cup of steaming coffee, and discussed deals that could change someone's fate. Decisions were made quickly - a word, backed up by a handshake, was enough. It was a time when honor was worth more than gold.
But the world was changing. The volume of trades grew, and chaos demanded rules.
May 17, 1792
That spring day turned out to be decisive. Under the branches of an old buttonwood tree, 24 New York brokers gathered to start a new order. The paper they signed contained only two points: trades are made only between their own, without auctioneers, and the commission is fixed at 0.25%.
The document was short but historic. It was called the Buttonwood Agreement, after the tree under which it was signed.
Here, amid the smell of fresh coffee and ink, the New York Stock Exchange was born.
Soon, deals were being concluded under the new rules. The first papers to be traded were those of The Bank of New York , whose headquarters were just a few steps away at 1 Wall Street. Thus, under the shade of an old tree, the history of Wall Street began. A story that will one day change the whole world.
Buttonwood Agreement. A fresco by an unknown artist who adorns the walls of the New York Stock Exchange.
META to the $400s?! I hope so!!!NASDAQ:META
Is the show over or will the show go on?
At the bottom of the Bullish Channel that started in October 2022.
A breakdown of this channel could lead NASDAQ:META back to a stock price in the 400's...
A Breakdown retest of the lower Anchored VWAP band could be a false breakdown and bounce area as well. If we break through that though then this name is going to the $400's area.
Not financial advice

China Trade Setup with 67% Upside!NASDAQ:JD - H5_W Trade Setup: 🚨
CupnHandle Breakout =
🎯$62
📏MM: $76
- Multi Year CupnHandle
- Green H5_W
- Volume Shelf with GAP
- Thriving WCB
- China is HOT!
Not financial advice
Amazon is the FULL PACKAGE! 62% UpsideNASDAQ:AMZN - H5_W Trade Setup: 🚨
Confirmed CupnHandle Retest =
🎯$262 🎯$280
📏MM: $310
- Multi-Year CupnHandle
- Massive weekly volume shelf
- Green Support Beam on Wr%
- Undervalued MOAT Company
Not financial advice
