XRP could to formed a big symmetric triangleI make this analysis explain a one thing that I see in the price for this cryptocurrency. As XRP it's in the bear market, we are forming a big symmetric triangle in monthly chart, and maybe it's an interesting data that I take in note. a good way to start and accumulate XRP assets by long term.
XRP it's one of my favorite cryptocurrency, and I love this crypto much!!! We can to buy in $0.24 cents if this happen in the next weeks.
Investingopportunity

XAU/USD LONGTERM FORCAST Gold has been on a bearish dump since its high 2070 which was recorded on 7th of march 2022. The commodity pair has since then maintained a steady dump, analysis shows that XAU is not just in a dump but in a descending channel which had been tested with two touches, the commodity pair seem to be absolutely obedient to the channel and had dropped at every touch of the upper descending trend line.
What is the current forecast for Gold.....?
Currently the dollar is very bullish and due to its correlation with the commodity XAU is bearish. Although there's no sign of reversal, a rally above 1670 is a signal for long.
Remember trading is a waiting game don't chase a trade or you'd be catching a falling knife.
Follow Saffroninvest for more updates.

DKNG Demand Zone + StrengthCompany : DraftKings has been showing Extreme Relative Strength after a nearly 100% move from its June Low to Recent Bear Market Highs.
This Relative Strength is not from nowhere and definitely, can be attached to DraftKings leadership in the Sports Betting & Gambling industry. DraftKings has opened up huge money-generating partnerships with NFL, and other large organizations. These agreements and contracts only have pushed DraftKings Higher.
While the Market has continued to drift lower these past weeks, DraftKings has been taking a necessary hit from its large run-up. DKNG is entering a Major Demand Zone Dating back to the IPO days. Technicals are showing a very large demand zone from the near $15 level towards the $10 level. With this heavy support area, we may see heavy consolidation for a time being, and a Strong appearance of Buyers.
This is a strong thing to note out, as this could be a strong Long-Term Aquiring location for many Investors to pick up in this Bear-Market.

$GBP - How low can we go?$GBP - How low can we go?
Tacking back to yrs of data, perhaps we go ahead to George Soros area of chart and going back to 84-87 areas of price action. Interesting times, I think 1.10 could be achievable as we are in recession, fundamentally very weak outlook for gbp and you got dollar king rising further as hikes remain on the table till end of yr for US.
Interesting times, for longer term this brings great opportunities of investing.
TJ

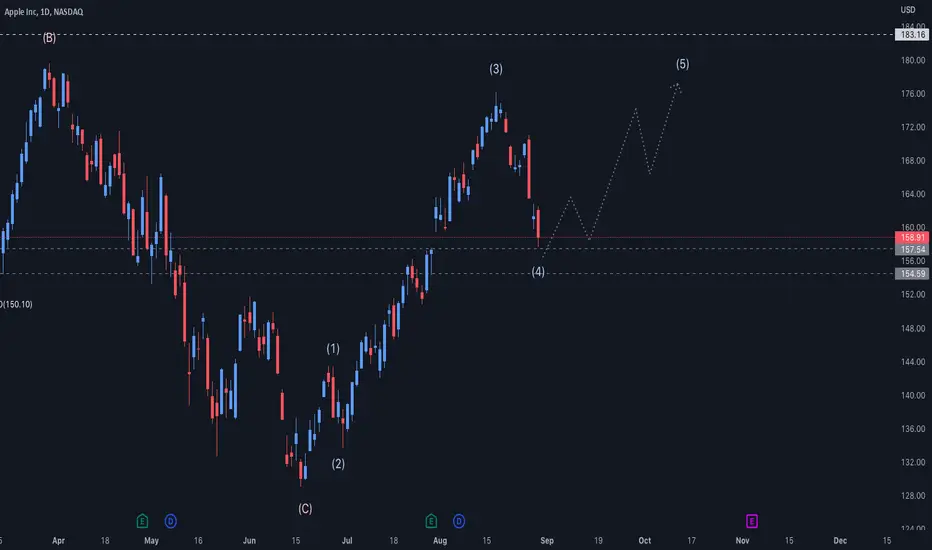
Apple up for the next 2 weeks
Raise your hand if you want to know what's AAPL gonna do next.
I see an impulsive structure (12345) currently being in wave 4. Fallowed by the final wave of the sequence, wave 5.
So I would see AAPL going back to the $175 level unless it truncates. Truncation is of corse a possibility but it usually rare.
After 5 waves we are always expecting a correction.
If you want more analysis like this please let me know.
This is my opinion and does not constitute financial advice.
GBPJPY Technical Chart AnalysisA new incredible opportunity is now being watched with previous opportunities as well.
At least 350 pips drop on reversal
Don't miss the Incredible opportunities.

SBIN - DAILY TIME FRAMEThe Structure looks good to us, waiting for the this to correct and then give us these opportunities as shown on this instrument (chart).
Note: its my view only and its for educational purpose only. only who has got knowledge in this strategy will understand what to be done on this setup. its purely based on my technical analysis only (strategies). we don't focus on the short term moves, we look for only for Bullish or Bearish Impulsive moves on the setups after a good price action is formed as per the strategy. we never get into corrective moves. because it will test our patience and also it will be a bullish or a bearish trap.
we do not get into bullish or bearish traps. we anticipate and get into only big bullish or bearish moves (Impulsive moves).
Just ride the bullish or bearish impulsive move.
buy low and sell high concept. buy at cheaper price and sell at expensive price.
Keep it simple, keep it Unique.
please keep your comments useful & respectful.
Thanks for your support....

$MMM Longterm Investing OpportunityIs 3M currently a good Stock for a Dividendportfolio? NYSE:MMM
$MMM is coming closer to a level where it's getting interesting for buy opportunities. The overall structure is still bullish on the monthly as well as on the weekly. The orderflow on the weekly is currently corrective as price is inside a very clean pullback (PB)
The stock has been consolidating for the last weeks, which is a good sign because it is building liquidity on the bottom side, which we expect to get taken out before continuing to the upside.
So from the technical side, we can start ticking the boxes if price sweeps the Liquidity that it is currently building up.
From a fundamental perspective, 3M is getting closer to the fair value price, which is an additional confluence for me to open up long-term positions. It will be a good fit for my Dividendportfolio.
I'll make an update if the stock makes significant changes in pricing.

BTCUSD (BITCOIN)“Easy money” is having hard times as there still is no sign of reversal in favor of Bitcoin, but 20k seems to be acting as a psychological barrier in selling.
Market Structure:
After collapse in #btc price 3JULY price hits low of 18763$ now we see some buyer strength and they push price towards 15june high 22662$. here we see bullish pannet structure in the market which shows bulls profit booking here at 21681$.
NEXT MOVE
Here you can see green trendline resistance after breakout of resistance and and also POC volume profile. Volume is also high at current price. Breakout helps bulls to push price towards the TARGETS OF 22114$, 22604 & 25K Psycological level.
STOPLOSS :21200$
FUNDAMENTALS
Taking advantage of low prices, investors are increasing their Bitcoin holdings. According to data by crypto intelligence firm Glassnode, both Bitcoin shrimps (those who own less than one BTC) and Bitcoin whales (those who own more than 1,000 BTC) are stacking more BTC.

summer rally or no summer rally? $ASMLwell
$ASML is something that I bought at the beginning of this week.
the 43 correction from the top encouraged me to do so.
we don't care if the correction will go lower, because we are thinking in terms of decades

Moon Landing Paused.... Recovering after a long week of getting hammered and just living life to the fullest has been the story of BTC. The weather is major bearish with a chance of alt showers or bitcoin storms... bottom might be here very soon but the recovery to a full summer with nothing but blue skies and sunshine may be some time away. Enjoying the current moment you are in by not letting emotions get to you as well as understanding what you are investing in will allow more conviction in your investing strategy without getting thrown off course. Good luck. I like to Dollar Cost Average. Much love to everyone!

What wil General Motors do?I share TWO of my IDEAS!
1. First Option (1 YEAR)
Is done by looking at the Financial Health, Historical DATA and
calculating its Fair Value Today
2. Second Option is a Longterm Investment. That depends on the Market and Growth of GM
Disclaimer;
NO ADVICE TO INVEST and TRADE SAFE!

Google Forecast. What do you think?I share TWO of my IDEAS!
1. First Option (1 YEAR)
Is done by looking at the Financial Health, Historical DATA and
calculating its Fair Value Today
2. Second Option is a Longterm Investment. That depends on the Market and Growth of Google
Disclaimer;
NO ADVICE TO INVEST and TRADE SAFE!

VIKASLIFE: TARGET 200%HELLO TRADERS!
Vikaslife is trading above 50ma, 20ma and 6ma as well ,so is considered bullish. Volume is also supporting the trend and therefore may give good momentum. It has the potential to become a multibagger.
1st target is almost 200%.
SL should be kept below 6.
Entry can be taken @CMP.
For details refer to the chart.
THANK YOU!

HINDOIL EXP (209) Can be a Good bet for Med-Long termHINDOIL EXP (209) chart looks strong - this could be a Good bet for Med-Long term as it's heading to 400++ levels
Do your own research before investing.

Rolex Rings Limited - Breakout with highest ever volume.Rolex Rings Limited - Breakout with highest ever volume in the script. Investment Opportunity - Conservative investors can wait for pull back.

HDFC - Monthly Chart - Investing Opportunity HDFC - Monthly Chart - Long Term Investing Opportunity. Can keep on adding small quantities.

ITC Breakout; long term investment opportunity ITC Breakout; long term investment opportunity. Levels as mentioned on the chart.

LUNA POTENTIAL LONG TERM PLAYLuna is looking grey, We could see a retest of $40-55 and small drive up which will attract a lot of retail traders to jump in, only leading to fill sell limit orders by institutions. This would then provide liquidity to drop all the way down to $19-5. These levels could be considered to DCA for long term hold. DO NOT BUY AT CURRENT LEVELS. Its all manipulation at the moment. Wait for better price by practicing patience.

Tesla going to $608 region
@ElonMusk do you want the bad news first ?
I see a complex correction W-X-Y and the bad news is that waves X and Y will reach equality at about $608.
The good news is that you might still take TWRT

VOO VANGUARD S&P500 ETF- IS IT GOOD FOR A LONG TERM HOLD? VOO AMEX:VOO is showing promise. Markets have very slowly begun to correct since the Russian Invasion into Ukraine Feb 24th, 2022. Since then, you see some recover on this chart. While things are still uncertain with the overall health of the economy and markets the S&P is gaining some slow momentum. However is VOO a good long term hold ? Well, I'm gonna be opening a position with VOO for my portfolio and increase with dollar cost average new positions to protect me from any volatility.
Hope you enjoy this TA and don't forget to like and subscribe and show your support.
Disclaimer
I’m not a certified financial planner/advisor, a certified financial analyst, an economist, a CPA, an accountant, or a lawyer. I’m not a finance professional through formal education. The contents on this TA,(Technical Analysis) are for informational and educational purposes only and do not constitute financial, investment, trading, accounting, or legal advice. I can’t promise that the information shared on my posts is appropriate for you or anyone else. By using or reading this technical analysis or site, you agree to hold me harmless from any ramifications, financial or otherwise, that occur to you as a result of acting on information found on this analysis, or post. AMEX:VOO

$Nas100 Nasdaq weekly timeframe Technical indicators still bearish on the weekly but bullish on intraday timeframes.
⚠️ - This idea is based on my technical analysis only. Do your research and trade on your own risk!

Gold Making Its Bearish TrendGold making its bearish trend now its point is 1970.05. Our first target is 1921.00 after this its makes an upward trend to 1938.00-1949.20 than its starts again follow the bearish trend till 1872.30. Best entry point is 1979.00 and after that 2025.80 Must Give your Feedback Thanks .
