Investors Vie - Can BLMZ hit $35million market cap? BloomZ (NASDAQ: BLMZ) for sure is going to hit the $35 million market cap that Nasdaq requires, thanks to their exciting developments and a solid plan for growth.
BloomZ has been working hard on a bunch of new projects that are expected to bring in more revenue and boost the company’s value. With new products on the horizon and expansion into fresh markets, things are looking good. Many investors are already paying close attention, expecting BloomZ to be one of the next big success stories.
With so much potential ahead, BloomZ is set to reach the $35 million market cap and keep moving forward, making it a company to watch for investors looking for growth opportunities.
Investment

Amazon (AMZN): Swing Trade & Chart Analysis UpdateTwo months ago, we anticipated a pullback to wave (2), and after a brief pump, we saw an immediate sell-off. The fascinating part? Amazon dropped 25% and reversed almost perfectly on the long-held trendline, which hasn’t been adjusted. It's incredible how simple technicals can sometimes work so well.
We've now pushed back into the $183-190 range. This could be a relief pump, likely short-lived. While we aren’t ruling out a rise above the current wave (1), we’re leaning toward a flat correction, as wave A was fast. If correct, we should turn soon and continue downward with a 5-wave structure into the 50-78.6% Fibonacci retracement target area.
No limit orders yet, but we're setting alerts to better time our entry. 🔥

$TIA Breakout: Ready for a Bullish Rally!LSE:TIA USDT: Long Position 🚀
TIA is breaking out from a falling wedge pattern, which is a bullish reversal setup. The price has recently breached the upper trendline resistance, signalling a potential strong upward move. If the breakout holds, there is significant upside potential as marked in the chart.
Entry Point: Current Market Price (CMP) around $5.20
Additional Positions: Consider adding more if the price retests the trendline support near $4.80–$5.00.
🎯 Targets:
$6.20
$7.80
$8.50
$9.80
$12.5(Final Target)
⛔️ Stop Loss (SL): $4.60 to manage downside risk.
⚖️ Leverage: Use leverage cautiously, between 3x and 5x depending on your risk tolerance.
#Crypto

NASDAQ: AZ | Entering into New Collection Phase A2Z Cust2Mate Solutions Corp. (NASDAQ: AZ) is seeing a breakout from its flag pattern last week. This shows a positive trend of stronger buying momentum as indicated by share price above the key EMA20 line, together with strong buying interests (as indicated by the red bars below) for AZ. For the coming week, we expect AZ to continue to challenge its key resistance of $0.80 AND $1.00, giving a Risk-to-Reward (RR) of 2.3 times based on a stop loss level below the key EMA20 line.

Japan's Anime Market–A Growing Investment Opportunity with MajorThe Japanese anime industry is increasingly catching the attention of investors worldwide. In 2023, the Japan anime market was valued at USD 12.72 billion and is projected to grow at a compound annual growth rate (CAGR) of 3.9% from 2024 to 2030. This steady rise is driven by global demand, digital distribution advances, and the flourishing otaku culture, which remains the backbone of anime’s sustained popularity.
Major Conglomerates Eyeing the Anime Industry
Adding momentum to this booming sector, two of Japan's largest industrial and financial players have quietly started investing in anime. Marubeni Corporation, traditionally rooted in cereals and chemicals, has diversified and is now targeting the manga and anime markets through a new partnership with Shogakukan, one of Japan's leading publishers. This venture highlights how even non-entertainment giants are recognizing the financial potential within anime.
At the same time, Mizuho Securities, a key member of Japan's Mizuho keiretsu (business alliance), launched an anime film fund in 2024. The brokerage is raising funds from institutions and high-net-worth individuals in lots starting at JPY 300 million (approximately $200,000), with a target of raising $15 million by the year’s end. This direct investment into anime production from a major financial institution underlines the sector’s robust growth prospects.
Global Influence and Strategic Acquisitions
The global appeal of anime is another major contributor to its growth. International entertainment companies have been aggressively acquiring Japanese anime streaming firms to expand their content portfolios. A prime example is Sony Pictures Entertainment’s acquisition of Crunchyroll LLC from AT&T in August 2021 through Funimation Global Group, a joint venture with Aniplex Inc.. This deal brought Crunchyroll's content to more than 120 million registered users across 200 territories, solidifying Japan’s role as the hub of global anime content.
BloomZ Inc. Enters the Anime Scene?
Amidst this backdrop, BloomZ Inc. (Nasdaq: BLMZ), a well-known name in the voiceover industry for animation, recently made its mark by going public through an IPO in July 2024. While BloomZ has built a strong reputation in providing voiceover services for some of the top anime titles, rumours are circulating that the company may be planning to expand into the anime production business itself. If true, this could be a significant development for BloomZ, adding another layer of growth potential to their portfolio as they branch into full-scale animation production.
Manga and Video Game Adaptations: Cross-Media Synergy
Japanese manga, often serving as the foundation for anime adaptations, is another critical component of the market. Major titles such as Demon Slayer, One Piece, and Attack on Titan have successfully transitioned from manga to anime and video game formats, creating a cross-media ecosystem that amplifies fan engagement. The success of these adaptations not only fuels viewership but also boosts related industries such as video gaming and merchandise, further solidifying anime’s role in Japan’s economy.
Why Investors Should Consider Anime
The Japan anime market offers diverse revenue streams, ranging from streaming services and live-action adaptations to manga and video game adaptations. With the entry of major conglomerates like Marubeni and Mizuho Securities, and companies like BloomZ Inc. potentially venturing into anime production, the sector is poised for significant growth.
As Japan’s anime industry continues to expand its global footprint and attract heavyweight investors, it offers a compelling investment opportunity for those looking to tap into a high-growth entertainment sector. For investors, now may be the ideal time to explore opportunities in this dynamic market.
Disclaimer:
This article is intended for informational purposes only and should not be construed as financial advice. Investors are encouraged to conduct their own research and consult with a financial advisor before making any investment decisions. The author and publisher are not responsible for any financial losses or damages resulting from the use of this information.

Benzinga: Why Is Agape ATP Stock Jumping Today?Zinger Key Points
Agape ATP’s stock jumps after partnering with Xiamen Photons Solar to develop solar PV systems in ASEAN countries.
The strategic collaboration aims to address grid stability and power supply issues while advancing Sabah's transition to clean energy.
Agape ATP Corporation ATPC shares are trading higher after the company announced it entered into a strategic collaboration with Xiamen Photons Solar Technology, focusing on developing solar photovoltaic mounting systems for Malaysia and ASEAN countries.
The company’s subsidiary, ATPC Green Energy, has formed a strategic collaboration with Xiamen Photons Solar Technology, a value chain partner of Fujian Minfa Aluminium Co., which is listed on the Shenzhen Stock Exchange.
The agreement was signed at Photons Solar’s headquarters in Xiamen, China.
This partnership is timely as ASEAN nations enhance their commitment to a zero-carbon energy future. Regional governments are actively implementing policies to promote renewable energy development and carbon neutrality.
The collaboration between Photons Solar and ATPC Green Energy aims to accelerate these initiatives and drive the transformation of the ASEAN solar market.
How Kok Choong, founder and global group CEO of ATPC, indicated that the collaboration with Photons Solar represents a significant advancement in their efforts to develop solar PV farms in Sabah.
The partnership is expected to tackle key challenges like grid stability and power supply issues, supporting Sabah’s transition to clean and reliable energy.
“This partnership allows us to leverage local insights and advanced technologies, further supporting our commitment to advancing renewable energy goals across the region,” the CEO added.

ATPC Partners with Photons Solar to Advance Solar PV SystemJoint Initiative to Boost Renewable Energy Adoption and Support Carbon Neutrality in the Region
KUALA LUMPUR, 13SEPTEMBER 2024 – NASDAQ-listed AGAPE ATP Corporation ("ATPC"), through its subsidiary, ATPC Green Energy Sdn. Bhd. (“ATPC Green Energy”) has entered into a strategic collaboration with Xiamen Photons Solar Technology Co., Ltd (“Photons Solar”), a value chain partner of a Shenzhen Stock Exchange-listed Fujian Minfa Aluminium Co., Ltd (“Fujian Minfa Aluminium”). This collaboration focuses on developing solar photovoltaic (PV) mounting systems for Malaysia and ASEAN countries. The agreement was signed at Photons Solar’s headquarters in Xiamen, China.
This partnership comes at a pivotal time as ASEAN countries intensify their efforts toward a zero-carbon energy future. Governments in the region have been implementing various policies to encourage the development and use of renewable energy, with a strong focus on achieving carbon neutrality. The collaboration between Photons Solar and ATPC Green Energy, both leaders in renewable energy innovation, is designed to accelerate these efforts and drive the transformation of the ASEAN solar market.
Prof Dato’ Sri Dr How Kok Choong, the Founder and Global Group CEO of ATPC said, “This partnership with Photons Solar is a strategic step forward for us as we continue to develop solar PV farms in Sabah. Our collaboration aims to address critical issues such as grid stability and power supply challenges, ultimately supporting Sabah’s shift to a clean, affordable, and reliable energy source. By aligning our efforts with a partner that shares our vision, we are well-positioned to make a significant impact on the renewable energy landscape in the region.”
“We believe that sharing technological expertise is the key to driving innovation and fostering collaboration. By working with Photons Solar, we are combining our strengths to create versatile and flexible solar solutions that cater to the diverse needs of the ASEAN market. This partnership allows us to leverage local insights and advanced technologies, further supporting our commitment to advancing renewable energy goals across the region,” How added.
Photons Solar, renowned for its extensive experience in solar PV mounting systems with over 5 gigawatts (GW) in cumulative shipments and a 960,000 square meter manufacturing facility owned by Fujian Minfa Aluminium, brings a wealth of knowledge and advanced technology to this collaboration. The company is committed to providing high-quality, efficient, and customized solar mounting solutions that cater to various customer requirements.
Mr. Paul Cao, Chief Executive Officer at Photons Solar, said, "We are pleased to partner with ATPC Green Energy, given their solid presence and experience in the ASEAN region. Collaborating with a company that understands the local market dynamics allows us to work more effectively towards our shared goals in promoting renewable energy. We look forward to this journey together.”
The projects under this collaboration will leverage Photons Solar’s state-of-the-art solar mounting systems while drawing on ATPC Green Energy’s service-oriented approach. By integrating their expertise in project management, technological innovation, product quality, and service excellence, both companies are poised to deliver efficient, reliable, and environmentally sustainable solar projects that align with the region’s energy needs.

NASDAQ: AZ | Revolutionizing the $26.7 Billion Self-Service MarkTired of long checkout lines? AZ Cust2Mate (NASDAQ: AZ) might be worth adding to your watchlist. Specializing in smart cart technology, AZ's flagship product offers in-cart weighing for produce, navigation features, seamless checkout, and advanced security to prevent theft.
Imagine shopping with AZ’s smart cart, scanning items as you go—no more waiting in lines. Already partnered with Yochananof and Carrefour, AZ is making strides in the US market, projected to reach $26.7 billion by 2028.
AZ operates on a SaaS model, earning from setup fees, monthly subscriptions, and additional services like data insights. With 5,000+ carts deployed, they’re poised for growth. Despite recent stock volatility, AZ’s strong fundamentals make it an intriguing investment opportunity.

Mahindra & Mahindra updateAs expected maket reached at extreme ob and moved 107 points 4% up trend hope in future we can expect a more on this investment 😉
Happy trading 🥰

NASDAQ: BLMZ | Share Price Skyrockets by a Massive 245% After AnI’ve been watching BloomZ Inc. (NASDAQ: BLMZ) closely, and to say it had a wild ride is an understatement! Yesterday, the stock closed at $0.808, but just a few days ago on Friday, it shot up to $2.790, which is a massive 245% gain!
So, what’s behind this explosive move?
It turns out that on September 5, 2024, BLMZ announced a strategic business alliance with CrossVision Inc., a Japanese digital entertainment company that specialises in Web 3.0 technology.
This partnership is creating a lot of excitement in the market.
Together, BloomZ and CrossVision plan to be the game changer for the entertainment space by merging BloomZ’s expertise in animation and VTuber management with CrossVision’s cutting-edge Web 3.0 and blockchain technologies.
The goal is to enhance fan engagement, enabling users to participate in live events within the metaverse, own and trade digital items, and interact with their favourite animation projects and VTubers.
This collaboration could reshape how fans experience digital entertainment.
Imagine being able to not only enjoy content but actively participate in it through blockchain technology. Fans will be able to own digital assets that represent their contribution to the content and connect with virtual communities in real time. The potential of tokenization is huge!
As an investor of BLMZ, I’m excited by the potential of this partnership. The spike in the share price is clearly driven by the market’s enthusiasm for this new direction. BloomZ is tapping into the future of entertainment, and the potential growth from this alliance is huge.
For now, I’m holding onto my shares and watching closely. BLMZ has positioned itself in two booming industries—Web 3.0 entertainment and self-checkout technology—making it a stock with serious upside potential.

NASDAQ: AZ | Tap Dancing into the $26.7 billion Self-Service MarHate queuing to checkout in supermarkets or hypermarkets?
A2Z Cust2Mate Solutions Corp (NASDAQ: AZ) might be the company you need to add to your watchlist. AZ is a leading global provider of innovative technology solutions, specialising in smart cart platforms – and this is not just any ordinary smart cart.
Let me explain.
AZ’s flagship smart cart product is set to revolutionise the retail self-checkout market. It features in-cart weighing capabilities, making it especially convenient for checking out produce like fruits and vegetables.
Additionally, the smart cart offers navigation features and seamless checkout functionality, all while incorporating robust security measures to prevent theft – a critical concern for retailers.
In simpler terms, imagine walking into a supermarket with one of AZ’s smart carts, doing your shopping, and checking out as you go.
No more queues.
Currently, AZ provides its solutions to Yochananof, Israel’s fourth-largest retail chain, and Carrefour, the largest retailer in France with over 3,500 stores. The company is also making significant inroads into the US market.
Why is the US market such a game-changer for AZ? Let’s take a closer look.
According to Grand View Research, the US self-checkout systems market is projected to grow at a compound annual growth rate (CAGR) of 11.3%, reaching $26.7 billion by 2028. There are even rumours that AZ is in discussions with a number of leading US retail chains, which will mark as a significant milestone for the company.
How Does AZ Generate Revenue?
AZ operates on a scalable Software-as-a-Service (SaaS) model, which allows for easy expansion while also facilitating valuable data collection for future advertising opportunities.
Here's how the revenue streams break down:
Initial Setup Fees. Retailers bear one-third of the cost, with the remaining two-thirds covered by AZ. The setup costs range between $1,000 and $2,000 per smart cart, and AZ expects a payback period of approximately six months.
Subscription Model. Retailers pay a monthly fee ranging from $100 to $200 per cart. Currently, AZ has over 5,000 smart carts deployed, creating a steady stream of recurring revenue.
Additional Services. AZ also offers services related to data and advertising, providing valuable consumer behaviour insights to product owners. This capability could be a game changer, enabling brands to obtain highly accurate data on consumer purchasing patterns.
With this scalable business model and recurring revenue, AZ is well-positioned for future growth.
However, recent volatility in the US market has put downward pressure on AZ’s stock price. Despite this, AZ's strong fundamentals and innovative business model present significant growth potential, making it a compelling investment opportunity.

Rumours Swirl About Agape ATP’s Big Move – Is ATP2 Making a ComeWord on the street is that Agape ATP Corporation (NASDAQ: ATPC) might be gearing up for a major play. According to hearsay from one of the investors, Agape Superior Living, a subsidiary of ATPC, could be bringing back its flagship product, ATP2, as soon as mid to late this month.
If the whispers are true, this could mean big things for the company.
For those who’ve been following, the ATP Zeta Health Program which includes eight health and wellness products, there is a solid track record.
The program hit a massive RM18 million in monthly sales in March 2018 and totalled RM62 million for the year. ATP2, in particular, has always been the star of the show, loved for its health benefits with strong customer loyalty.
Should this relaunch happen, it could reignite serious consumer interest. After all, wellness products are in huge demand right now. Agape Superior Living might just be timing this perfectly to ride the wave of the health trend. If they pull this off, we could see some big numbers in terms of sales, which would be a win for the company and its investors.
For those watching ATPC’s stock, this could be a golden opportunity. The company’s products have a history of doing well, and if ATP2’s relaunch sparks the same kind of sales it did before the pandemic, it could signal a new growth phase for Agape Superior Living. Investors are keeping a close eye on this, and some are saying this could be the beginning of something big.
So, while nothing official has been confirmed just yet, if you’re an investor in ATPC or thinking about jumping in, you might want to watch what happens over the next few weeks. ATP2’s potential comeback could be the catalyst for renewed growth and profitability in the health and wellness space.
Stay tuned. If the rumours are true, we could be looking at some exciting times ahead for Agape ATP Corporation.
NASDAQ:ATPC

ROSSARI BIOTECH Showing Change in Price StructureNSE:ROSSARI
....................................................................................................................
....................................................................................................................
....................................................................................................................
Update on the expansion projects at Dahej Facilities
....................................................................................................................
• In the Q2FY24 the Company had announced an expansion of its facility at Dahej by adding up
20,000 MTPA capacity for products related to HPPC in the specialty chemical space, as well as for producing ingredients for its subsidiary companies.
Also, to cater to the growing
demand in agro chemicals, home and personal care, oil & gas and the pharma sector, the
Company had further announced expansion of the Ethoxylation capacity by 30,000 MTPA at
the Dahej facility of Unitop Chemicals Private Limited.
• Work on both these projects are progressing as planned. Commissioning is expected to
happen, in a phased manner in the current year
....................................................................................................................
....................................................................................................................
....................................................................................................................
• Consistent growth trajectory over the past three years, driven by both organic and inorganic growth strategies
• While near-term investments and strategic initiatives have led to a moderation in ROCE and ROE, the balance sheet position
remains strong.
The Company is confident of reporting improved return metrics in the future as these investments start yielding
results

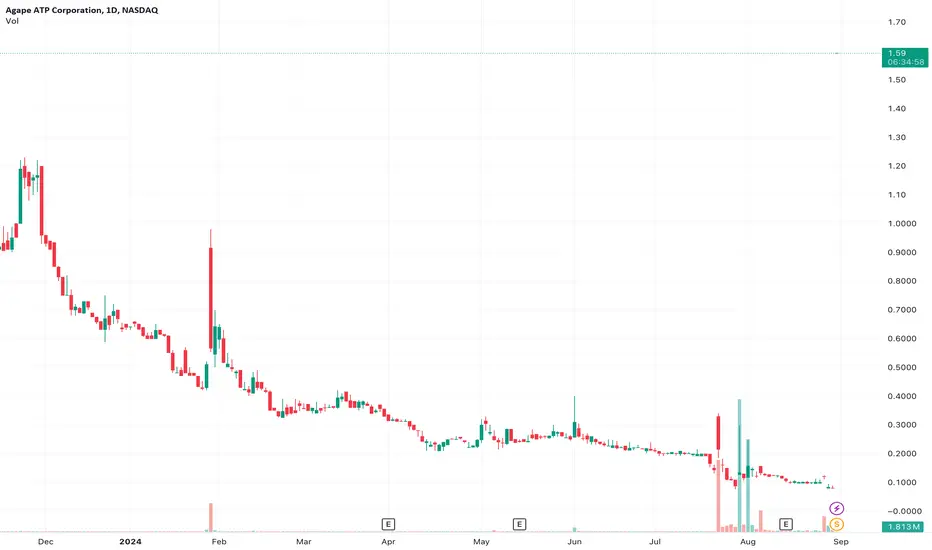
Agape ATP Corporation (NASDAQ:ATPC) Testing Key Support
After a strong rally in the past week, ATPC is now testing its key support level around $1.601 level amidst overall market weakness. However, we are still seeing an accumulation pattern around the current level due to the attractiveness of the valuation of ATPC currently, supported by their high growth renewable energy story.
We kept a HOLD recommendation on ATPC.

NOC vs LMT: A Valuation War Between Top Defence Manufacturers!ABOUT COMPANIES
Northrop Grumman NYSE:NOC excels in advanced aircraft systems, divided into four main areas: Aeronautics Systems, Defense Systems, Mission Systems, and Space Systems. Aeronautics Systems designs and manufactures cutting-edge aircraft for the U.S. military and global clients. Defense Systems integrates battle management and weaponry, while Mission Systems delivers innovative solutions for defense and intelligence. Space Systems focuses on solutions for national security and commercial purposes. Established in 1939 by John K. Northrop and others, the company is headquartered in Falls Church, VA.
Lockheed Martin NYSE:LMT stands as a top global security and aerospace company, dedicated to the research, design, and production of advanced technology systems. It operates in four primary segments: Aeronautics, Missiles and Fire Control (MFC), Rotary and Mission Systems (RMS), and Space. The Aeronautics segment focuses on military aircraft, including combat and drones. MFC specializes in air and missile defense and precision strike systems. RMS develops military and commercial helicopters and cyber solutions, while the Space segment creates satellites and defense systems. Founded in 1912, the company is located in Bethesda, MD.
MARKET CAPITALIZATION
● Northrop Grumman (NYSE: NOC) - $75.96 Billion
● Lockheed Martin (NYSE: LMT) - $135.53 Billion
TECHNICAL ASPECTS
● Northrop Grumman
➖ The monthly chart shows that the stock price is currently on a distinct upward path.
➖ Previously, it faced resistance around the $360 level, caused a notable pullback.
➖ Subsequently, the price formed a Double Bottom pattern and broke out successfully.
➖ This breakout drove the price to an all-time high near the $556 level but the price started declining from there.
➖ Nevertheless, the stock price found strong support around the $420 level, allowed it to bounce back.
➖ Currently, the stock is approaching its previous all-time high, and if it can overcome that resistance, we can anticipate further price increases in the coming days.
● Lockheed Martin
➖ This stock is on a strong upward trajectory, consistently achieving higher highs and higher lows.
➖ Following a significant breakout around the $500 mark, the stock price surged and is now trading at $568.5, just shy of its all-time peak of $578.7.
➖ From a technical perspective, the price is hovering just below the upper boundary of a parallel channel, which may act as a resistance point.
➖ However, if the price can break through this range and maintain that momentum, we could see even greater upward movement ahead.
Relative Strength
● The chart shows that the NYSE Composite TVC:NYA has provided a solid return on investment of about 18% in the last year. In comparison, Northrop Grumman and Lockheed Martin have done even better, with returns of around 20% and 27%, respectively.
REVENUE BREAKDOWN
● Northrop Grumman
The company derives its income from four main segments.
➖ The largest share comes from the space systems segment, contributing around 33%, which equates to $14.34 billion out of a total revenue of $43 billion.
➖ Next, the aeronautics systems segment adds nearly 27%, bringing in $11.61 billion of the overall revenue.
➖ The mission systems segment follows closely, accounting for about 26%, or $11.12 billion of the total.
➖ Finally, the defense systems segment generates nearly 14%, totaling $5.99 billion of the overall revenue.
● Lockheed Martin
Similar to Northrop Grumman, this company also operates through four segments to drive its revenue.
➖ The aeronautics segment leads the way, contributing around 38.4%, which amounts to nearly $28.77 billion of the total revenue of $74.85 billion.
➖ The rotary and mission systems segment accounts for 26.4% of revenue, equating to $19.76 billion.
➖ Next, the space segment contributes 17.8%, which is $13.33 billion.
➖ Finally, the missile and fire control segment makes up 17.4%, totaling $12.99 billion of the overall revenue.
REVENUE & PROFIT ANALYSIS
● Northrop Grumman
Revenue
➖ For the FY23 the revenue has jumped by 7.3% to $39.3 B from $36.6 B in FY22.
➖ In the recent June quarter there is no significant surge in revenue as the recent quarterly revenue stands at $10.2 B compared to $10.1 B in the march 2024. But from the last year June quarter the revenue has grown by almost 6% from $9.6 B.
Profit
➖ The operating profit has experienced a decline, with FY23 reporting only $2.9 billion, a drop from $6.3 billion in FY22.
➖ In the latest June quarter, the operating profit held steady at $1.3 billion, unchanged from the March quarter.
Basic EPS (LTM)
➖ The basic EPS saw a slight rise in June, climbing to $15.26 (LTM) from $14.33 (LTM) in March 2024. However, compared to the same quarter last year, there has been a significant drop from $30.23 (LTM)
Analyzing these numbers shows that although revenue has risen, the company is having difficulty producing profits, which may impact the share price in the near term.
● Lockheed Martin
Revenue
➖ In FY23, the company experienced a slight revenue increase of 2.4%, rising to $67.6 billion from $66 billion in FY22.
➖ During the recent June quarter, revenue reached $18.1 billion, up from $17.2 billion in the March quarter. Compared to the same quarter last year, this represents a significant growth of approximately 8.6%, up from $16.7 billion.
Profit
➖ The operating income has experienced a year-over-year increase. For FY23, it reached $9.0 billion, marking a 23% rise from $7.3 billion in FY22.
➖ However, there hasn't been a notable change in operating profit on a quarter-over-quarter basis. In June, the operating profit stood at $2.2 billion, slightly up from $2.1 billion in March. This figure is consistent with the operating profit reported in the same quarter last year.
Basic EPS (LTM)
➖ The basic EPS stood at $27.58 (LTM) in June 2024
➖ Over the past year, there has been no notable growth in EPS (LTM)
Lockheed Martin demonstrates a more robust financial standing compared to Northman Grumman.
VALUATION
● P/E Ratio
➖ P/E vs. Median P/E
(1) Northrop Grumman's current price-to-earnings ratio over the past twelve months stands at 33.2x, which appears elevated when compared to its four-year median of 15.2x.
(2) Lockheed Martin's recent twelve-month p/e ratio is 20.1x, also showing a rise relative to its four-year median of 16.2x.
➖ P/E vs. Industry P/E
(1) NOC shows a fair valuation with a Price-To-Earnings Ratio of 33.2x, which is just below the US Aerospace & Defense Industry average of 33.3x.
(2) On the other hand, LMT, with a P/E of 20.1x, seems to be undervalued relative to the industry average of 33.3x.
● P/B Ratio
➖ NOC's current P/B ratio of 5.3x appears inflated when stacked against the US Aerospace & Defense Industry average of 3.2x.
➖ In the case of LMT, it stands out as significantly overvalued, boasting a P/B ratio of 21.9x, which is far above the industry average of 3.2x.
FREE CASH FLOW ANALYSIS
● Northrop Grumman
➖ In FY23, cash flow from operations saw a remarkable increase, climbing to $3.9 billion, a notable rise from $2.9 billion in FY22.
➖ In the most recent quarter, this figure reached $4.4 billion, up from $3.9 billion in March.
● Lockheed Martin
➖ There was little change in operating cash flow, with FY23 reporting $7.9 billion, which is nearly the same as the $7.8 billion recorded in FY22.
➖ On a quarterly basis, there has been an uptick; for the June quarter, operating cash flow stood at $8.8 billion, an increase from $8.0 billion in March and $7.7 billion in the same quarter last year.
DEBT ANALYSIS
● NOC currently has a debt of $16.3 billion, resulting in a debt-to-equity ratio of 114%. While this may raise some concerns, the company boasts an interest coverage ratio of 5.2, indicating a solid ability to manage interest payments on its debt.
● In contrast, LMT carries a debt of $19.3 billion, leading to a debt-to-equity ratio of 311%, which suggests poor financial health. However, with an impressive interest coverage ratio of 8.9, the company is in a strong position to meet its interest obligations.
TOP SHAREHOLDERS
● Northrop Grumman
➖ State Street Global has a notable 9.59% ownership in this firm, while The Vanguard Group possesses a considerable 8.22% stake.
● Lockheed Martin
➖ In addition to the 11.2% held by Lockheed Martin's Employee Stock Ownership Plan (ESOP), State Street Global and The Vanguard Group own 15.1% and 8.99% respectively.
➖ BlackRock also maintains a significant 7.13% interest in this company.
CONCLUSION
After reviewing all the financial metrics, it becomes evident that each company possesses distinct strengths and weaknesses. It's difficult to determine which one is the superior investment choice at this moment. A look at the monthly chart indicates that both companies are currently at a high point, but they could be good candidates for accumulation during any significant downturns.
In 2023, the US spent $916 billion on defense, which was more than any other country. This was an increase of $55 billion from 2022. and this figure could increase given the current global landscape. Therefore, companies like Northrop Grumman and Lockheed Martin are expected to perform well in the foreseeable future.

Raj Rayon : {"Potential for Best investment for 2024";}
We are at the Biggest Picture available as per the data;
Price has formed a Wave 1 which is an Impulse Wave In the Upward direction;
Wave 2 is a downward 3-Wave-Simple-Correction Structure, retracing Wave 1 by less than a 100% which suffices the Laws of Wave as per the Elliott Wave Theory and now.
======================================================================
Let's talk about the most interesting part The Most Awaited Wave 3 is expected to come out, showing the move which is the reason why we trade,
According to the Elliot Wave Theory the Projection of Wave 3 is at least 161.80% of the Wave 1.
Let's see on the charts the Extension Levels as per the Best Leading Indicactor Fibonacci Extension;
Yo !!!!
Now Last Month that's in August 24, Price has closed above the EMA and hence I see a Buying Momentum in the Monthly chart,
Looking at the Promotor Holding of this company which is more than 90% only confirms my belief in the future growth of the company.
So we have an Overall Target Projection of Rs. 158.03 {Derived as per Fibonacci Extension}
Now Let's look at the other side the {downside/ stop loss/ risk against the reward}


Can 128% be soon?Cardano (ADA) is one of my favourite coins which I choose to invest in. This is trade (investment) setup on larger timeframe. If you never bought ADA before it is still not late. I am not looking to reach targets 2,3,4 very soon, that could be year(s). I will sell most of my capital on targets 2,3. Small portion will be sold on Target 1 and hopefully on Target 4.
Entry Zone: 0.50 – 0.57
Buy Zone 1: 0.30 – 0.37
Buy Zone 2: 0.13 – 0.16
Target 1: 1.33 – 1.44 (128%)
Target 2: 2.83 – 2.93 (390%)
Target 3: 4.35 – 4.89 (651%)
Target 4: 5.73 – 5.84 (891%)

Concerned about aging? Start investing in Addus now!The aging U.S. population is set to double by 2050, increasing the need for caregivers. Addus HomeCare Corporation, based in Frisco, Texas, provides essential personal care, hospice, and home health services. With a market cap of $2.35 billion, Addus reported $1.115 billion in revenue in June 2024, with a 27% profit increase. The company is debt-free and has major shareholders like Blackrock and The Vanguard Group. EPS is forecasted to grow significantly by December 2025. With a growing need for home healthcare services, the company is well-positioned to expand its customer base and market presence.
Company Overview
Addus HomeCare Corporation and its subsidiaries offer personal care services for the elderly, disabled, and those at risk of hospitalization in the U.S. It operates in three areas: Personal Care, Hospice, and Home Health. The Personal Care segment helps with daily activities like bathing, grooming, and meal preparation. The Hospice segment provides care and support for terminally ill patients and their families. The Home Health segment delivers skilled nursing and therapy services for those recovering from illness or hospitalization. Its clients include government agencies, managed care organizations, insurers, and private individuals. Founded in 1979, Addus is based in Frisco, Texas.
Investment Advice by Naranj Capital
Buy Addus Homecare Corporation
NASDAQ:ADUS
● Buy Range- 120 - 125
● Target- 150 - 160
● Potential Return- 25-30%
● Duration- 10 -12 Months
Market Capitalization - $ 2.35B
Sector - Healthcare (Nursing)
Technical Analysis
● The monthly chart indicates a clear upward trend in prices.
● Earlier, the stock peaked near the 129 (128.8 to be precise) level before experiencing a correction, which was subsequently followed by an elongated consolidation period from November 2020 to July 2024.
● Recently, the stock has successfully made a multi-year breakout of the previous resistance zone and has maintained its position above this breakout level.
● We expect this momentum to persist, leading to further price increases in the days ahead.
Entry, Exit & Stop-loss
● Entry with Capital allocation strategy
(1) consider adding 50% of your desired quantity at the current market price (132 - 133).
(2) The second buying opportunity will be in the 120 - 122 range, where you can also add rest 50% of your quantity.
● Target
Chart analysis indicates a promising upside potential of 25-30% for this stock from the best buying level, with a target around the 155 to 160. There is also a strong likelihood that the stock could exceed this target.
● Stoploss
It is crucial to implement a strict stop-loss below the 115 level, as we anticipate that the stock may encounter challenges if it drops to this point.
Revenue Breakdown
The company generates its revenue through three primary segments.
(1) The personal care sector represents around 74.2% of the overall revenue, totaling $827 million out of $1.11 billion.
(2) Meanwhile, hospice services contribute nearly 19.7%, amounting to $219.8 million of the total revenue.
(3) The home health segment accounts for approximately 6.1%, which translates to $67.8 million of the overall revenue.
Sales & Profit Analysis
● A noticeable rise in revenue has been observed. For the June quarter, revenue reached $1.115 billion, marking an 11.6% increase from $999 million in June 2023 (YoY) and a 2.5% rise from $1.08 billion in March 2024 (QoQ).
● Additionally, profits surged by 27% in the latest quarter, climbing to $68.89 million from $53.83 million in the same quarter last year, and up 5% from $65.67 million in March 2024.
● The profit margin has also improved, increasing from 5.4% to 6.2% year-on-year.
● The basic EPS for the June 2024 quarter is reported at 4.28, marking a significant increase of 27% from 3.37 in the same quarter last year.
Peer Companies
(1) Privia Health Group (NASDAQ: PRVA) - $ 2.41B NASDAQ:PRVA
(2) Amedisys (NASDAQ: AMED) - $ 3.21B NASDAQ:AMED
(3) Astrana Health (NASDAQ: ASTH) - $ 2.33B NASDAQ:ASTH
Valuation
● P/E vs Fair P/E Ratio
➖ The current PE ratio stands at 34.1x, slightly expensive to the estimated Fair PE of 28.7x.
● P/E Ratio vs Peers
➖ ADUS offers great value with a Price-To-Earnings Ratio of 34.1x, significantly lower than the peer average of 62.7x.
● P/E Ratio vs Industry P/E
➖ ADUS seems to come at a higher price, boasting a Price-To-Earnings Ratio of 34.1x, notably surpassing the US Healthcare industry average of 26.2x.
Debt Analysis
➖ ADUS stands proudly as a debt-free entity, a remarkable transformation from five years ago when its debt to equity ratio stood at 12.9%. This significant shift underscores the company's commitment to financial health and stability.
Top Shareholders
● Blackrock currently holds a substantial 16% stake in this stock, reflecting an impressive increase of 11.2% since the March quarter.
● Meanwhile, The Vanguard Group has also boosted its investment, raising its stake by 8.5% from the previous quarter, bringing their total holding to 7.74%.
Earnings per Share Growth Forecasts
Experts forecast that the earnings per share (EPS) could increase from $4.28 to $4.51 by December 2024, and further rise to $5.03 by December 2025.
Conclusion
With the growing need for home healthcare services, the company is well-positioned to broaden its customer base and enhance its market presence.

NASDAQ: ATPC Spiked 65% Pre-Market Upon Successful Reverse Stock
Agape ATP Corporation (ATPC) saw an impressive 65% spike in pre-market trading today, a clear indication of investor confidence following the company’s recent 20:1 reverse stock split. This strategic move appears to have paid off, significantly boosting the stock price and attracting renewed interest from both institutional and retail investors.
The reverse stock split, which consolidated shares to enhance market stability and meet Nasdaq listing requirements, has evidently strengthened ATPC’s market position, setting the stage for further growth in the renewable energy sector.
Investors are now eyeing ATPC as a promising player in the green energy landscape, with the recent price surge reflecting growing optimism about the company's future prospects. As the renewable energy sector continues to gain momentum, ATPC's strategic decisions, including this reverse split, are likely to play a crucial role in its long-term success.
Good time to buy and HODL!Arweave (AR) is one of my recent coins which I choose to invest in. This is trade (investment) setup on larger timeframe. I am not looking to reach targets 2,3,4 and 5 very soon, that could be year(s). I will sell most of my capital on targets 2,3. Small portion will be sold on Target 1 and on Target 4 and 5.
Entry Zone: 9.07 – 11.07
Buy Zone 1: 6.06 – 7.36
Target 1: 26.03 – 28.75 (135%)
Target 2: 38.39 – 42.25 (247%)
Target 3: 56.98 – 60.36 (432%)
Target 4: 75.92 – 78.98 (609%)
Target 5: 93.40 – 99.77 (774%)

Apple (AAPL): Swing Entry on the HorizonLast time, we narrowly missed the entry on Apple by just a few dollars, and after that miss, the stock no longer presented a compelling opportunity, so we decided to wait. However, after observing from the sidelines for a few months, it seems that another chance to secure a profitable swing entry might be approaching.
To increase our confidence in this potential opportunity and secure a better entry point, we need to closely monitor further movements from this tech giant. The current price action strongly suggests that a flat pattern might be forming following the recent drop. If this flat pattern does materialize, it could manifest as either a regular flat or an expanded flat, and this will be crucial in determining our entry target zone. At this stage, the area between $200 and $180 seems the most probable and attractive for a potential entry.
Given the broader market trends and Apple’s recent performance, this zone could offer a favorable risk-reward ratio. We’ll be watching for any developments that confirm this pattern and provide a clearer signal for entry. Stay tuned for further updates as we refine our strategy and prepare for a possible move on Apple.

SYNCOM FORMU STOCK FOR SWING TRADING8 MONTHS OF SUPPLY ZONE BREAKOUT
BUY PRICE : 19
SL : 14 (only for swing traders)
TARGET : 26 (40%)
Disclaimer - All information on this page is for educational purposes only, we are not SEBI Registered, Please consult a SEBI registered financial advisor for your financial matters before investing And taking any decision. We are not responsible for any profit/loss you made.
