Bullish Flag Pattern Reversal in ICICIPRULIICICI PRUDUNTUAL LIFE INSURANCE LTD
Key highlights: 💡⚡
📊On 1Day Time Frame Stock Showing Reversal of Bullish Flag Pattern.
📊 It can give movement upto the Reversal target of Above 598+.
📊There have chances of Breakout of Resistance level too.
📊 After Breakout of Resistance level this stock can gives strong upside rally upto above 785+.
📊 Can Go Short in this stock by placing stop loss below 472- or last swing Low.
Investment

[INTRADAY] #BANKNIFTY PE & CE Levels(07/11/2023) Today will be gap down opening in BANKNIFTY . After opening if banknifty start trading below 43450 level then possible downside rally of 400-500 points upto 43050 Level. Any Major upside only expected in case banknifty starts trading above 43550 level.

Descending Channel pattern breakout in IGLINDRAPRASTHA GAS LTD
Key highlights: 💡⚡
✅On 1Hour Time Frame Stock Showing Breakout of Descending ChannelPattern.
✅Strong Bullish Candlestick Form on this timeframe.
✅It can give movement up to the Breakout target of 392+.
✅Can Go Long in this stock by placing a stop loss below 380-.

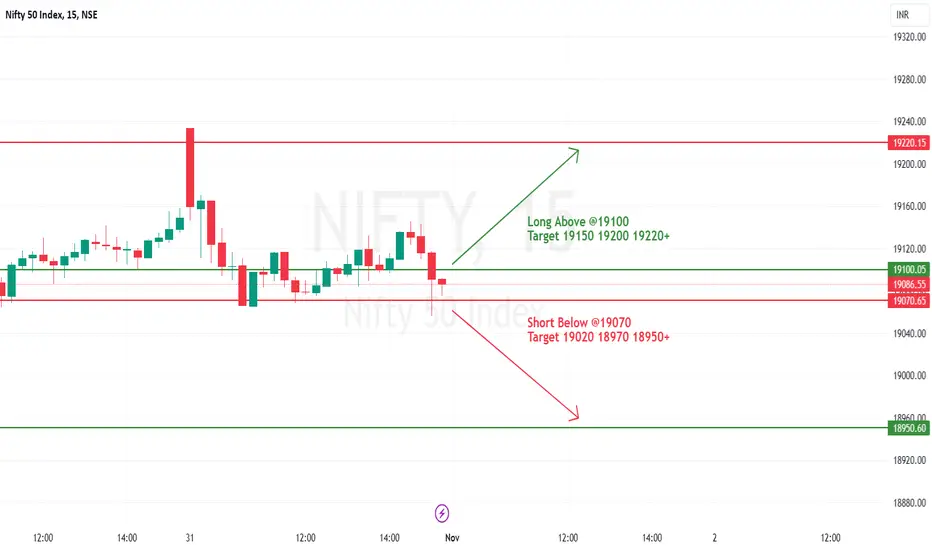
#NIFTY Intraday Support and Resistance Levels - 01/11/2023Nifty will be gap down opening in today's session. After opening nifty start trading below 19070 level and then possible downside rally up to 18950 in today's session. in case nifty trades above 19100 level then the upside target can go up to the 19220 level.
Disney #dis $dis Back in our buy zone shared months ago and back at 2014 support.
Amazing place to begin an actual investment. But also, a great place to begin looking at short- or medium-term trades as well and building position.
The gift that just keeps giving this year, lol.

Long-Term Investors Transefs to Cold Wallets 🐂 A fascinating trend has been quietly emerging in the world of cryptocurrencies that could be sending a bullish signal. Long-term investors, those who have a knack for hodling and seeing the bigger picture, are increasingly moving their assets to cold wallets rather than keeping them on hot exchanges. Let's delve into why this shift in behavior is a promising sign for the market. 📈💼
The Rise of Cold Wallets:
Cold wallets, often referred to as hardware wallets or offline storage, are known for their enhanced security features. They are not connected to the internet, making them significantly less vulnerable to hacking and other security breaches. As crypto adoption grows, the use of cold wallets is also on the rise.
A Bullish Shift in Behavior:
This transition of funds from hot wallets to cold storage is not merely about security; it's about the long-term vision that many investors hold. It suggests that a substantial portion of the market believes in the future potential of their holdings and is committed to keeping them safe for the long haul.
The Implications:
Reduced Exchange Dependence: Investors moving their assets to cold wallets indicate reduced dependence on exchanges, leading to lower risk of exchange-related issues.
Long-Term Confidence: It shows the market's confidence in the long-term value of cryptocurrencies, a critical ingredient for sustained bullish momentum.
Trading Strategy:
Stay Informed: Be aware of the evolving market trends and adapt your strategy accordingly.
Security First: Consider enhancing the security of your assets with cold storage options, especially if you have a long-term investment horizon.
Conclusion:
In the cryptocurrency world, market sentiment can be a significant driver of price movements. The growing popularity of cold wallets among long-term investors signifies a deep-seated belief in the future of the market. It's a testament to the potential of blockchain technology and its role in reshaping the financial landscape.
Keep a watchful eye on market trends, but always remember to manage your investments prudently and stay informed.
❗️Get my 3 crypto trading indicators for FREE! Link below🔑

[INTRADAY] #BANKNIFTY PE & CE Levels(23/10/2023) Today will be gap up opening in BANKNIFTY. After opening if banknifty sustain above 43550 level then possible upside rally of 400-500 points upto 43950 Level. And this rally can extend for another 400 points if it gives breakout of 44050 level. Any Major downside only expected in case banknifty starts trading below 43450 level. also possible Reversal Downside 43950 level.

Rising Wedge breakdown in POLYCABPOLYCAB INDIA LTD
Key highlights: 💡⚡
✅On 1Day Time Frame Stock Showing Breakdown of Rising Wedge Pattern .
✅ Strong bearish Candlestick Form on this timeframe.
✅It can give movement up to the Breakdown target of 4566-.
✅Can Go short in this stock by placing a stop loss above 5498+.

OPPORTUNITY TO BUY NIKE ! daily analysisDear Investors,
Nike is showing a strong buying signal after good fundamentals this year.
this could be your opportunity to invest in a low-risk high-reward trade.
you can contact me for more info on why this is a good trade & give you a strategy on how to manage this trade and close it in the best scenario possible.
you can check my old trades too to get an idea of my trading mentality.

$XLE Ready For Some ENERGY!Looking Good!
Nice ROI
Not difficult and great for your CHRISTMAS GIFTS!!!

ASIAN GRANITO INDIA | DOWN TREND BREAKOUT PATTERNDOWN TREND BREAKOUT STRATEGY
Entry Price - 80₹
SL - 30₹
Targets - 130,200,300,390+
In this channel, I share my expertise in trading strategies, technical analysis, and market trends to help you make informed decisions in your trading ventures.
Stay tuned for daily updates, in-depth market analyses, and real-time trading scenarios to witness firsthand how we transform from Zero to Hero in the trading world. My Only aim is to empower you with the knowledge and skills necessary to navigate the complexities of the financial markets successfully.
Disclaimer - All information on this page is for educational purposes only,
we are not SEBI Registered, Please consult a SEBI registered financial advisor for your financial matters before investing And taking any decision. We are not responsible for any profit/loss you made.
Request your support and engagement by liking and commenting & follow to provide encouragement
HAPPY TRADING 👍

#NIFTY Intraday Support and Resistance Levels - 16/10/2023Nifty will be FLAT opening in today's session. After opening nifty start trading above 19750 level and then possible upside rally up to 19870 in today's session. in case nifty trades below 19710 level then the downside target can go up to the 19590 level.

[INTRADAY] #BANKNIFTY PE & CE Levels(16/10/2023) Today will be FLAT opening in BANKNIFTY . After opening if banknifty start trading above 44050 level then possible upside rally of 400-500 points upto 44450 Level. And this rally can extend for another 400 points if it gives breakout of 44550 level. Any Major downside only expected in case banknifty starts trading below 43950 level. also possible Reversal Downside 44450 level.

GVK POWER & INFRA | BEST PENNY STOCK TO NOWEntry Price - 9₹
SL - 4.5₹
Targets - 20,27,40,53,90+
In this channel, I share my expertise in trading strategies, technical analysis, and market trends to help you make informed decisions in your trading ventures.
Stay tuned for daily updates, in-depth market analyses, and real-time trading scenarios to witness firsthand how we transform from Zero to Hero in the trading world. My Only aim is to empower you with the knowledge and skills necessary to navigate the complexities of the financial markets successfully.
Disclaimer - All information on this page is for educational purposes only,
we are not SEBI Registered, Please consult a SEBI registered financial advisor for your financial matters before investing And taking any decision. We are not responsible for any profit/loss you made.
Request your support and engagement by liking and commenting & follow to provide encouragement
HAPPY TRADING 👍

[INTRADAY] #BANKNIFTY PE & CE Levels(13/10/2023) Today will be gap down opening in BANKNIFTY . After opening if banknifty start trading below 44450 level then possible downside rally of 400-500 points upto 44050 Level. And this rally can extend for another 400 points if it gives breakdown of 43950 level. Any Major upside only expected in case banknifty starts trading above 44550 level. also possible Reversal upside 44050 level.

Head & Shoulder pattern breakout in SBILIFESBI LIFE INSURANCE COMPANY LTD
Key highlights: 💡⚡
✅On 1 Hour Time Frame Stock Showing Breakout of Head & Shoulder Pattern.
✅ Strong Bullish Candlestick Form on this timeframe.
✅It can give movement up to the Breakout target of 1355+.
✅Can Go Long in this stock by placing a stop loss below 1295-.

[INTRADAY] #BANKNIFTY PE & CE Levels(12/10/2023) Today will be gap up opening in BANKNIFTY . After opening if banknifty sustain above 44550 level then possible upside rally of 400-500 points upto 44950 Level. And this rally can extend for another 400 points if it gives breakout of 45050 level. Any Major downside only expected in case banknifty starts trading below 44450 level.

$SWI Looking Amazing For a LONGNYSE:SWI - SolarWinds Corp
LOOKS GOOD
VOLUME UP
RSI CROSSING
BOTTOM OF RANGE
RISK MANAGEMENT
HIGH FORECAST = $13
What do you THINK?
Please share your ideas with me and the community.

INOXWIND breakout SUCCESSFULINOXWIND has given the breakout. as shown on the chart. we can see it has accumalated the quantity for past 3 months. now today has given breakout with nice volume. it will be a good trade with R:R :: 1:3.
Reason:
descending bullish triangle pattern breakout confirmation.
RSI is breaking 60 to upside nice strength in the trend.
Support at VWAP
Successful breakout after 5 months
High Volume is traded today.
Price > EMAs
Verdict:
Highly Bullish
Plan of action:
Buy: 204-208
Stoploss: 195
Target: 232

Power Grid Technical AnalysisNSE:POWERGRID
Power grid is about to give the break out from the long term resistance trend line. When the stock trades with one good bullish momentum then that will be right time to enter the trade.
At the down side 180 range and 120 range are good support zones to keep the stop loss.

GRAPHITE INDIA ready for breakout and bull runGRAPHITE INDIA ,can be now a multi bagger stock if breakout sustains and investors looking for good investment oppurtunity can enter here as safe entry point.
those who are looking for 1-2 years of investment and good returns can enter in a SIP manner to avoid risk of major loss as volume increases investment amount can be increased.
NOTE: Enter only if strong breakup volumes are found

BUY RELIANCE FROM 2380-2260
Best cheap affordable price to invest or SIP or for swing trade long. I do not analyze technically. Invest just logically from bottom to grab high reward return %. Thank me later. This idea is only have bona fide intention. NSE:RELIANCE

INDOCO gave clear breakout have a lookIndoco remedies gave good breakout with rsi convergence signal as double confirmation.
can reach 420 as per the rule. Below 300 can be bearish reversal.
breakout with good volumes, everything explained on chart.
like and follow for more breakout patterns and investing ideas//thank you.
