Copper (HG): Red Metal Rally or Rusty Bet?(1/9)
Good afternoon, everyone! ☀️ Copper (HG): Red Metal Rally or Rusty Bet?
With copper at $4.88 per pound, is this industrial darling a steal or a trap? Let’s dig into the dirt! 🔍
(2/9) – PRICE PERFORMANCE 📊
• Current Price: $ 4.88 per pound as of Mar 13, 2025 💰
• Recent Move: Up slightly this week (Mar 10-13), per data 📏
• Sector Trend: Industrial metals volatile, with tariff impacts 🌟
It’s a mixed bag—let’s see what’s driving the price! ⚙️
(3/9) – MARKET POSITION 📈
• Global Demand: Key in construction, electronics, renewable energy ⏰
• Supply Dynamics: Major producers in Chile, Peru, China; tariff risks loom 🎯
• Trend: Green energy demand up, but economic slowdowns could dampen growth 🚀
Firm in its industrial roots, but facing new challenges! 🏭
(4/9) – KEY DEVELOPMENTS 🔑
• Trade War Escalation: U.S.-China tensions on Mar 13, 2025, per data, could hit supply chains 🌍
• China’s Response: Uncertain, but likely to affect prices due to its role in copper 📋
• Market Reaction: Prices volatile but up slightly, indicating cautious optimism 💡
Navigating through geopolitical storms! 🛳️
(5/9) – RISKS IN FOCUS ⚡
• Economic Slowdown: Reduced industrial activity could lower demand 🔍
• Supply Disruptions: Tariffs or geopolitical issues could disrupt supply, per data 📉
• Substitution: Other materials or technologies could reduce copper’s importance ❄️
It’s a risky ride, but potential rewards are there! 🛑
(6/9) – SWOT: STRENGTHS 💪
• Increasing Demand from Green Energy: Solar panels, wind turbines, EVs require copper 🥇
• Industrial Staple: Essential in construction and electronics, ensuring steady demand 📊
• Price History: Historically, copper has been a good long-term investment, especially during expansions 🔧
Got solid fundamentals! 🏦
(7/9) – SWOT: WEAKNESSES & OPPORTUNITIES ⚖️
• Weaknesses: Price volatility due to economic cycles and supply disruptions 📉
• Opportunities: Expansion in emerging markets, new applications in tech and infrastructure 📈
Can copper shine through the challenges? 🤔
(8/9) – 📢Copper at $4.88 per pound—your take? 🗳️
• Bullish: $5+ soon, green energy boom drives prices up 🐂
• Neutral: Steady, risks and opportunities balance out ⚖️
• Bearish: $4 looms, economic slowdown hits demand 🐻
Chime in below! 👇
(9/9) – FINAL TAKEAWAY 🎯
Copper’s $4.88 price reflects a mix of optimism and caution 📈. With green energy demand rising but economic and geopolitical risks lingering, it’s a volatile market. DCA-on-dips could be a strategy to average in over time, banking on long-term growth. Gem or bust?
Investment

$HRTG: Heritage Insurance – Catastrophe or Opportunity?(1/9)
Good morning, everyone! ☀️ NYSE:HRTG : Heritage Insurance – Catastrophe or Opportunity?
With HRTG at $11.50, is this insurer a risky bet or a hidden gem in the catastrophe-prone market? Let’s dive into the details! 🔍
(2/9) – PRICE PERFORMANCE 📊
• Current Price: $ 11.50 as of Mar 12, 2025 💰
• Recent Move: Slipped 4% post-Q4 earnings, but stabilized 📏
• Sector Trend: Insurance sector steady, with P&C insurers facing claims volatility 🌟
It’s a volatile ride, but potential value lurks! ⚙️
(3/9) – MARKET POSITION 📈
• Market Cap: Approx $200M (assuming 17.39M shares) 🏆
• Operations: Property and casualty insurance in high-risk areas ⏰
• Trend: Niche focus on catastrophe-prone regions like Florida, potential for growth 🎯
Firm in its niche, but risks are high! 🚀
(4/9) – KEY DEVELOPMENTS 🔑
• Q4 2024 Earnings: Net income $0.66 per share, down from $1.15 YoY 🔄
• Revenue: Slightly missed estimates, per reports 🌍
• Market Reaction: Stock slipped 4%, but stabilized post-earnings 📋
Adapting to challenges, looking ahead! 💡
(5/9) – RISKS IN FOCUS ⚡
• Natural Disasters: High exposure to claims from hurricanes, floods, etc. 🔍
• Regulatory Changes: Potential impacts from state regulations in Florida and other areas 📉
• Competition: Increasing competition in high-risk insurance markets ❄️
Tough, but risks are part of the game! 🛑
(6/9) – SWOT: STRENGTHS 💪
• Niche Market: Focus on high-risk areas with potentially higher premiums 🥇
• Established Presence: Strong foothold in Florida and other states 📊
• Growth Potential: Increasing demand due to climate change and urbanization 🔧
Got potential in a challenging market! 🏦
(7/9) – SWOT: WEAKNESSES & OPPORTUNITIES ⚖️
• Weaknesses: Earnings volatility from natural disasters, regulatory risks 📉
• Opportunities: Expansion into new high-risk areas, technological advancements for better risk management 📈
Can it weather the storms and shine? 🤔
(8/9) –📢HRTG at $11.50, with undervaluation signs—your take? 🗳️
• Bullish: $15+ soon, undervalued gem 🐂
• Neutral: Steady, risks balance growth ⚖️
• Bearish: $10 looms, catastrophe ahead 🐻
Chime in below! 👇
(9/9) – FINAL TAKEAWAY 🎯
HRTG’s $11.50 price tags potential value 📈, but catastrophe risks add caution 🌿. Volatility’s our friend—dips are DCA gold 💰. Grab ‘em low, climb like pros! Gem or bust?

$CRWD: Crowdstrike – Cybersecurity Titan or Overvalued Hype?(1/9)
Good afternoon, investors! ☀️ NASDAQ:CRWD : Crowdstrike – Cybersecurity Titan or Overvalued Hype?
With NASDAQ:CRWD at $322, is this cyber guardian still leading the pack or is it time to cash in? Let's dive into the digital trenches! 🔍
(2/9) – PRICE PERFORMANCE 📊
• Current Price: $ 322 as of Mar 11, 2025 💰
• Recent Moves: Down from $360+ post-Q4, per X posts 📏
• Sector Trend: Cybersecurity demand remains robust, per market insights 🌟
It’s a steady ride with potential for growth! ⚙️
(3/9) – MARKET POSITION 📈
• Market Cap: ~$75B (based on 232.5M shares) 🏆
• Operations: Leader in endpoint security and threat intelligence ⏰
• Trend: Expanding into AI-driven security solutions, per recent developments 🎯
Firm, standing tall in the cyber battlefield! 🚀
(4/9) – KEY DEVELOPMENTS 🔑
• Earnings Win: Q1 FY25 beat estimates, guidance raised, per X posts 🔄
• Cyber Boom: Threats fuel demand, per Mar 6 chatter 🌍
• Market Reaction: Stock jumped, then dipped, per X sentiment 📋
Battling, with innovation driving the narrative! 💡
(5/9) – RISKS IN FOCUS ⚡
• Competition: Intense from Palo Alto Networks, Zscaler, etc. 🔍
• Valuation: High P/E ratio may concern some investors 📉
• Regulatory Shifts: Potential new laws impacting data privacy ❄️
Navigating challenges in a dynamic landscape! 🛑
(6/9) – SWOT: STRENGTHS 💪
• Market Leader: Dominant in endpoint security 🥇
• Innovation: AI and ML-driven solutions keep it ahead 📊
• Financial Health: Strong cash position, no debt 🔧
Built to withstand cyber storms! 🏦
(7/9) – SWOT: WEAKNESSES & OPPORTUNITIES ⚖️
• Weaknesses: High valuation, competitive pressures 📉
• Opportunities: Growing demand for cloud security, new market segments 📈
Can it capitalize on the digital expansion? 🤔
(8/9) –📢Crowdstrike at $322—your investment move? 🗳️
• Bullish: $400+ soon, cyber threats fuel growth 🐂
• Neutral: Holding steady, balancing risks and rewards ⚖️
• Bearish: $280 drop, overvalued in a cooling market 🐻
Cast your vote below! 👇
(9/9) – FINAL TAKEAWAY 🎯
Crowdstrike’s $322 stance shows resilience 📈, but cautious investors eye valuation and competition 🌿. Dips are our DCA playground 💰. Grab ‘em low, ride the wave! Gem or bust?

The Big ReloadI anticipate a significant pullback on the daily timeframe, targeting the $15,000 level before resuming the upward trend.
Following a substantial break in the bullish trend, a robust retracement is expected. This correction should trigger considerable buying momentum around the $15,000 to $16,000 range, presenting opportunities for long-term positions to the upside.

$SUI: SUI Blockchain’s Token – Poised for Growth or Overhyped?(1/9)
Good morning, crypto enthusiasts! ☀️ CRYPTOCAP:SUI : SUI Blockchain’s Token – Poised for Growth or Overhyped?
With SUI at $2.70 , is this Layer 1 blockchain’s token set to dominate the crypto market or just another flash in the pan? Let’s dive into the digital realm and find out! 🔍
(2/9) – PRICE PERFORMANCE 📊
• Current Price: $ 2.70 as of Mar 7, 2025 💰
• Historical Context: Launched May 3, 2023, with significant growth in 2024 📏
• Sector Trend: Blockchain gaming and NFTs driving demand 🌟
It’s a hot commodity in the crypto space! ⚙️
(3/9) – MARKET POSITION 📈
• Market Cap: Approx $1.2B (based on 1B tokens) 🏆
• Operations: Layer 1 blockchain with focus on speed and scalability ⏰
• Trend: Partnerships with gaming studios, NFT platforms boosting adoption 🎯
Solid, with a clear path to utility and growth! 🚀
(4/9) – KEY DEVELOPMENTS 🔑
• Recent Partnerships: Collaborations with gaming firms like Mythical Games 🔄
• NFT Sales: Robust growth in NFT transactions on SUI blockchain 🌍
• Market Reaction: Positive sentiment post-launch and recent updates 📋
Thriving, with a focus on real-world applications! 💡
(5/9) – RISKS IN FOCUS ⚡
• Competition: Strong rivals like Solana, Avalanche in the L1 space 🔍
• Regulatory Challenges: Crypto regulations could impact growth 📉
• Volatility: Crypto market’s inherent swings affect price ❄️
Navigating these choppy waters is key! 🛑
(6/9) – SWOT: STRENGTHS 💪
• Performance: High-speed transactions, ideal for gaming and more 🥇
• Partnerships: Growing ecosystem with gaming and NFT projects 📊
• Scalability: Designed for mass adoption, per developers’ claims 🔧
Got the goods to stand out in the blockchain race! 🏦
(7/9) – SWOT: WEAKNESSES & OPPORTUNITIES ⚖️
• Weaknesses: New project, unproven in long-term stability 📉
• Opportunities: Expanding into metaverse, AI integration 📈
Can it scale and secure its position or get lost in the noise? 🤔
(8/9) –📢SUI at $2.70—your take? 🗳️
• Bullish: $5+ by end of 2025, gaming boom drives growth 🐂
• Neutral: Steady growth, risks balanced ⚖️
• Bearish: $0.50 by year-end, competition overtakes 🐻
Chime in below! 👇
(9/9) – FINAL TAKEAWAY 🎯
SUI’s at $2.70, with a promising future in blockchain gaming and NFTs. Volatility’s a given, but its strengths could lead to significant gains. DCA on dips, ride the wave! Gem or bust?

$ADA: Cardano’s Quiet Climb – Ready to Roar or Still Crawling?(1/9)
Good afternoon, crypto enthusiasts! 🌙 Cardano ( CRYPTOCAP:ADA ): Blockchain’s Steady Eddie – Can It Break Out?
ADA’s chugging along at $0.84, with new dApp launches and partnerships. Is it time to stake or wait for a dip? Let’s dive in! 🔍
(2/9) – PRICE PERFORMANCE 📊
• Recent Trend: Holding at $0.84, up from last month’s peak of $0.82 📉
• 2025 Context: New dApp activity and African expansion driving interest 📏
• Sector Trend: Crypto market recovering from February’s 20.57% crash, but volatility persists 🌟
It’s a steady performer, but can it break out? ⚙️
(3/9) – MARKET POSITION 📈
• Ranking: Top 10 cryptocurrency by market cap, per CoinMarketCap 🏆
• Use Case: Smart contract platform with a focus on scalability and security ⏰
• Trend: Increasing adoption in emerging markets, particularly Africa 🎯
Firm, with a solid foundation and growth potential! 🚀
(4/9) – KEY DEVELOPMENTS 🔑
• Market Reaction: Shares steady, with analysts optimistic about long-term growth 📋
Cookin’ up something big, but the market’s cautious! 💡
(5/9) – RISKS IN FOCUS ⚡
• Competition: Ethereum and Solana offer stiff competition with more established ecosystems 🕳️
• Regulatory: Crypto regulations could impact adoption and growth ⚖️
• Volatility: Crypto market’s unpredictable swings can hit hard ❄️
Tread carefully, but the path looks promising! 🛑
(6/9) – SWOT: STRENGTHS 💪
• Scalability: Hydra and other upgrades promise high throughput and low fees 📊
• Community: Strong, academic-driven community with a focus on long-term development 🥇
• Partnerships: Growing presence in emerging markets, especially Africa 🌍
Got the building blocks for success! 🏦
(7/9) – SWOT: WEAKNESSES & OPPORTUNITIES ⚖️
• Weaknesses: Slower adoption compared to competitors, limited dApp activity 📉
• Opportunities: Expanding into new markets, new dApp developments, and regulatory clarity in some regions 📈
Can it catch up and surpass? 🤔
(8/9) –📢ADA’s at $0.45, with mixed market signals—your take? 🗳️
• Bullish: $1 soon, fundamentals are strong 🐂
• Neutral: Steady, wait for clearer skies ⚖️
• Bearish: Under $0.30, competition’s too fierce 🐻
Vote below! 👇
(9/9) – FINAL TAKEAWAY 🎯
ADA’s holding its ground at $0.83, with promising developments but market headwinds. Volatility’s our friend—dips are DCA gold 💰. Grab ‘em low, ride high! Gem or bust?

$KHC: Kraft Heinz – Sizzling Growth or Cooling Off?(1/9)
Good Morning, snackers! 🌞 NASDAQ:KHC : Kraft Heinz – Sizzling Growth or Cooling Off?
Kraft Heinz dished out $6.58B in Q4 2024 but missed the mark—price hikes are biting back! Can this food giant spice things up again? Let’s dig in! 🔍
(2/9) – PRICE PERFORMANCE 📊
• Q4 2024: Revenue at $6.58B, down 4.1% year-over-year, missed estimates 📉
• Full Year 2024: Free cash flow up 6% to $3.2B, per Yahoo Finance 💰
• Sector Trend: Consumer staples steady but facing thriftier shoppers 🌟
A bit of a sour taste, yet cash keeps flowin’! ⚙️
(3/9) – MARKET POSITION 📈
• Standing: 3rd largest food & bev in North America, per earnings 🏆
• Brands: Heinz, Oscar Mayer, Lunchables—household legends ⏰
• Trend: Pushing “Accelerate” platforms for growth 🎯
Still a pantry king, but gotta woo new eaters! 🚀
(4/9) – KEY DEVELOPMENTS 🔑
• Q4 Results: EPS beat at $0.84, but sales lagged, per Feb 12 Yahoo 🔄
• Strategy: Plans to adjust pricing on key brands, per Reuters 🌍
• Market Reaction: Shares slipped post-earnings, analysts cautious 📋
Cookin’ up fixes, but the stove’s tricky! 💡
(5/9) – RISKS IN FOCUS ⚡
• Demand: High prices deter budget shoppers, per Reuters 🔍
• Volume: Organic sales dropped 3.1%, volume down 4.1% 📉
• Competition: Smaller brands nip at their heels ❄️
Tough bites to chew, but not outta the game! 🛑
(6/9) – SWOT: STRENGTHS 💪
• Cash Flow: $3.2B free cash flow in 2024, up 6% 🥇
• Brand Power: Global reach, iconic products 📊
• Dividends: Steady $0.40/share payout 🔧
Got a solid recipe in the pot! 🏦
(7/9) – SWOT: WEAKNESSES & OPPORTUNITIES ⚖️
• Weaknesses: Sales miss, volume dips, per Q4 earnings 📉
• Opportunities: New products, emerging markets expansion 📈
Can they whip up a tastier comeback? 🤔
(8/9) – 📢Kraft Heinz’s cash flow’s up, but sales took a hit—your take? 🗳️
• Bullish: $40+ soon, staples rebound 🐂
• Neutral: Steady, tweaks needed ⚖️
• Bearish: $25 looms, demand stalls 🐻
Serve your thoughts below! 👇
(9/9) – FINAL TAKEAWAY 🎯
Kraft Heinz’s $3.2B cash flow tastes sweet 📈, but demand dips add a sour note 🌿. Volatility’s our sous-chef—dips are DCA gold 💰. Grab ‘em low, savor the rise! Gem or bust?

$XRP: Ripple’s Rocket – Ready to Soar or Facing Turbulence?(1/9)
Good evening, everyone! 🌙 CRYPTOCAP:XRP : Ripple’s Rocket – Ready to Soar or Facing Turbulence?
CRYPTOCAP:XRP ’s up 8.4% despite a crypto crash, with SEC rumors fueling hope—but will adoption or regulation steer this rocket? Let’s dive in! 🔍
(2/9) – PRICE PERFORMANCE 📊
• Recent Trend: Gained 8.4% despite a crypto market down 20.57% in Feb, per U.Today 📈
• 2025 Context: Speculation of SEC appeal dismissal boosts sentiment 📏
• Sector Trend: Crypto market down, but CRYPTOCAP:XRP bucks the trend 🌟
It’s a fighter, shaking off the bears! ⚙️
(3/9) – MARKET POSITION 📈
• Ranking: Remains a top 10 cryptocurrency, per CoinMarketCap 🏆
• Use Case: Leading in cross-border payments with RippleNet ⏰
• Trend: Regulatory clarity hopes rise, potentially unlocking more adoption 🎯
Firm, a key player in the altcoin arena! 🚀
(4/9) – KEY DEVELOPMENTS 🔑
• SEC Case: Closed-door meeting Feb 27 fuels dismissal talk, per Ripple CEO’s X post 🔄
• Adoption: RippleNet partnerships expand, with new banks joining for faster payments 🌍
• Market Reaction: Up 8.4% amid market turmoil, showing resilience 📋
Adapting, with legal and adoption catalysts! 💡
(5/9) – RISKS IN FOCUS ⚡
• Regulation: SEC case uncertainty persists, appeal process ongoing 🕳️
• Market Volatility: Crypto market’s unpredictable swings can hit hard ❄️
• Competition: Other blockchain platforms vying for cross-border payment dominance ⚖️
Tough, but risks are part of the game! 🛑
(6/9) – SWOT: STRENGTHS 💪
• Resilience: Up 8.4% when others fall, showing strong investor confidence 🥇
• Utility: RippleNet’s fast cross-border payments attract banks and institutions 📊
• Community: Robust support from holders and Ripple’s strategic partnerships 🔧
Got fuel in the tank! 🏦
(7/9) – SWOT: WEAKNESSES & OPPORTUNITIES ⚖️
• Weaknesses: SEC case not fully resolved, adoption slower than hoped 📉
• Opportunities: Potential ETF approval, expanding CBDC projects, and new partnerships 📈
Can it break free and soar? 🤔
(8/9) – 📢 CRYPTOCAP:XRP ’s up 8.4% despite market crash, SEC buzz grows, your take? 🗳️
• Bullish: $3+ soon, legal win sparks rally 🐂
• Neutral: Steady, risks balance ⚖️
• Bearish: Below $2, regulation stalls 🐻
Chime in below! 👇
(9/9) – FINAL TAKEAWAY 🎯
CRYPTOCAP:XRP ’s resilience amid a market crash shows its mettle 📈, but SEC uncertainty and competition pose challenges 🌿. Volatility’s our friend—dips are DCA gold 💰. Grab ‘em low, climb like pros! Gem or bust? S

TSMC: AI Chip Titan – Still the King or Facing New Challengers?Good morning, everyone! ☀️ TSMC: AI Chip Titan – Still the King or Facing New Challengers?
(1/9)
TSMC’s riding the AI wave with record Q4 2024 profits, but with U.S.-China curbs and fab delays, is this semiconductor king untouchable or at a crossroads? Let’s unpack it! 🔍
(2/9) – PRICE PERFORMANCE 📊
• Q4 2024: Net income up 57% to $11.4B, revenue climbed 39% 💰
• Full Year 2024: Revenue hit $87.1B, up 34% from 2023 📏
• Sector Trend: AI chip demand soaring, per Reuters 🌟
It’s a powerhouse, driven by tech’s hunger! ⚙️
(3/9) – MARKET POSITION 📈
• Market Share: Over 60% of global foundry market 🏆
• Clients: Apple, Nvidia, AMD—big names rely on ‘em ⏰
• Trend: Expanding fabs in U.S., Japan, Germany 🎯
Firm, holding the throne but not without battles! 🚀
(4/9) – KEY DEVELOPMENTS 🔑
• Q4 Earnings: Record $11.4B profit, per Jan 16 Reuters 🔄
• Expansion: Arizona fab faces delays, full ops by 2027? 🌍
• Market Reaction: Shares up 81% in 2024, still strong 📋
Adapting, with global eyes on its moves! 💡
(5/9) – RISKS IN FOCUS ⚡
• Geopolitics: U.S.-China export curbs hit demand 🔍
• Costs: U.S. fab chips 50% pricier than Taiwan 📉
• Talent: Lack of skilled U.S. workers slows growth ❄️
Tough, but risks loom large! 🛑
(6/9) – SWOT: STRENGTHS 💪
• Profit Surge: 57% net income jump in Q4 2024 🥇
• Tech Lead: 5nm mass production, 3nm in R&D 📊
• Client Base: Powers Apple, Nvidia, more 🔧
Got silicon in the tank! 🏦
(7/9) – SWOT: WEAKNESSES & OPPORTUNITIES ⚖️
• Weaknesses: High U.S. fab costs, talent gaps 📉
• Opportunities: AI chip demand, new fabs in Japan, EU 📈
Can it keep the lead amid global shifts? 🤔
(8/9) – 📢TSMC’s Q4 profit up 57%, AI booming, your take? 🗳️
• Bullish: Still the king, long-term winner 🐂
• Neutral: Steady, but risks weigh ⚖️
• Bearish: Curbs and costs slow growth 🐻
Chime in below! 👇
(9/9) – FINAL TAKEAWAY 🎯
TSMC’s record profits signal AI dominance 📈, but U.S.-China curbs and fab delays add caution 🌿. Volatility’s our friend—dips are DCA gold 💰. Grab ‘em low, climb like pros! Gem or bust?

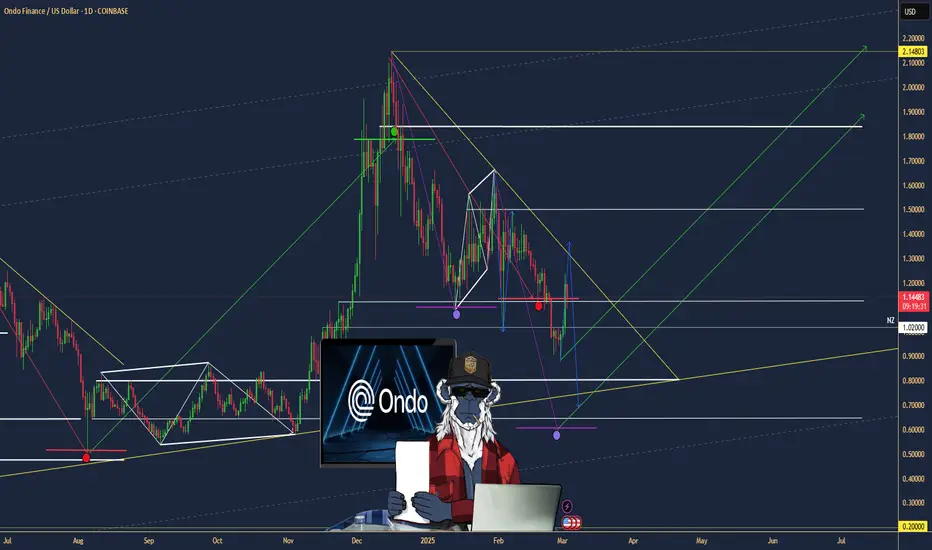
$ONDO: Ondo Finance – Tokenizing the Future or Facing Roadblocks
(1/9)
Good morning, champs! ☀️ LSE:ONDO : Ondo Finance – Tokenizing the Future or Facing RWA Roadblocks?
Ondo Finance just joined Mastercard’s Multi-Token Network, aiming to tokenize U.S. Treasuries! But with market volatility, is this RWA gem a buy or a wait? Let’s dive in! 🔍
(2/9) – PRICE PERFORMANCE 📊
• Recent Trend: Transaction volume spiked to 400M in Jan 2025, now ~300M 💰
• Market Insight: Up 1.6% recently (Daily Hodl, Feb 2025) 📏
• Sector: RWA tokenization surging with TradFi interest 🌟
It’s buzzing in the DeFi space! ⚙️
(3/9) – MARKET POSITION 📈
• Market Cap: Not specified; holds 40% of tokenized securities market 🏆
• Holdings: U.S. Treasuries, bonds via USDY, OUSG tokens ⏰
• Trend: Whales hold 88% of tokens, per IntoTheBlock 🎯
Firm, leading RWA tokenization! 🚀
(4/9) – KEY DEVELOPMENTS 🔑
• Partnership: Joined Mastercard MTN as first RWA provider (Feb 26, 2025) 🔄
• Expansion: Teamed with World Liberty Financial for RWAs 🌍
• Market Reaction: Steady growth in transaction volume 📋
Adapting, bridging TradFi and DeFi! 💡
(5/9) – RISKS IN FOCUS ⚡
• Volatility: Crypto market swings could hit token value 🔍
• Regulation: Compliance hurdles in tokenized assets 📉
• Concentration: High whale ownership (88%) risks dumps ❄️
Tough, but risks loom! 🛑
(6/9) – SWOT: STRENGTHS 💪
• RWA Leader: 40% tokenized securities market share 🥇
• Big Backers: BlackRock, Coinbase Ventures support 📊
• Tech Edge: Tokenizing U.S. Treasuries for DeFi 🔧
Got fuel in the tank! 🏦
(7/9) – SWOT: WEAKNESSES & OPPORTUNITIES ⚖️
• Weaknesses: High whale concentration, market volatility 📉
• Opportunities: TradFi integration, DeFi yield growth 📈
Can it tokenize to the moon? 🤔
(8/9) – 📢Transaction volume at 300M, Mastercard partnership live, your take? 🗳️
• Bullish: $2 soon, TradFi loves it 🐂
• Neutral: Steady, risks balance ⚖️
• Bearish: $0.90 looms, whales dump 🐻
Chime in below! 👇
(9/9) – FINAL TAKEAWAY 🎯
SMCI’s transaction volume and TradFi ties scream potential 📈, but whale concentration adds caution 🌿. Volatility’s our buddy—dips are DCA gold 💰. Grab ‘em low, climb like pros! Gem or bust?
$SMCI: Super Micro Computer – AI Server Surge or a Pit Stop?
NASDAQ:SMCI : Super Micro Computer – AI Server Surge or a Pit Stop?
AI infrastructure’s hotter than a July barbecue, with revenue up 110% to $14,989.2 million in 2024! But with internal control concerns, is this tech beast charging up or taking a breather? Let’s dive in!
(1/9)
Good morning, everyone! ☀️ NASDAQ:SMCI : Super Micro Computer – AI Server Surge or a Pit Stop?
AI infrastructure’s hotter than a July barbecue, with revenue up 110% to $14,989.2 million in 2024! But with internal control concerns, is this tech beast charging up or taking a breather? Let’s dive in! 🔍
(2/9) – PRICE PERFORMANCE 📊
• Fiscal 2024: Net sales soared 110.4% to $14,989.2 million 💰
• Server Systems: Up 115.9%, GPU servers leading the charge 📏
• Sector Trend: AI demand’s skyrocketing 🌟
It’s a wild ride, fueled by AI’s hunger! ⚙️
(3/9) – MARKET POSITION 📈
• Market Cap: $2.4B, based on shares outstanding 🏆
• Holdings: Servers, storage, and AI solutions ⏰
• Trend: International sales steady at 32%, showing global appetite 🎯
Firm, carving a niche in AI infrastructure! 🚀
(4/9) – KEY DEVELOPMENTS 🔑
• 10-K Filing: Dropped Feb 25, 20
25, dodged NASDAQ delisting 🔄
• Revenue Driver: GPU servers for AI workloads 🌍
• Market Reaction: Shares jumped 19.8% after-hours 📋
Adapting, with investors cheering the comeback! 💡
(5/9) – RISKS IN FOCUS ⚡
• Internal Controls: Audit flagged issues, per Feb 25 filing 🔍
• Competition: Big players in AI server space 📉
• Volatility: High-growth sectors swing hard ❄️
Tough, but risks loom! 🛑
(6/9) – SWOT: STRENGTHS 💪
• Revenue Boom: 110% growth, $14,989.2 million in sales 🥇
• AI Focus: GPU servers crushing it 📊
• Global Reach: 32% international sales 🔧
Got rocket fuel in the tank! 🏦
(7/9) – SWOT: WEAKNESSES & OPPORTUNITIES ⚖️
• Weaknesses: Internal control concerns, per audit 📉
• Opportunities: AI infrastructure demand keeps soaring 📈
Can it fix the cracks and ride the wave? 🤔
(8/9) – 📢 SMCI’s revenue up 110%, with AI demand exploding, your take? 🗳️
• Bullish: Shares to $50+ soon, AI’s unstoppable 🐂
• Neutral: Steady, risks balance growth ⚖️
• Bearish: $35 looms, controls spook 🐻
Chime in below! 👇
(9/9) – FINAL TAKEAWAY 🎯
SMCI’s revenue surge to $14,989.2 million screams AI potential 📈, but control issues add a pinch of caution 🌿. Volatility’s our friend—dips are DCA gold 💰. Grab ‘em low, climb like pros! Gem or bust?

$LIT: EV's Lithium-Powered ETF – Charging Up or Running on EmptyAMEX:LIT : EV's Lithium-Powered ETF – Charging Up or Running on Empty?
EV demand is up 35% in 2023, and lithium prices are up 8% in 2025 so far. But AMEX:LIT is at $40.82, down from last year. Is it time to buy, hold, or sell? Let's dive in.
(1/9)
Good morning, everyone! ☀️EV demand is up 35% in 2023, and lithium prices are up 8% in 2025 so far. But AMEX:LIT is at $40.82, down from last year. Is it time to buy, hold, or sell? Let's dive in. 🔍
(2/9) – PRICE PERFORMANCE 📊
• Current Price: $ 40.82 💰
• Sector Trend: EV sales globally strong (35% growth in 2023, IEA) 🌟
It’s volatile, with EV growth as a tailwind! ⚙️
(3/9) – MARKET POSITION 📈
• Market Cap: Approximately $ 1.37B (based on $ 40.82 price and 33.5M shares, per Apr 30, 2024, data) 🏆
• Holdings: 40 stocks, top include Albemarle, Tesla (per Global X ETFs) ⏰
• Trend: Lithium demand tied to EV penetration, per IEA data 🎯
Firm, riding the battery wave! 🚀
(4/9) – KEY DEVELOPMENTS 🔑
• EV Demand: Continued rise in 2025, per general expectation and IEA trends 🔄
• Lithium Prices: Mixed, with spot prices varying; ETF at $ 40.82 reflects market conditions 🌍
• Market Reaction: Reflects current market dynamics, no specific Mar 3 data 📋
Adapting, EV surge drives interest! 💡
(5/9) – RISKS IN FOCUS ⚡
• Oversupply: Fears may cap lithium gains, per industry reports 🔍
• Competition: New battery tech could shift demand, per industry reports 📉
• Volatility: Lithium prices historically swing, per Reuters 2023 data ❄️
Tough, but risks loom! 🛑
(6/9) – SWOT: STRENGTHS 💪
• EV Growth: Demand for lithium batteries rising, per IEA 2023 data (35% global sales increase) 🥇
• Diversification: 40 holdings across mining, battery tech, per Global X ETF 📊
• Sector Leader: Exposure to Albemarle, Tesla, per Global X ETF 🔧
Got fuel in the tank! 🏦
(7/9) – SWOT: WEAKNESSES & OPPORTUNITIES ⚖️
• Weaknesses: Price volatility, current price down from last known, oversupply fears 📉
• Opportunities: EV sales growth, potential lithium price recovery based on demand, per IEA trends 📈
Can it capitalize on demand? 🤔
(8/9) – 📢 AMEX:LIT ’s at $ 40.82, EV demand climbing, your take? 🗳️
• Bullish: Price to rise with EV surge 🐂
• Neutral: Steady, risks balance ⚖️
• Bearish: Oversupply or other factors cap gains 🐻
Chime in below! 👇
(9/9) – FINAL TAKEAWAY 🎯
AMEX:LIT ’s EV demand drives potential 📈, but current price at $ 40.82 reflects market caution. Volatility bites, yet dips are our DCA gold 💰. We grab ‘em low, climb like pros! Gem or bust?

EUR/USD Daily Chart Analysis For Week of Feb 28, 2025Technical Analysis and Outlook:
In the initial rally attempt in this week's trading session, The Euro failed to reach our target of Inner Currency Rally 1.060 due to prevailing bearish sentiment. As a result, the market established a Mean Resistance target of 1.041. The current trend suggests a continuation of the downward price movement toward our designated target of Mean Support at 1.030, and there may be a retest of the Completed Outer Currency Dip at 1.020 via Key Support at 1.024. Conversely, if the anticipated downward trend does not materialize, we may witness the Eurodollar retesting the Mean Resistance level of 1.041 and subsequently target the Inner Currency Rally level of 1.060.

Trump Media ($DJT) – Truth Social’s Latest MovesTrump Media ( NASDAQ:DJT ) – Truth Social’s Latest Moves
(1/9)
Good afternoon, TradingView! 🌞 Trump Media ( NASDAQ:DJT ) is trending 📈, last at $ 29.23 per Feb 18, 2025, close (Yahoo Finance), down 3.82% that day. Q4 2024 showed a $ 401M loss, yet cash reserves hit $ 777M 🌿. Let’s dive into this social media play! 🔍
(2/9) – PRICE PERFORMANCE 📊
• Feb 18, 2025: $ 29.23, down 3.82% from $ 30.39 💰
• Q4 2024: Revenue at $ 1M, down from $ 1.1M year prior 📏
• Full Year 2024: $ 3.6M sales, $ 401M net loss 🌟
It’s volatile, with cash as a lifeline! ⚙️
(3/9) – MARKET POSITION 📈
• Market Cap: $ 6.43B as of Feb 18, 2025, per Yahoo 🏆
• User Base: 9M Truth Social sign-ups as of Feb 2024 ⏰
• Trend: Exploring M&A, per Feb 14 filing 🎯
Firm, betting on growth! 🚀
(4/9) – KEY DEVELOPMENTS 🔑
• Q4 Earnings: $ 401M loss reported Feb 14, 2025 🔄
• Expansion: Plans for Truth.Fi ETFs, per Feb 6 Reuters 🌍
• Market Reaction: Flat post-earnings, per CNBC 📋
Adapting, diversification’s key! 💡
(5/9) – RISKS IN FOCUS ⚡
• Losses: $ 401M hit in 2024, per Feb 14 filing 🔍
• Competition: Meta, X pressure social media 📉
• Regulation: Legal woes linger, per Feb 14 SEC ❄️
Tough, but risks loom large! 🛑
(6/9) – SWOT: STRENGTHS 💪
• Cash Reserves: $ 777M buffer, per Feb 14 filing 🥇
• Brand: Trump loyalty drives interest 📊
• Flexibility: M&A plans in motion 🔧
Got resilience in the tank! 🏦
(7/9) – SWOT: WEAKNESSES & OPPORTUNITIES ⚖️
• Weaknesses: Revenue down, losses up 📉
• Opportunities: Crypto ventures, M&A growth 📈
Can NASDAQ:DJT turn cash into wins? 🤔
(8/9) – NASDAQ:DJT ’s $ 23.93 , cash-rich but loss-heavy, your take? 🗳️
• Bullish: $ 35+ soon, M&A pays 🐂
• Neutral: Steady, risks balance ⚖️
• Bearish: $ -20 looms, losses weigh 🐻
Chime in below! 👇
(9/9) – FINAL TAKEAWAY 🎯
NASDAQ:DJT ’s $ 29.23 Feb 18 close masks $ 777M cash stash 📈, but $ 401M losses sting 🌿. Volatility bites, yet dips are our DCA gold 💰. We grab ‘em low, climb like pros! Gem or bust?

BITCOIN'S LAST CALL📢 Bitcoin is currently at $86,107, and the world is SLEEPING on what’s about to happen next. The biggest wealth transfer in human history is happening right in front of us – will you seize the moment or regret it forever?
🔥 WHY BITCOIN IS ABOUT TO SHOCK THE WORLD:
✅ Spot ETFs are eating up BTC supply FASTER than miners can produce! 🏦
✅ The 2024 Halving is coming – a supply shock like NEVER before! ⏳
✅ Banks, hedge funds, and even GOVERNMENTS are secretly stockpiling BTC! 💰🌍
✅ Fiat is collapsing – Bitcoin is positioning itself as the world’s new financial backbone!
💰 BITCOIN PRICE PREDICTIONS – SAVE THIS POST!
🔹 $100K – The Next Psychological Barrier (And It’s Closer Than You Think!)
🔹 $250K – The Institutional FOMO Era (Big Money Can’t Ignore BTC Anymore!)
🔹 $500K – The Supply Crisis Hits (BTC Becomes Scarce Like Never Before!)
🔹 $1,000,000 – The Endgame (Bitcoin Becomes the World’s Reserve Currency!) 🚀
📉 They laughed at Bitcoin at MIL:1K … They doubted it at $10K… They ignored it at $50K… And soon, they’ll regret missing $1M BTC!
⏳ This is the LAST CYCLE before Bitcoin becomes untouchable for the average person. Will you act, or will you watch others make history?
💬 COMMENT your Bitcoin price prediction below! Will BTC hit $1M? LIKE & SHARE if you believe Bitcoin is the future! 🚀🔥

Will Russia’s New Dawn Reshape Global Finance?As the Russo-Ukrainian War edges toward a hypothetical resolution, Russia stands poised for an economic renaissance that could redefine its place in the global arena. Retaining control over resource-laden regions like Crimea and Donbas, Russia secures access to coal, natural gas, and vital maritime routes—assets that promise a surge in national wealth. The potential lifting of U.S. sanctions further amplifies this prospect, reconnecting Russian enterprises to international markets and unleashing energy exports. Yet, this resurgence is shadowed by complexity: Russian oligarchs, architects of influence, are primed to extend their reach into these territories, striking resource deals with the U.S. at mutually beneficial rates. This presents a tantalizing yet treacherous frontier for investors—where opportunity dances with ethical and geopolitical uncertainties.
The implications ripple outward, poised to recalibrate global economic currents. Lower commodity prices could ease inflationary pressures in the West, offering relief to consumers while challenging energy titans like Saudi Arabia and Canada to adapt. Foreign investors might find allure in Russia’s undervalued assets and a strengthening ruble, but caution is paramount. The oligarchs’ deft maneuvering—exploiting political leverage to secure advantageous contracts—casts an enigmatic shadow over this revival. Their pragmatic pivot toward U.S. partnerships hints at a new economic pragmatism, yet it prompts a deeper question: Can such arrangements endure, and at what cost to global stability? The stakes are high, and the outcomes remain tantalizingly uncertain.
This unfolding scenario challenges us to ponder the broader horizon. How will investors weigh the promise of profit against the moral quandaries of engaging with a resurgent Russia? What might the global financial order become if Russia’s economic ascent gains momentum? The answers elude easy resolution, but the potential is undeniable—Russia’s trajectory could anchor or upend markets, depending on the world’s response. Herein lies the inspiration and the test: to navigate this landscape demands not just foresight, but a bold reckoning with the interplay of economics, ethics, and power.

BERGEPAINT good to studyNSE:BERGEPAINT
Given Breakout of Range
Good to keep on the radar
Always respect SL & position sizing
========================
Trade Secrets By Pratik
========================
Disclaimer
NOT SEBI REGISTERED
This is our personal view and this analysis
is only for educational purposes
Please consult your advisor before
investing or trading
You are solely responsible for any decisions
you take on basis of our research.

Monthly Breakout but still...Monthly Breakout; However, still at Important Resistance zone.
Once 10.70 is Crossed & Sustained, 12 - 12.50 can be easy Targets.
It has given a Breakout from Rectangular Channel around 8.70 - 9.
& also re-tested it.
Hidden Bullish Divergence has also appeared.
as of Now, it should not break 6.60.

SPX Target 6270 - Can It Get There?SPX Targets 6270 – But Can It Get There? | SPX Market Analysis 20 Feb 2025
The SPX is climbing like a caffeinated squirrel... ok, maybe not. It’s more like a slightly confused sloth trying to find second gear!..., while DJX and RUT are stuck in the mud.
The breakout move we’ve been waiting for has arrived, and now the question is—does it have enough fuel to hit 6270, or will it stumble and trigger my hedge at 6100? Bollinger Bands are too tight for reliable setups, so I’m sticking with my 6 money-making patterns until volatility expands.
Let’s break it all down…
---
SPX Deeper Dive Analysis:
📈 SPX is Soaring (like a fat pigeon!) – But the Other Indexes Aren’t Joining the Party
While SPX is off making new highs, its friends DJX and RUT seem to have lost their invitations.
DJX is struggling to gain meaningful ground 📉
RUT can’t even catch an uptick, making it the weakest of the bunch ❌
Meanwhile, SPX is leading the way, with a clear breakout in play
A closely following NDX is nipping at SPX's heals
💡 Breakout Confirmed – But Can It Hold?
Scenario #1 from our previous discussions has unfolded—the range has broken out.
Target: 6270 🎯
Hedge trigger: 6100 in case the move fails
This is the good kind of waiting—waiting for profits to materialise
🔄 Why I’m Avoiding Tag ‘n Turn Setups Right Now
Normally, after a breakout, I’d shift back to Tag 'n Turn setups. But there’s a problem…
Bollinger Bandwidth is too tight, making moves too fast
Price is flipping from one side of the bands to the other
A Bollinger Band pinch is forming, indicating more compression before expansion
So, what’s the plan?
✅ I’ll continue to use my 6 money-making patterns
✅ I’ll wait for volatility to expand before returning to Bollinger setups
✅ No forced trades—only high-probability moves
🚀 Final Takeaway?
The breakout is here, the target is set, and the plan is clear. Now, it’s time to let the market do its thing and wait for the move to play out.
---
Fun Fact
📢 Did you know? In 2018, Amazon briefly became a $1 trillion company—but it only stayed there for a few hours before dropping back below the threshold.
💡 The Lesson? Even the biggest breakouts can be short-lived—just because a stock (or index) makes a new high doesn’t mean it will stay there forever. Always have a plan—targets and hedge triggers matter.

TONUSD Daily Price chartLooking at this Toncoin (TON/USD) chart, I see a well-defined ascending channel pattern that's been forming since early 2022, with several key technical elements worth noting:
Channel Structure & Current Position
Price is trading at $3.5686 (+0.67%)
TON is currently near the lower boundary of the ascending channel (marked as "Buy Zone" at ~$2.6)
RSI (14) is at 27.43, indicating oversold conditions
Key Price Points
Current support at the lower channel line (~$2.6-2.7 range)
Strong horizontal support around $2.7155
Resistance zone at $12-13 (marked in blue rectangle)
In mid-term this setup suggests a potential buying opportunity with:
Entry Zone: $2.6-2.8 area (where the price meets the lower channel boundary)
Stop Loss: Below $2.2 (approximately 15% below entry to account for volatility)
Profit Targets:
First target: $6.0 (previous resistance level)
Second target: $9.0 (previous high marked as point 3)
Maximum target: $12-13 zone (upper channel projection)
in long temm in 2-3 yaers later i see a bright future for TON's holder!!
Please tell me what you think about the future of TON.
All the best

SPX In Limbo - Which way will it break?SPX in Limbo – Will It Break Up or Down? | SPX Market Analysis 19 Feb 2025
Still waiting. Yep, that’s where we are.
The market is about as exciting as watching paint dry, but this is not the time to get impatient. As much as I’d love to jump into a trade just to feel productive, I know better—waiting for the right entry beats chasing the wrong one.
Let’s break it down while we sip on tea and pretend to be Zen masters of market patience.
---
SPX Deeper Dive Analysis:
Why Patience is Everything in Trading
There’s an old trading rule that never fails—the market will always move… eventually. But right now, it’s in one of those frustrating, indecisive moods where:
Nothing is confirming (so forcing a trade is a bad idea)
It’s stuck between two key levels (meaning we wait for the breakout or breakdown)
Volume is sluggish (which means false moves are more likely)
Still Watching Two Scenarios
☑ Scenario #1 – The Bullish Breakout Entry
Needs price to confirm above key resistance
No fakeouts—just clean, strong momentum
Only then do I consider a bullish trade
☑ Scenario #2 – The Bearish Reversal Entry
Needs clear rejection at resistance
No weak, choppy movements—just a solid confirmation
Only then do I take a bearish setup
Why Forcing Trades is a Losing Game
Let’s be honest—waiting is boring. But do you know what’s worse? Jumping into a trade just because you're impatient… and then watching it immediately go against you.
Every trader, at some point, has thought:
"It looks like it’s going to move, maybe I should enter early…" (Nope.)
"I don’t want to miss the move…" (You won’t—if you follow the plan.)
"Other traders are jumping in—should I?" (Nope. They’re probably wrong.)
The right trade at the wrong time is still the wrong trade.
What’s Next?
✅ Stay patient—the market will tip its hand soon enough
✅ Wait for clear confirmation—not “I think this might be it” confirmation
✅ Don’t trade out of boredom—trade because the setup is 100% valid
📌 Final Takeaway? Patience = profit. I’m still waiting, tea in hand, and when the market finally makes its move, I’ll be ready.
---
Fun Fact
📢 Did you know?
The stock market used to take 5 months to process a trade before the 1970s. Now? It happens in milliseconds—but traders still struggle to wait a few hours for the right setup.
💡 The Lesson?
Patience has always been a trader’s best tool. Some things never change.

Fundamentals support $11-13 range- NYSE:PAGS is growing EPS high single digit to low double digits.
- I'm not expecting much from this company. Fundamentally, it's cheap enough not to ignore.
Year | 2025 | 2026 | 2027
EPS | 1.18 | 1.32 | 1.62 |
EPS growth | 2.62% | 11.77% | 22.08%
Fair forward p/e for year 2025 -> 5
Fair stock price => 1.18 x 5 ~ $6
Fair forward p/e for year 2026 for 11.77% eps growth -> 10
Fair stock price => 1.32 x 10 ~ $13.2
Fair forward p/e for year 2027 for 22.08% eps growth -> 20
Fair stock price => 1.62 x 20 ~ $32.4

$GRAB - One of the best DCA opportunity! PT : $7-10- NASDAQ:GRAB is no brainer buy sub $5 and ride it till $7-10
- It's like NYSE:UBER of south east asia.
- If you believe that in upcoming years, income per capita in south east asia will grow then you are investing in the right company!
- This stock provide me diversification outside of US and allows me to capture the network effect of growing economy be it via inflation or actual income per capita.
- NASDAQ:GRAB is blue chip stock for south east asians. Their fund managers, public will likely add it in their retirement savings account.
- Passive inflows alone will lift the market cap of the company.
- NASDAQ:GRAB will be double digits. It's just matter of when!
- This NASDAQ:GRAB isn't a trade for me but an investment. I don't care if it crashes by 30-50% or go up by 30-50% in next 1-2 years.
- I'm looking at a multibagger investment and aim for at least 4-5x from current level.
