IOST Token is showing strength and uptrend!Great indicators showing strength for iOST Token! it is a good time to buy in.
Good luck.
Iost

IOST Regain 300 level? IOST has loads of resistance against it but could easily cut above 300 sat level should the opportunity present itself. If denied, supports are laid out below as ideally the market has bottomed overall in this 2018 downtrend.


There is a possibility of the beginning an uptrend in IOSTETHTechnical analysis:
. IOSTOKEN/ETHEREUM is in a range bound and the beginning of uptrend is expected.
. The price is above the 21-Day WEMA which acts as a dynamic above.
. The RSI is at 52.
. While the price downtrend in the Daily chart is not broken, bearish wave in price would continue .
Trading suggestion:
. There is a possibility of temporary retracement to suggested support zone (0.000047 to 0.000042). if so, traders can set orders based on Price Action and expect to reach short-term targets.
Beginning of entry zone (0.000047)
Ending of entry zone (0.000042)
Entry signal:
Signal to enter the market occurs when the price comes to "Buy zone" then forms one of the reversal patterns, whether "Bullish Engulfing" , "Hammer" or "Valley" in other words,
NO entry signal when the price comes to the zone BUT after any of the reversal patterns is formed in the zone.
To learn more about "Entry signal" and the special version of our "Price Action" strategy FOLLOW our lessons:
Take Profits:
TP1= @ 0.000054
TP2= @ 0.000060
TP3= @ 0.000066
TP4= @ 0.000071
TP5= @ 0.000079
TP6= @ 0.000096
TP7= Free

There is a possibility of the beginning an uptrend in IOSTBTCTechnical analysis:
. IOStoken/Bitcoin is in a downtrend and the beginning of uptrend is expected.
. The price is below the 21-Day WEMA which acts as a dynamic resistance.
. The RSI is at 41.
. While the RSI and the price downtrend in the Daily chart are not broken, bearish wave in price would continue .
Trading suggestion:
. There is a possibility of temporary retracement to suggested support zone (0.00000200 to 0.00000165). if so, traders can set orders based on Price Action and expect to reach short-term targets.
Beginning of entry zone (0.00000200)
Ending of entry zone (0.00000165)
Entry signal:
Signal to enter the market occurs when the price comes to "Buy zone" then forms one of the reversal patterns, whether "Bullish Engulfing" , "Hammer" or "Valley" in other words,
NO entry signal when the price comes to the zone BUT after any of the reversal patterns is formed in the zone.
To learn more about "Entry signal" and the special version of our "Price Action" strategy FOLLOW our lessons:
Take Profits:
TP1= @ 0.00000255
TP2= @ 0.00000295
TP3= @ 0.00000318
TP4= @ 0.00000356
TP5= @ 0.00000421
TP6= @ 0.00000486
TP7= @ 0.00000614
TP8= @ 0.00000769
TP9= Free

There is another opportunity to buy in IOSTBTCTechnical analysis:
. IOStoken/Bitcoin is in a range bound and the beginning of uptrend is expected.
. The price is below the 21-Day WEMA which acts as a dynamic resistance.
. The RSI is at 39.
Trading suggestion:
. Price is in the support zone (0.00000302 to 0.00000278), traders can set orders based on Daily-Trading-Opportunities and expect to reach short-term targets.
Beginning of entry zone (0.00000302)
Ending of entry zone (0.00000278)
Entry signal:
Signal to enter the market occurs when the price comes to "Buy zone" then forms one of the reversal patterns, whether "Bullish Engulfing" , "Hammer" or "Valley" in other words,
NO entry signal when the price comes to the zone BUT after any of the reversal patterns is formed in the zone.
To learn more about "Entry signal" and the special version of our "Price Action" strategy FOLLOW our lessons:
Take Profits:
TP1= @ 0.00000356
TP2= @ 0.00000374
TP3= @ 0.00000402
TP4= @ 0.00000421
TP5= @ 0.00000486
TP6= @ 0.00000592
TP7= @ 0.00000764
TP8= Free

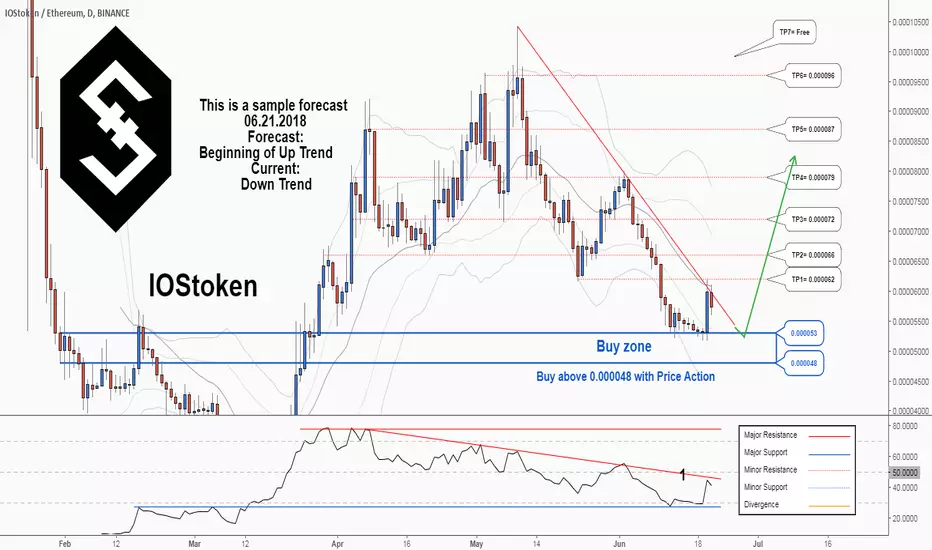
There is a trading opportunity to buy in IOSTETHTechnical analysis:
. IOSTOKEN/ETHEREUM is in a downtrend and beginning of uptrend is expected.
. The price is below the 21-Day WEMA which acts as a dynamic resistance.
. The RSI is at 40.
. While the RSI downtrend #1 and the price downtrend in daily chart is not broken, bearish wave in price would continue.
Trading suggestion:
. The price is in a downtrend and we forecast the uptrend would begin.
. There is a possibility of temporary retracement to suggested support zone (0.000053 to 0.000048). if so, traders can set orders based on Price Action and expect to reach short-term targets.
Beginning of entry zone (0.000053)
Ending of entry zone (0.000048)
Entry signal:
Signal to enter the market occurs when the price comes to "Buy zone" then forms one of the reversal patterns, whether "Bullish Engulfing" , "Hammer" or "Valley" in other words,
NO entry signal when the price comes to the zone BUT after any of reversal patterns is formed in the zone.
To learn more about "Entry signal" and the special version of our "Price Action" strategy FOLLOW our lessons:
Take Profits:
TP1= @ 0.000062
TP2= @ 0.000066
TP3= @ 0.000072
TP4= @ 0.000079
TP5= @ 0.000087
TP6= @ 0.000096
TP7= Free
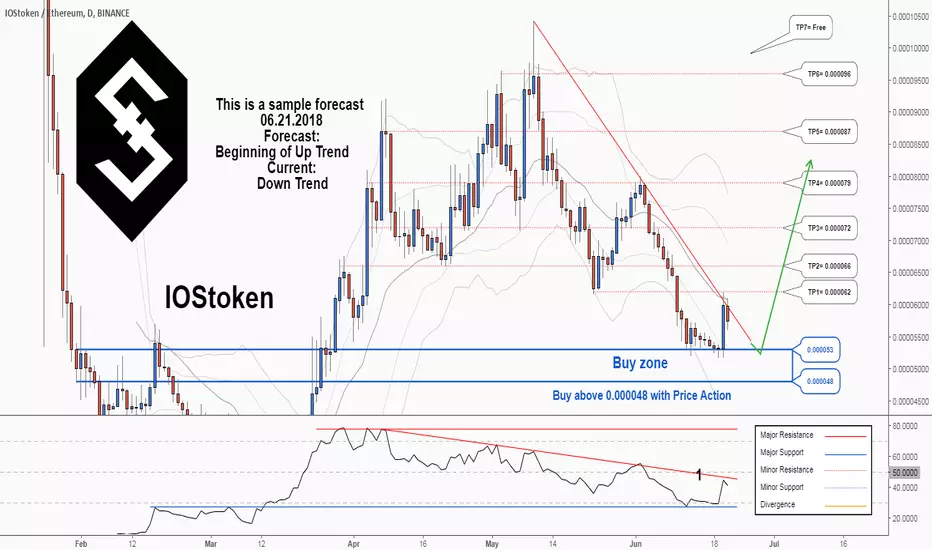
There is a trading opportunity to buy in IOSTBTCTechnical analysis:
. IOStoken/BITCOIN is in a downtrend and the beginning of uptrend is expected.
. The price is below the 21-Day WEMA which acts as a dynamic resistance.
. The RSI is at 31.
. While the price downtrend in the Daily chart and the RSI (#1) is not broken, bearish wave in price would continue.
Trading suggestion:
. There is a possibility of temporary retracement to suggested support zone (0.00000315 to 0.00000294). if so, traders can set orders based on Price Action and expect to reach short-term targets.
Beginning of entry zone (0.00000315)
Ending of entry zone (0.00000294)
Entry signal:
Signal to enter the market occurs when the price comes to "Buy zone" then forms one of the reversal patterns, whether "Bullish Engulfing" , "Hammer" or "Valley" in other words,
NO entry signal when the price comes to the zone BUT after any of reversal patterns is formed in the zone.
To learn more about "Entry signal" and the special version of our "Price Action" strategy FOLLOW our lessons:
Take Profits:
TP1= @ 0.00000356
TP2= @ 0.00000374
TP3= @ 0.00000402
TP4= @ 0.00000421
TP5= @ 0.00000486
TP6= @ 0.00000592
TP7= @ 0.00000764
TP8= Free

There is a possibility for the beginning of uptrend in IOSTUSDTechnical analysis:
. ISIMPLETOKEN/DOLLAR is in a downtrend and beginning of uptrend is expected.
. The price is below the 21-Day WEMA which acts as a dynamic resistance.
. The RSI is at 31.
. While the RSI downtrend #1 and the price downtrend in daily chart is not broken, bearish wave in price would continue.
Trading suggestion:
. The price is in a downtrend and we forecast the uptrend would begin.
. There is a possibility of temporary retracement to suggested support zone (0.0195 to 0.0135). if so, traders can set orders based on Price Action and expect to reach short-term targets.
Beginning of entry zone (0.0195)
Ending of entry zone (0.0135)
Entry signal:
Signal to enter the market occurs when the price comes to "Buy zone" then forms one of the reversal patterns, whether "Bullish Engulfing" , "Hammer" or "Valley" in other words,
NO entry signal when the price comes to the zone BUT after any of reversal patterns is formed in the zone.
To learn more about "Entry signal" and the special version of our "Price Action" strategy FOLLOW our lessons:
Take Profits:
TP1= @ 0.0257
TP2= @ 0.0308
TP3= @ 0.0352
TP4= @ 0.0397
TP5= @ 0.0475
TP6= @ 0.0553
TP7= @ 0.0700
TP8= Free

IOSTIOST/BTC AB = CD , Elliott Triangle Waves, falling wedge with testing after brokeout.
Targets
0.00000475
0.00000570
0.00000760

200% Potential Iost? Iost is in this large falling wedge. It's only a matter of time until we see a break out.
There's two targets. The first target assumes a continuation of a bear market while the second target is cryptocurrency as whole rebounding into a bull market.
MACD showing bullish divergence
As of right now price was rejected by the 21 ema on the daily chart but my bias is to the upside once we see a breakout
*second target is a 1.618 extension of the first large run up

A trading opportunity to buy in IOSTUSDTechnical analysis:
. ISIMPLETOKEN/DOLLAR is in a range bound and the beginning of uptrend is expected.
. The price is above the 21-Day WEMA which acts as a dynamic support.
. The RSI is at 48.
. The RSI and the price downtrend in the daily chart are broken, so the probability of the beginning of uptrend is increased.
Trading suggestion:
. There is still a possibility of temporary retracement to suggested support zone (0.0195 to 0.0135). if so, traders can set orders based on Price Action and expect to reach short-term targets.
Beginning of entry zone (0.0195)
Ending of entry zone (0.0135))
Entry signal:
Signal to enter the market occurs when the price comes to "Buy zone" then forms one of the reversal patterns, whether "Bullish Engulfing" , "Hammer" or "Valley" in other words,
NO entry signal when the price comes to the zone BUT after any of reversal patterns is formed in the zone.
To learn more about "Entry signal" and the special version of our "Price Action" strategy FOLLOW our lessons:
Take Profits:
TP1= @ 0.0257
TP2= @ 0.0308
TP3= @ 0.0352
TP4= @ 0.0397
TP5= @ 0.0475
TP6= @ 0.0553
TP7= @ 0.0700
TP8= Free


IOST entry opportunityIOST looks like its setting up for a nice 3-5% trade.
I will be watching the 3 and 5 minute MAC D for a buy signal and will update if I pull the trigger.
I will be posting all of my trades on here from now on so follow me if you are intereseted in seeing more of my day trades.

#iostoken Daily chart+Fractal - Will the bulls make their move?Looking back at #iost aka #iostoken and once again, another chart that looks like it's forming a possible bottom. Added a fractal to better explain what I expect to see in the near weeks / months

Bullish Divergence IOSTBTCIOST is showing three divergences, it is bullish on EFI, MACD-H and RSI
I Think the first target is realistic, but I have set an alert when it is about to hit the price around the EMA.
I have to see if I get out, or look for strength and see the price hit the +1 ATR
Entry: 0.00000365
Target 0.00000374
Target 2 0.00000381
SL: 0.00000360
Target 1 R/R Ratio: 1.8
Target 2 R/R Ratio: 1:3
