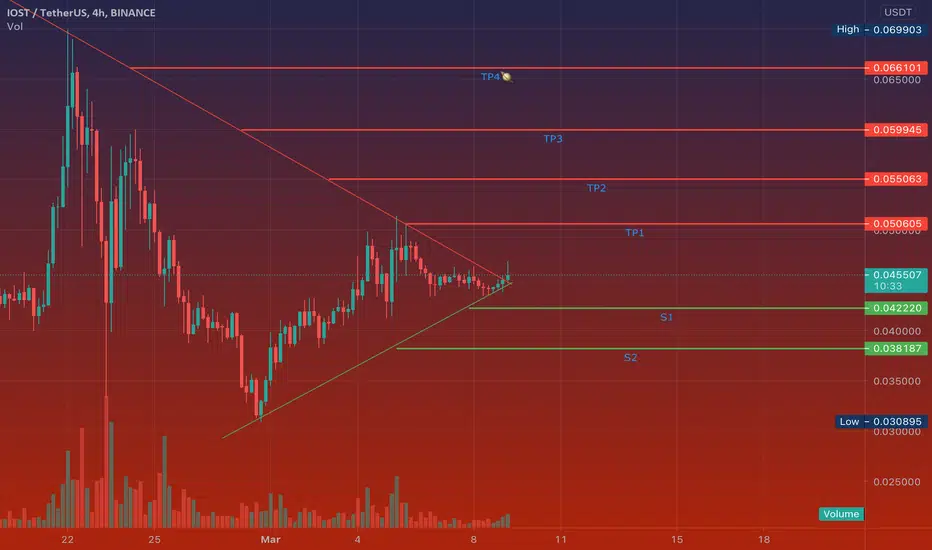
💡IOST: BUY Trade🚀🚀🚀🚀🚀🚀 #ALTSEASON2021📈#IOSTUSDT
➡️Entry: 0.046900$
🎯Target 1: 0.055300$
🎯Target 2: 0.064500$
🎯Target 3: OPEN
IOSTUSDT

IOST HİT & RUNIf it breaks 0.506, 0.540 comes.
Breakdown should be expected..
Turkish explanation:
Eğer 0.506 kırarsa, 0.540 gelir.
Kırılım beklenmeli..


IOST Another Pump Will ComingAs we know, today is altcoin day
After breaking falling wedge pattern & FIB 50%, IOST is now facing strong resistance at 0.0522 Blue Line
If price cannot break this resistance, price will go down to support at 0.0468 Green Line or facing again 38.2% FIB
Yellow area is best area to buy
Our taget at 100% & 161.8% FIB


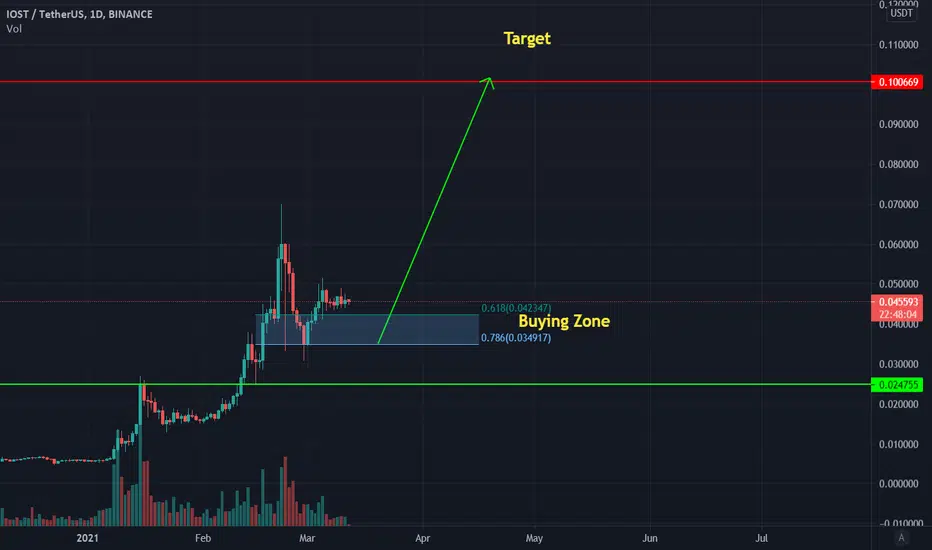
Update on IOST Price TargetsPossible Price Targets in the next month
$0.07
$0.09
$0.15 - only if the pattern repeats.

$IOST ConsolidationNot much movement from $IOST this one has been consolidating, currently breaking out this is definitely one to watch in the coming days.....


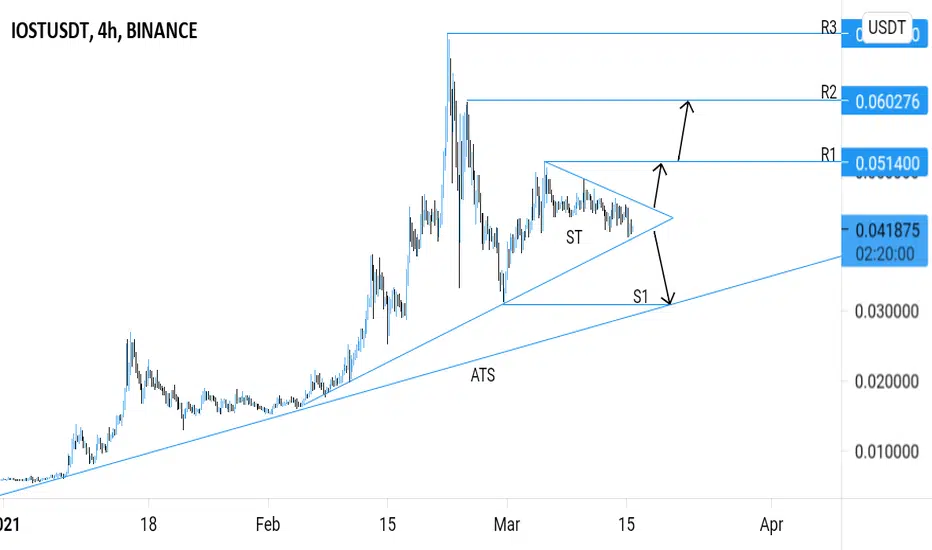
IOSTUSDT (IOST) - POSSIBLE PRICE ACTIONS ANALYSIS 🔎
- IOSTUSDT is consolidating in the symmetrical triangle (ST) pattern.
- A relatively big move is imminent.
POSSIBLE PRICE ACTIONS
- Uptrend ⬆️: breakout above the symmetrical triangle's inclined resistance.
- Downtrend ⬇️: breakdown below the symmetrical triangle's inclined support.
TARGETS 🎯
- Uptrend ⬆️: Horizontal resistance levels (R1, R2).
- Downtrend ⬇️: Horizontal support level (S1), Ascending trendline support (ATS)
IOSTUSDT - accumulation in the trianglestop loss at the base of the figure.
entry now and you can add a position after the breakout. (If you are experienced).
The take profit was shown on the chart.
Preparing useful content for beginners
You will learn the best place where we can trade this instrument at low risk.
Write in the comments all your questions and instruments analysis of which you want to see.
Friends, push the like button, write a comment, and share with your mates - that would be the best THANK YOU.
P.S. I personally will open entry if the price will show it according to my strategy.
Always make your analysis before a trade

IOST targeting $0.15If IOST can repeat it's recent price history it's targeting $0.15
Based on swing length and percentage gain. I've increased the number of days by 6 like the previous delay.
I've also decreased the percentage gain by 50% like the previous decrease.

IOST - Bull Run Move - get readyIOST is really cheap and can go really high in this bull run.
We have discussed this in our today's video.
IOST USDT IN N=BINANCE SPOT FOR LONG8D
BE CAREFUL RISK / REWARD RATIO WITH FIRST TAKE PROFIT IS 1.5
FOLLOW AND LIKE MY ACCOUNT AND POSTS FOR MORE ANALYSIS !!


IOSTUSDTHello to you all. Mars Signals team wishes you high profits at all times.
The price has broken out of the triangle and has also made its pull-back. Now it is ready to go up toward its targets. But you need to keep an eye on Bitcoin too before deciding to make a move on IOST.
Warning: This is just a suggestion to you and we do not guarantee profits.
Wish you luck!

IOST/USDT - Ready to go Up 🚀Hello everyone, analyzed the IOST/ USDT pair
The price made a correction along the ABC waves
At the moment, the price is trading above the support line (white line)
Looking at a smaller timeframe, you can see an inverted head and shoulders.
Price Support Zone: $ 0.35-0.39
Also, the price is now higher than the previous resistance level, from which there was an uptrend
"This is just my opinion, trade with your trading system."
"Have a nice day everyone and come."


#IOST has broken through the ascending triangle#IOST has broken through the ascending triangle + retested it from above! Buying before we break through the descending resistance!

🆓IOST/USDT Analysis (3/3) #IOST $IOSTThe buying force is coming into IOST but after the recent dump, it will take us a long time to make new rally.
I think it will come back to 0.05$ zone, this zone is quite strong and the selling pressure still exist here.
📅NEWS
👉Mar 4 : Airdrop
👉Aug 1 : Monthly Airdrop Ends
📈BUY
-Buy: 0.039-0.041$. SL if B
-Buy: 0.049-0.051$ if A. SL if B
📉SELL
-Sell: 0.049-0.051$. SL if A
-Sell: 0.060-0.063$. SL if A
♻️BACK-UP
-Sell: 0.039-0.041$ if B. SL if A
-Buy: 0.029-0.031$. SL if B
❓Details
Condition A : "If 1D candle closes ABOVE this zone"
Condition B : "If 1D candle closes BELOW this zone"

Trade idea for IOSTUSDTIOSDT may fall down to its support area, if BTC correction continues. But we may see some bounces in the meantime.

