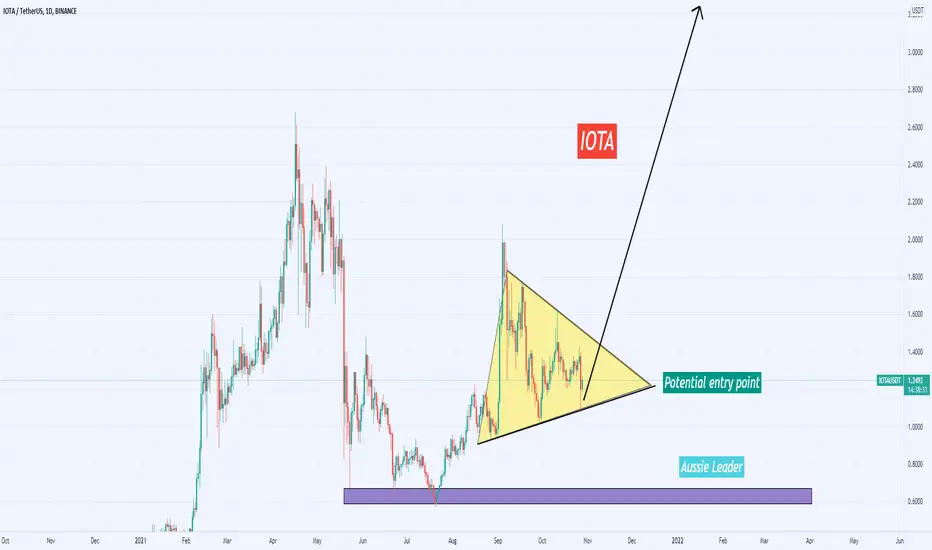
IOTA Accumulation phaseIt's seems like the same pattern between July-August.
Probably another accumulation zone, target 2.5 - 3.0
IOTA

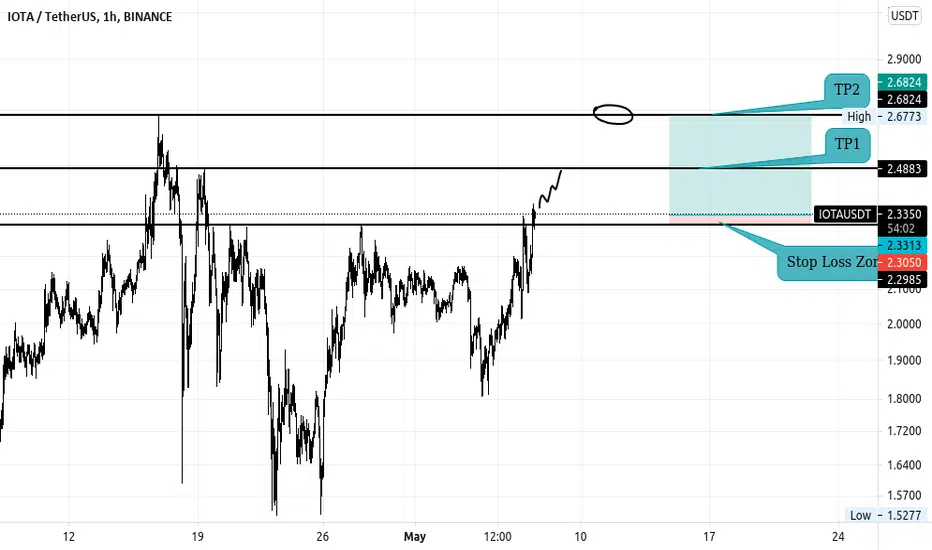
IOTAUSDR - Entry timingBINANCE:IOTAUSDT
4H trend chart
-
IOTA has been consolidating and converging.
Now, it is trying to take out the upper downtrend line, but we shall be aware of fake-out in 4H chart.
If price can break out the downtrend line around here, trading strategy as below.
-
Profit Targets:
a) 1.62----Blue horizontal ray
a) 1.7664---Fib(1)
b) 1.9686~2.0504----Fib(1.272~1.382)
Stop losses:
a) 1.366-----Red horizontal ray
-
If you like this analysis, smash the "like button" and leave a comment below to share your thoughts
or let me know what crypto you want to see!
Trading is a reflection of yourself. Learn more daily and be ready for every opportunity.
Have a nice trading!

IOTAUSDT daily analysisIOTA has been in the accumulation zone for a while and is now ready for a nice bull run.
I believe that it can reach a little higher than its maximum of the last few months, reaching $1.85
Target 1: $1.54
Target 2: $1.70
Target 3: $1.85

IOTA's path to 15$ The similarities between the current events and those from the end of 2020 are remarkable.
In both cases, a new all-time high was reached shortly before and the IOTA price corrected strongly.
As a result, the altcoin's price went through a prolonged sideways movement (an accumulation phase).
Volume increased significantly in both breakout moves.
Both breakout moves stopped shortly before the previous all-time high.
Then and now, the daily RSI for the breakout move showed a value of about 80 (78/82).
For better comparability, I have adjusted the size of the price movement (in the light blue rectangle) to the recent one.
If the events from late 2020 were to repeat, adjusted to the current situation, then this would result in an IOTA forecast of about $15.72 . This price target would be reached around the end of January/early February 2022. But I would not recommand to get hang up on the time prediction if any of this should be correct.
Disclaimer: This analysis is an excerpt from the IOTA forecast on the German crypto blog Bitcoin-Bude

IOTA compression is coming to an end 🚀We are probably watching a historic breakout for IOTA !
IOTA can hit it's first target within a few candles.
Like if you Liked :)

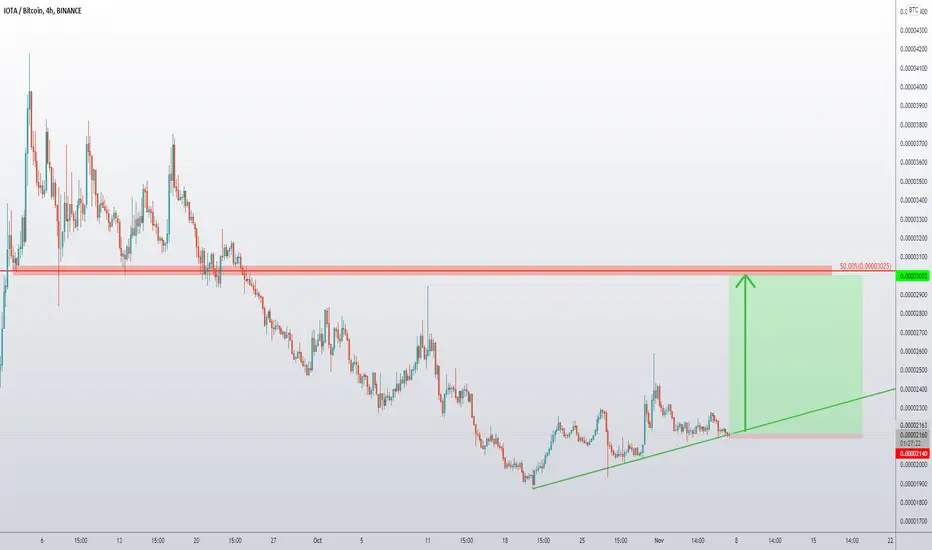
IOTA/BTC is just getting started - next coin to be pumpedI love the buy setup for IOTA against the USDT and against the BTC. This goes to show, that the massive uptrend is about to start. Although if the price will produce a new lower low, this setup will be invalidated.
IOTA/USDT Ready for $5 ( 240% ) from here.?#IOTA/USDT TA Update:-
$IOTA currently trading at $1.34
If #IOTA breaks $1.60 then we can sew $IOTA Target $5 (240% )
Entry..?
I am buying some $IOTA here and if break down Support 1 then next Wntry will be $0.8-$0.9
Targets:- $2/$2.5/$4/$5
Stop Loss:- Will update

IOTA/USDT QUICK SCALP TRADE!Hello everyone, if you like the idea, do not forget to support with a like and follow.
IOTA looks good here for quick scalping. It already broke out from the falling wedge and retest is also done. So I'm buying some here and adding more in the dips.
Entry range:- $1.356-$1.366
Target1:- $1.392
Target2:- $1.424
Target3:- $1.462
Target4:- $1.498
SL:- $1.329
Leverage:- 5x
If you like this idea then do support it with like and follow.
Also, share your views in the comment section.
This isn't financial advice. DYOR before investing.
Thank You!

IOTA Possible BreakoutIOTA is a crypto with strong fundamentals that offer real differences from the standard blockchain tech. IOTA has been trading solidly in a Bullish channel and reaching the end of it's flag pattern. The RSI is on the rise from 40. If it continues to hold this bullish pattern then it has potential to double.
Stack them sats!
(This is not financial advice and I'm not a financial advisor. This is just for entertainment purposes only. Always Do Your Own Research (DYOR))

🟡IOTA has formed an ascending Triangle...Hi every One
IOTA / TETHERUS
IOTA has formed an ascending Triangle which has not done a Break out Yet! the Price can Increase as much as the Measured Price movement (AB=CD). there is also a Crab pattern visible on the chart as well ! This Crab pattern is also reliable since the EX Ret=1.618. Now It's time to Reach 2.20$ because The CD line of Crab pattern Ends There! we just need to wait for a Break out to happen.
🔵Summery:
-IOTA is in an ascending Triangle
-(AB=CD)
-Crab pattern is reliable Too (Ex Ret=1.618)
-possible Target at 2.20$!
💎Traders, if you liked this idea or have your opinion on it, write in the comments, We will be glad.
Things can change...
The markets are always changing and even with all these signals, the market changes tend to be strong and fast!!
Thank you for seeing idea .
Have a nice day and Good luck

IOTA/USDT LONG TERM ANALYSISIOTA registered a downward trend after seeing ATH value. However, when we look at the formations that may occur and the general situation of the market, it is predicted that it will move upwards. This situation is presented to you by examining the triangle formation, cup-handle formation and RSI-EMA integrated indicator.

IOTA is next to shoot by over 40%IOTA clearly is showing strong bullish domination, because the price bounced off the support and broke above the downtrend trendline. It is likely that from today-tomorrow there will be a strong and fast rally, potentially taking the price up to 88.6% Fibs. Such a move equals 43.43% growth!

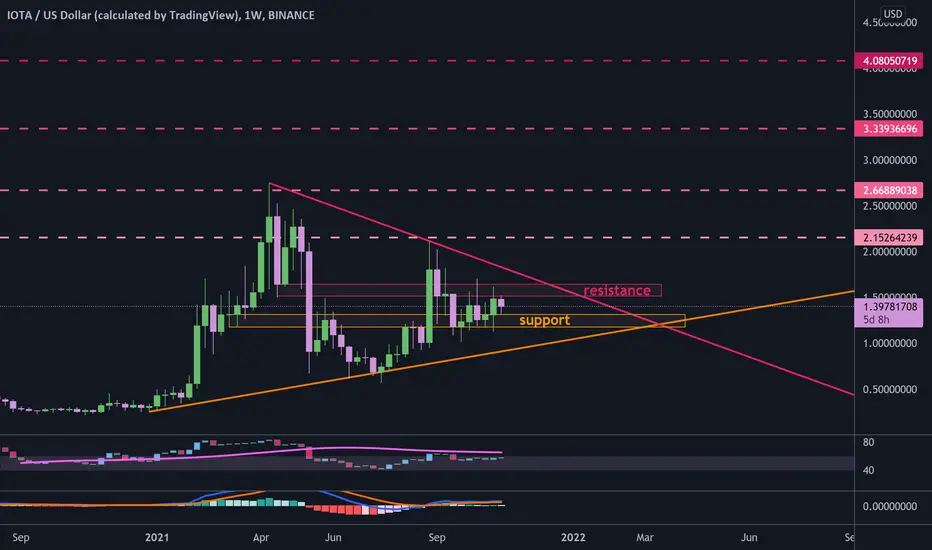
IOTA triangle then cup & handle to $4#IOTAUSD
$IOTA is trading inside a triangle in weekly time frame, if price break down from support zone then the long erm ascending support will hold it.
and if price success to break out from resistance zone and upper line of triangle, target can be around $2.6.
also there is a cup and handle pattern in monthly time frame that can lead price to touch $4.


IOTAUSDt trade have potential entry positionIOTAUSDt trade can boost towards 3X target. At this moment, it is showing good entry point to get in. There is strong support around purple bar. Trade will be in the bull trend until it remains above purple bar.
Double 'cup and handle' formation on IOTAWith optimistic glasses on, you can view a double 'cup and handle' configuration for IOTA that could get us towards 3$.

IOTA/BTC pair - Elliott corrective waves completedIn my opinion we have completed wave C of the Elliott waves theory aligning with the 2k sats support. Volume is dominated by bulls and once fundamental news support the trend reversal, we will see how far wave 1 can go; potentially leading to a break-out of the 4k sats resistance.
Good luck with your trades! Do not consider this as financial advice.

IOTAUSDT | Long/BuyThe chart show us that correction ABC wave 2 is over and then continues to make impulsive wave 3 which is the longest wave. But if the chart going down to bellow 1.2047 that mean the wave 2 still continues. use 1.2045 level as stop loss.

LTC - Seriously undervalued.Firstly let's remember that this is crypto market. There's no such thing as delusional assumptions / impossible analysis. Things are less or more probable. This move happened in the past, regardless it's behemoth proportions - no one can deny it. If this would happen again... BTC profits would be equally ridiculous to this being even a possibility. I see here two significant resistance levels which in turn would mark my target areas where I would normally realize 33% profits - I'm rather long time investor, not focusing on hourly candles at all.
Call me mad - I'll wait.
Got some more LTC here.

ALTS look primed for a move vs BTCBelow a list of ALTS vs BTC charts that look ready for a move.
Most of these ALTS have been dormant vs BTC and for the past 2 years have either grinded slowly lower or have been going sideways.
All these ALTS are now sitting at key levels and some are displaying interesting RSI bullish divergences on the weeklies.
Furthermore volatility has been extremely low over the past 2 years (as displayed by the ATR indicator).
Long periods of low volatility precede periods of high volatility and therefore we can expect some big moves in the near future.
The risk reward at these levels is very favorable for LONG trade setups as long as your happy to be patient.
