IOTA

Buy the breakout CONFIRMATIONPatience... allow for the 4H candle to close ABOVE the red resistance, than purchase confirmation which closes also above.
Things to be aware off - failed confirmation might possibly lead to Wyckoff Accumulation Schematics.
Further idea development will be described as scenario unfolds...

KEEP YOUR EYE ON IOTA (IOTA/USDT)!Hey everyone, hope all is well.
Please note, this prediction could still go either way. If Bitcoin decides to collapse, so does this coin - so trade with caution.
Best of luck!
Love, peace, Seb.

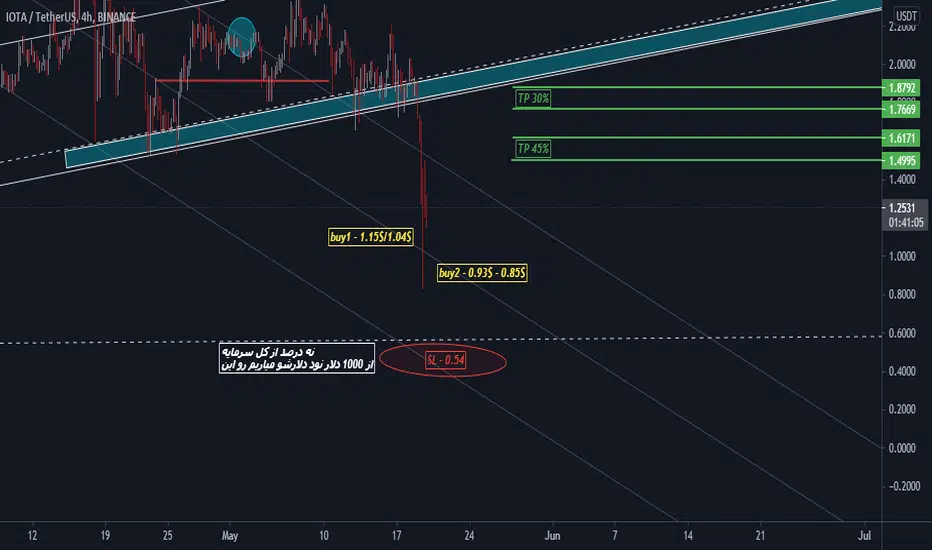
IOTA Sell a break.IOTAUSDT - Intraday - We look to Sell a break of 1.084 (stop at 1.144)
Price action has formed a bearish ending wedge formation.
Daily signals are mildly bearish.
Trend line resistance is located at 1.200.
However, with the intraday chart now highlighting lower highs we are possibly forming a descending triangle pattern.
Our profit targets will be 0.931 and 0.888
Resistance: 1.140 / 1.220 / 1.300
Support: 1.050 / 0.980 / 0.920

IOTA formed big Cypher for powerful bullish reversal rallyHey dear patrons, hope you are well, and welcome to the new update on IOTA (MIOTA) coin.
The previous bullish Cypher move of IOTA produced very big bullish rally:
Now this time on the weekly time frame chart, the price action of IOTA has formed another bullish Cypher pattern. After entering the buying zone the priceline has moved above the potential reversal zone area but it may give us another chance to catch it from this buying zone. I am expecting a big bullish reversal move from this Cypher pattern.
Buy and sell targets:
Buy between: $0.8888 to $0.5214
Sell between: $1.17 to $1.87
Stop loss:
The maximum extent of potential reversal zone $0.5214 can be used as stop loss.
Possible profit and loss ratio:
As per the above targets, this trade has a big profit possibility of 250%, and the big loss possibility is 41%.
Note: Above idea is for educational purpose only. It is advised to diversify and strictly follow the stop loss, and don't get stuck with trade.

IOTA/USDT Binance (hr) Doward pressure from BTC. I see the price action testing around 90-72 CENTS. Possible head and shoulders pattern. Not financial advice. DYOR.

IOTA (MIOTA) - May 29Hello?
Welcome, traders.
By "following", you can always get new information quickly.
Please also click "Like".
Have a good day.
-------------------------------------
(IOTAUSD 1W Chart)
(1D chart)
The 0.70762957-1.29319710 section is an important section and it is important to get support as it rises.
To break away from the short-term downtrend line, we need to see if it moves above the 1.31143737 point by around June 2nd.
If support is found at the 1.31143737 point, it is expected to turn into an uptrend.
As I said in the BTC price chart, most charts currently do not form a proper sideways zone.
Under these circumstances, if the price of IOTA rises above the 1.31143737 point and finds support, I think it is likely to move up quickly.
An upward break above the 1.71207698-1.91239677 zone is most important to continue the uptrend.
If you fall from the 0.70762957 point, you can touch the 0.10951858 point, so you need to trade carefully.
-------------------------------------
(IOTABTC 1W chart)
It remains to be seen if it can rise above the critical point of 3725 Satoshi.
(1D chart)
It remains to be seen if the 2667 satoshi-2889 satoshi section can support and rise.
If it falls from the 2667 Satoshi point, Stop Loss is required to preserve profit and loss.
However, you need to trade carefully because you can touch the 2489 Satoshi-2566 Satoshi section and rise.
In order to turn into an uptrend, it needs to rise above the 3208 Satoshi point and find support.
--------------------------------------
It is advisable to trade at your average unit price.
This is because if the price is below your average unit price whether the price trend is in an uptrend or in a downtrend, there is a high possibility that you will not be able to get a big profit due to psychological burden.
The center of all trading starts with the average unit price at which you start trading.
If you ignore this, you may be trading in the wrong direction.
Therefore, it is important to find a way to lower the average unit price and adjust the proportion of the investment, so that the funds that ultimately correspond to the profits can regenerate the profits.
-------------------------------------------------- -----------------------------------------------------
** All indicators are lagging indicators.
Therefore, it is important to be aware that the indicator moves accordingly with the movement of price and volume.
However, for the sake of convenience, we are talking in reverse for the interpretation of the indicator.
** The wRSI_SR indicator is an indicator created by adding settings and options to the existing Stochastic RSI indicator.
Therefore, the interpretation is the same as the traditional Stochastic RSI indicator. (K, D line -> R, S line)
** The OBV indicator was re-created by applying a formula to the DepthHouse Trading indicator, an indicator disclosed by oh92. (Thanks for this.)
** See support, resistance, and abbreviation points.
** Support or resistance is based on the closing price of the 1D chart.
** All descriptions are for reference only and do not guarantee a profit or loss in investment.
Explanation of abbreviations displayed in the chart
R: A point or section of resistance that requires a response to preserve profits.
S-L: Stop Loss point or section
S: A point or section where you can buy to make a profit as a support point or section.
(Short-term Stop Loss can be said to be a point where profit and loss can be preserved or additional entry can be made through split trading. It is a short-term investment perspective.)
GAP refers to the difference in prices that occurred when the stock market, CME, and BAKKT exchanges were closed because they do not trade 24 hours a day.
G1 : Closing price when closed
G2: Opening price
(Example) Gap (G1-G2)

IOTA/BTC - higher low & V shape recovery?Everywhere is blood on the streets, but it seems like it cannot get worse than that. We have a strong bullish hidden divergence playing out with a higher low while RSI is at 34 for yesterday. MACD could converge from here again. There is a high chance that we do climb up from here without seeing these lows again. The question is how quickly we can reach our previous high again.
Aiming to reach the 3600 Sats mark (Mid Band BB) again.

IOTA - RSI low, extreme fear offers opportunityThe FUD around crypto is hitting hard. The market has not been this oversold (RSI on the daily) since March 2020. 75% price loss from the peak is a pain for people who came in late and I hope this will not scare away newcomers. However, for others this is a great opportunity to enter the market who before argued that prices were too high.
We broke a critical support at 1.70 and from there it was a free fall to the current support at around 0.68 and currently we are trading at 0.76. The crypto market is ruthless and we might see another leg down, but I also see a great recovery coming as history has it proven to us many times. It is interesting that less volume has moved the price much more down then it did beginning of Feb on the way up.
One thing has not changed at all during this sell-off - the technology.
This is no financial advice.
Happy trading!

Every CUP needs HANDLE, just like HEAD needs SHOULDERS..Be the innovator, skip trading - remember your LONG term goals, and passion just from a few weeks ago!
Dimond hands, regards price action...

IOTABTC - confirmation of 21 MONTHLY EMA - Bullish!The longer the range, the stronger the support/resistance. This one is of an epic proportion. Short moves will get you confused. Remember, why do you invest in IOTA in the first place. If this. monthly holds, you might. look deeper into fundamentals ;)


IOTA - TWO SCENARIOSI'm now scalping long up to $2.25 - further price action will be observed in this topic.
Currently locked in medium term bullish pennant, price will most likely re-test both of the resistance/support levels number of times until breaking out.
Two scenarios presented in green and red.
If interested in my point of view, comment and follow the idea.
#IOTASTRONG


MIOTA IOTAUSDT going longIOTA is breaking out after retesting the 50D EMA three times in a month. As long as it reminds above the 100D EMA it's a healthy buy set up.
Exit target can be set anywhere to 100% gain.

IOTA/USDT Binance (2hrs) Bouncing off support. Tomorrow I feel like IOTA starts making some surges and quick pull backs to support depending on BTC movement. Keeps reaching previous volatile levels in an uptrend. Lets see what bitcoin does through this nigh. Not financial advice. DYOR

IOTA Buy SetupIota is showing bullish signals with this formation of a symmetrical triangle, looks like a bullflag though on the weekly chart
this is very bullish

ATOMUSD Cosmos start to rise again.The advisor MarketMiracle generates an entry signal for ATOMUSD at price 22.91 USD with a target price of 25.66 with a potential profit of 11,99 %
Analyzing the graph this could actually come true in fact there are no particular obstacles in front of the price and the upward thrust identified by Miracle Viewer seems to become increasingly consistent, the goal is not so far.
This idea is based on a signal generated by the advisor Marketmiracle, scroll the page to find the link to the free page of the signals of the advisor that you can consult without any cost and without registration.
