IOTA (IOTAUSDT) short.All description on the chart.
Please, don't forget to like and follow.
Thank you.
IOTA


IOTA/USDT time to do nothingHello traders,
I see two scenarios for IOTA/DOLLAR, we are inside a downtrend channel.
We are close to an important level of support level that can hold the price and retesting the resistance line, and we may be moving sideways or breaking the line in uptrend moviment, and the second scenario is the price test that the support line of this downtrend channel
I only buy this asset close to the support line of the downtrend channel, or above the long term resistance line.
Now is time to do nothing in IOTA, only watch the price reactions at thoses points.
Please support this publication with your like. You are welcome to follow us on the Tradingview.
Best regard Sandro and Gustavo.


IOTUSD: Good Buy OpportunityThe market looks interesting for buying in the long run. We have the price reversal confirmed by RSI, MACD, and a reversal candlestick pattern. If Bitcoin keeps the upward movement, this market will be able to reach the important highs at 0.3500 and 0.5500 levels. It makes this buy opportunity very interesting as we have enough space for the upward movement.
Disclaimer!
This post does not provide financial advice. It is for educational purposes only! You can use the information from the post to make your own trading plan for the market. But you must do your own research and use it as the priority. Trading is risky, and it is not suitable for everyone. Only you can be responsible for your trading.


ICX/BTC Bullish Pennant Another 110% Potential Rally ??Since the massive Rally ICX has been correcting so far.
You can see clearly it is forming a bullish Pennant and also hovering around .5 fib level.
If yes there's an "IF" it breaks to the upside. I'll add positions on retest.
IMO upside momentum is highly likely as the Dominance is falling for the BTC and alts are getting relief. ICX is among those alts with strong fundamentals. The red dotted line is the long term Resistance.
MACD is showing Bullish signal too.
Let's wait for the breakout to enter.
#Peace

There is a trading opportunity to buy in IOTABTCTechnical analysis:
. Miota/Bitcoin is in a range bound and the beginning of uptrend is expected.
. The price is below the 21-Day WEMA which acts as a dynamic resistance.
. The RSI is at 40.
Trading suggestion:
. There is a possibility of temporary retracement to suggested support zone (0.0000267 to 0.0000213). if so, traders can set orders based on Price Action and expect to reach short-term targets.
Beginning of entry zone (0.0000267)
Ending of entry zone (0.0000213)
Entry signal:
Signal to enter the market occurs when the price comes to " Buy zone " then forms one of the reversal patterns, whether " Bullish Engulfing ", " Hammer " or " Valley " in other words, NO entry signal when the price comes to the zone BUT after any of reversal patterns is formed in the zone. To learn more about " Entry signal " and the special version of our " Price Action " strategy FOLLOW our lessons :
Take Profits:
TP1= @ 0.0000349
TP2= @ 0.0000455
TP3= @ 0.0000623
TP4= @ 0.0000810
TP5= @ 0.0001012
TP6= @ 0.0001507
TP7= @ 0.0001906
TP8= Free


$MIOTA\BTC Updated view Updated view of the movement.
The correction occurred precisely in the buyer's zone of interest and did not allow it to fall below, we are in the buy zone.
Bitcoin correction spoiled the previous forecast, but we remain in the trend and there is a goal

IOTA/USDTBuy Now IOTA/USDT
Target Profit 1 : 0.368
Target Profit 2 : 0.400
Stop Loss : 0.2875
Risk/Reward Ratio : 1

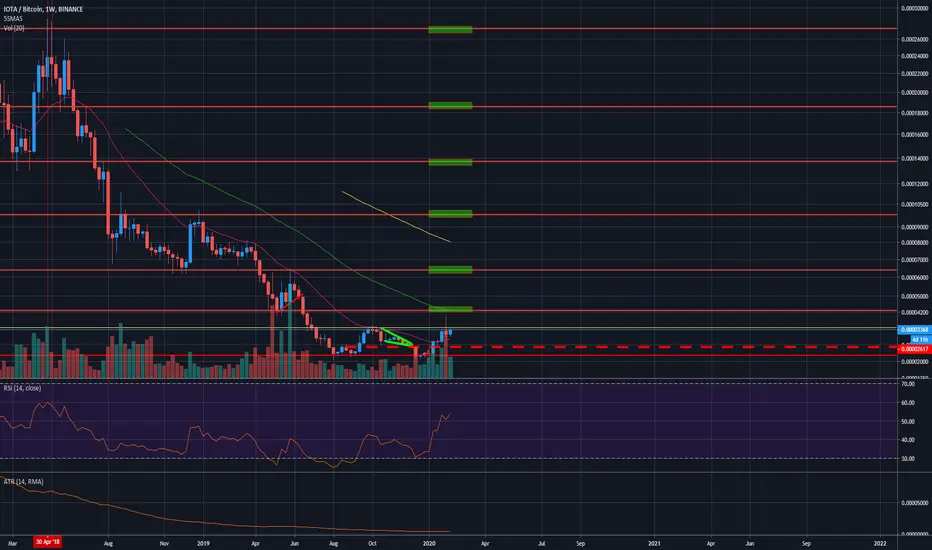
#IOTA STRONG - long term view - double bottom on weekly.I always say that - but people often look at too short time frames - and that needs repeating over and over again. What many see on 4H charts has nothing to do with long term 1W setups which to be honest are my favorite. Double bottom here on BTC will make this trade my #BTC harvester... since I simply am not going to sell at first green box target... Good luck everyone - IOTA STRONG.
We area so early - great opportunity...
IOTAETH - beautiful setupI always say that - but people often look at too short time frames - and that needs repeating over and over again. What many see on 4H charts has nothing to do with long term 1W setups which to be honest are my favorite. Double bottom here on ETH will make this trade my ETH harvester... since I simply am not going to sell at first green box target... Good luck everyone - IOTA STRONG.


#IOTAUSDT - Test The Previous High? Is this also on the verge of pushing higher again? It's looking good and a retest of that region would be a nice little push and possibly go even higher.
If the Altcoin market looking pretty good at the momentum and a lot of coins already broken out, can we expect the same from IOTA?


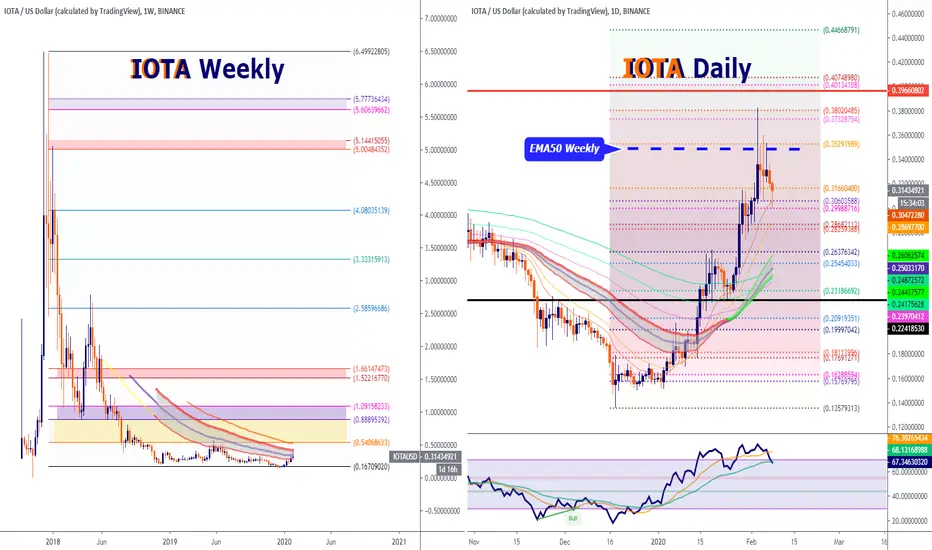
IOTA struggling around EMA 50 (Weekly)IOTA/USD Weekly & Daily Chart.
Disclaimer:
We are not registered or licensed in any jurisdiction whatsoever to provide investing advice or anything of an advisory or consultancy nature,
and are therefore are unqualified to give investment recommendations.
Always do your own research and consult with a licensed investment professional before investing.
This communication is never to be used as the basis of making investment decisions, and it is for entertainment purposes only.
BTC - The green line that worries meAs much as I would like to be bullish, historically 200SMA acted as a pretty strong resistance. If broken and confirmed above. I will be bullish again, for now in doubt - carefull with tight SL's.

IOTA/BTCWe have a crazy resistance in Fibonacci 0.246 need to break it out with a strong candle to see next levels :)


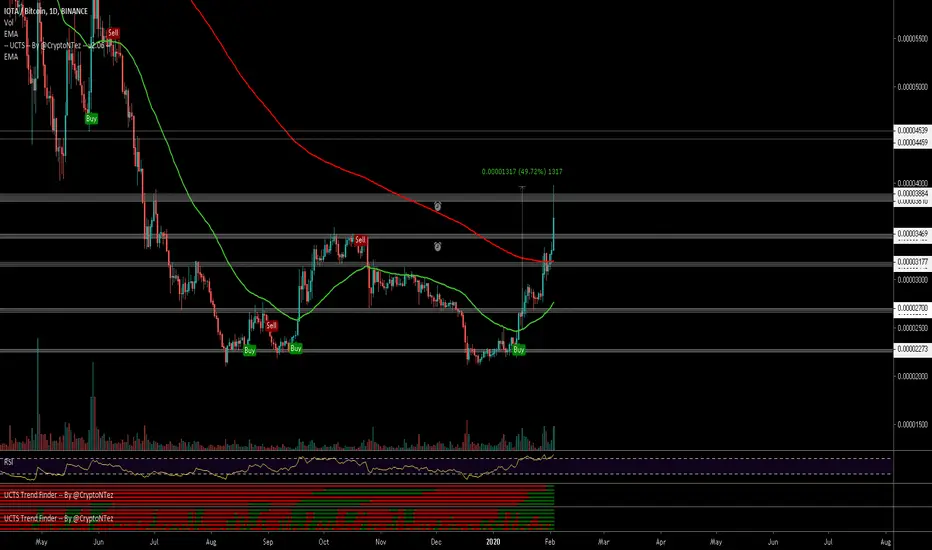
$IOTA, Starting the week w/ big flow of volume..$IOTA
Starting the week w/ big flow of volume that pushed price towards ~3800 sats resistance...
Over 50% up since UCTS Buy signal on the 1D (Buy signals across every HTF)
RSI overbought levels
On my eyes, buying here seems risky..
Wait for retests/flips of prior levels
#IOTA