IOTA Next Moves (Long term)If we broke the red resistance area, most likely will see the 2017 bull run moves playing out
Iotabtc

IOTA can be one of best altcoins during this bullrun. BIG PROFITIOTA is very very good project. This coin have solid foundations. This coin is on our golden list of altcoins and it will give use huge profit in this bullrun. Holders will be rewarded.
If you want to know our golden list of altcoins for this bullrun and play with us on short term signals feel free to join us on our website!

IOTA (MIOTA) - March 31Hello?
Dear traders, nice to meet you.
By "following" you can always get new information quickly.
Please also ask for the "Like" clock.
Have a nice day.
----------------------------------
We have to see if we can get support and climb at 1.49422213.
If it goes down, you need to make sure you get support at 1.38050147.
If you fall at the 1.38050147 point, you need a short stop loss.
However, it may rise along the uptrend line, so careful trading is necessary.
If it falls in the 1.03265428-1.14804624 interval, a Stop Loss is required to preserve profit and loss.
It is expected to reorient itself by ascending to the 1.84039802-1.95578998 section.
---------------------------------------
(IOTABTC 1D chart)
It remains to be seen if we can get support at the 2566 Satoshi point and follow the uptrend line to the 2667 Satoshi-2889 Satoshi section.
The 2566 Satoshi point is a point where you can enter to ascend above the 2667 Satoshi point.
If you fall at 2473 Satoshi, you need a short stop loss.
If it falls at 2222 Satoshi, Stop Loss is needed to preserve profit and loss.
If the 2667 Satoshi-2889 Satoshi section is supported, it is expected that there will be a move to ascend more than 3555 points.
-------------------------------------------------- -------------------------------------------
** All indicators are lagging indicators.
So, it's important to be aware that the indicator moves accordingly with the movement of price and volume.
Just for the sake of convenience, we are talking upside down for interpretation of the indicators.
** The wRSI_SR indicator is an indicator created by adding settings and options from the existing Stochastic RSI indicator.
Therefore, the interpretation is the same as the conventional stochastic RSI indicator. (K, D line -> R, S line)
** The OBV indicator was re-created by applying a formula to the DepthHouse Trading indicator, an indicator that oh92 disclosed. (Thank you for this.)
** Check support, resistance, and abbreviation points.
** Support or resistance is based on the closing price of the 1D chart.
** All explanations are for reference only and do not guarantee profit or loss on investment.
Explanation of abbreviations displayed on the chart
R: A point or section of resistance that requires a response to preserve profits
S-L: Stop Loss point or section
S: A point or segment that can be bought for profit generation as a support point or segment
(Short-term Stop Loss can be said to be a point where profits and losses can be preserved or additionally entered through installment transactions. It is a short-term investment perspective.)
GAP refers to the difference in prices that occurred when the stock market, CME, and BAKKT exchanges were closed because they do not trade 24 hours a day.
G1: Closing price when closed
G2: Cigar at the time of opening
(Example) Gap (G1-G2)


the forgotten IOTA BACK? = YES YES THE GREEN COFFEE TIME COMINGHello my trading friends,
I hope you have great time.
Depending on my study on IOTA, it looks we can get a time with some increase trends. thats why i called in title : the forgotten IOTA BACK?
Time will show us this.
Have safe trades,
Like and follow our channel for more nice free signals! Thank you..
Discipline are the key to success - Take profit - Learn from your mistakes and never give up!
The reason 1 that 90% of traders lose, not because they can't trade, but because they trade emotionally.
if this appeals to you then learn yourself first before starting with trading.
#Always do your own research don't follow us or someone else blindly

IOTA | ASCENDING TRIANGLE | 23rd March 2021 - 3rd April 2021Textbook ascending triangle pattern. Breakout confirmation after daily close above $1.58. Book profits around weekly resistance of $2.42

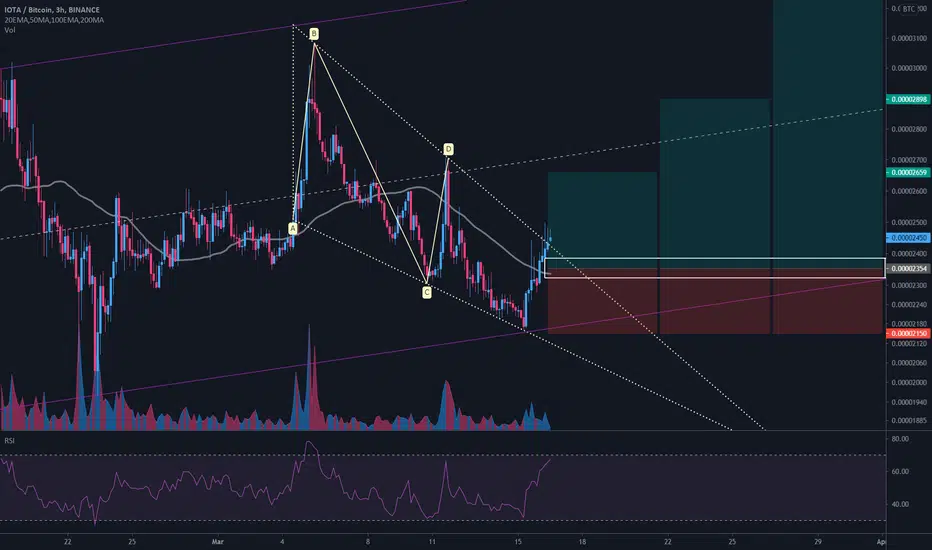
$IOTA/BTC 4h (Binance Spot) Falling wedge breakoutMiota is trending inside an ascending channel and has broken out of that falling wedge.
Let's wait for a pull-back and try to catch it on 50MA support retest, which is also a demand zone!
Current Price= 0.00002450
Buy Entry= 0.00002385 - 0.00002323
Take Profit= 0.00002659 | 0.00002898 | 0.00003316
Stop Loss= 0.00002150
Risk/Reward= 1:1.5 | 1:2.67 | 1:4.72
Expected Profit= +12.96% | +23.11% | +40.87%
Possible Loss= -8.67%
Fib. Retracement= 0.5 | 0.786 | 1.272
Margin Leverage= 1x
Estimated Gain-time= 2 weeks
It's showIOTA time ! Like you're witnessing, we see a nice left right shoulders on daily basis with a blue shaved bar which means there is instutional buying pressure.
The next target would be 2.82$
Like, share and follow my page to see more.

IOTA/BTC Broadening descending wedgeLots of IOTA news coming this month with Chrysalis around the corner


IOTA/BTC 1d - 07/03/2021 - Elliott waves analysisElliott wave 5 incoming, main target at 1 fib (around 4000 satoshis).

IOTA Buy a break.IOTAUSDT - Intraday - We look to Buy a break of 1.426 (stop at 1.376)
Daily signals are bullish.
Pivot resistance is at 1.410.
A break of bespoke resistance at 1.420, and the move higher is already underway.
We look for gains to be extended today.
Short term bias has turned positive.
Price action has formed a bullish ascending triangle formation.
Our profit targets will be 1.567 and 1.662
Resistance: 1.420 / 1.470 / 1.500
Support: 1.340 / 1.280 / 1.200

IOTA to move higher.As IOTA broke above ascending triangle resistance, now I expect the gains to retest the previous pivot resistance, below which is my take profit level for this quick trade.
Good luck!

IOTA Buy a break.IOTAUSDT - Intraday - We look to Buy a break of 1.251 (stop at 1.199)
Daily signals are bullish.
Pivot resistance is at 1.240.
A break of bespoke resistance at 1.240, and the move higher is already underway.
Pivot resistance is at 1.410.
Short term bias has turned positive.
Our profit targets will be 1.396 and 1.521
Resistance: 1.240 / 1.300 / 1.400
Support: 1.150 / 1.100 / 1.020

IOTA Buy the dip.IOTAUSDT - Intraday - We look to Buy at 0.993 (stop at 0.923)
Daily signals are bullish.
Trading close to the psychological 1.000 level.
Dips continue to attract buyers.
We look to buy dips.
Pivot support is at 0.939.
Our profit targets will be 1.193 and 1.273
Resistance: 1.120 / 1.200 / 1.280
Support: 1.000 / 0.950 / 0.900

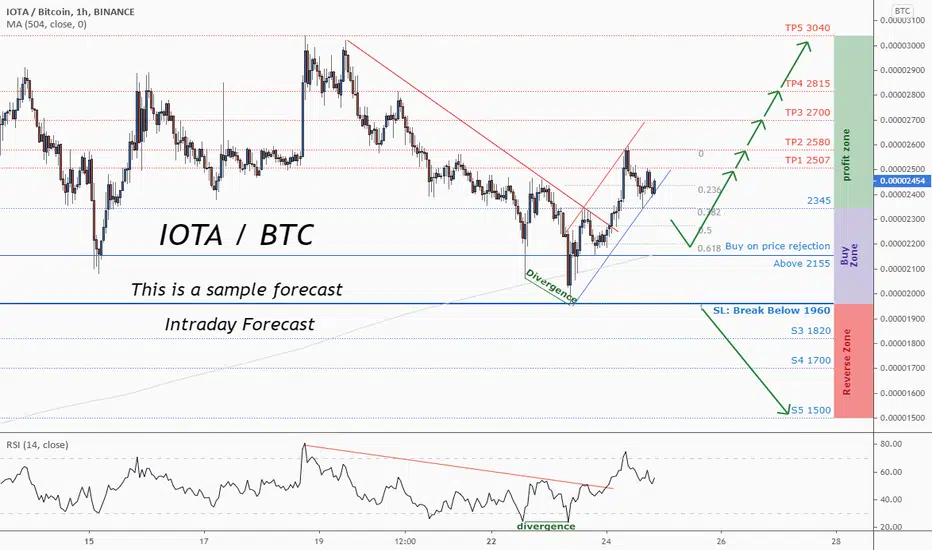
💡 It's a great buy opportunity in IOTA/BTC @iota @BitcoinTrading suggestion:
. There is a possibility of temporary retracement to the suggested support line (0.00002155). If so, traders can set orders based on Price Action and expect to reach short-term targets.
Technical analysis:
. IOTABTC is in an uptrend and the continuation of an uptrend is expected.
. The price is above the 21-Day WEMA which acts as a dynamic support.
. The RSI is at 52.53.
Take Profits:
TP1= @ 0.00002507
TP2= @ 0.00002580
TP3= @ 0.00002700
TP4= @ 0.00002815
TP5= @ 0.00003040
SL= Break below S2
❤️ If you find this helpful and want more FREE forecasts in TradingView
. . . . . Please show your support back,
. . . . . . . . Hit the 👍 LIKE button,
. . . . . . . . . . . Drop some feedback below in the comment!
❤️ Your Support is very much 🙏 appreciated!❤️
💎 Want us to help you become a better Forex trader?
Now, It's your turn!
Be sure to leave a comment. Let us know how do you see this opportunity and forecast.
Trade well, ❤️
ForecastCity English Support Team ❤️
TrendAnalysis ChartPatterns TechnicalIndicators
Out IOTA PositionAt the beginning of February, the market gave us a great opportunity to earn extra profits, which is exactly what we did.
We at Pennygene turned our attention to the IOTA/BTC chart back in early January 2020, and have kept watching. What attracted our attention was that this asset was falling fast almost all the time from August till the end of December 2020, but then the first 1W bar of January showed us that the price reached good support at 0.0000094. Also, it was the lowest price point since the launch. After a month of waiting, our efforts paid off. At the beginning of February, we placed our long positions at 0.0000143, of course using a stop loss. And now we have been in the position for more than two weeks. At the moment PNL is 102% and we are not going to exit this long position yet.
Important: Never be guided solely by the notion of the "lowest price in the history of the asset" this price floor can be updated at any time. Your strategy has to take into account a combination of several factors. Especially when it comes to a low-capitalization altcoin. At this point, we cannot recommend you to go long on this asset because much of the growth has already happened.
In any case, if you are interested in IOTA, you need to wait before placing a new order. Maybe the last 7 days after the active growth is just a consolidation and liquidity gathering for further growth. Maybe after that, you will get a new opportunity to enter this asset.


IOTA might break above the ichimoku cloud on the weeklyLots of development in IOTA, big updates rolling out over the next months.

Follow happy man, target 1.70last time stopped my iOTA position.
I hope this one will work.
I am following happy man in 1h chart.
If it breaks, target will be 1.7
Follow the stop around 1.179
Please follow candle close prices.
I got the risk and already opened my position because I see a move in 4h timeframe.
I'll update after it it breaks resistance.
Please leave a comment if you join the trade.

IOTA headed for the 2$ mark !you can see how perfectly IOTA acts along those fibonacci levels.
I'm just saying.
not a financial advice
