IOTA Analysis 28/02/2021seems golden zone is standing and the retracement is done, we can long it i believe now . it will ultimately go up, just the matter of time
3 TPs specified
1 TP is very easy to achieve
if 2 TP triggered with in the same impulse wave then we can be very bullish on the Coin and not take profit and Holding the Position for the 3 TP
Iotadollar

IOTA fundamental priceBINANCE:IOTAUSDT
IOTA definitely good project for long term, but just be careful now with any long positions cuz we can see squeeze down to test fundamental price around 0.62$
The good signs is we don't touch the bottom on RSI so we are still in neutral zone, and don't see the volume on chart from sellers
Also on daily RSI we can see pump and extremely important to break in out previews high on RSI, if not we will see perfect divergence.
Now we are trade under downtrend line FIB since May 2021
Hope you enjoyed the content I created, You can support with your likes and comments this idea so more people can watch!
✅Disclaimer: Please be aware of the risks involved in trading. This idea was made for educational purposes only not for financial Investment Purposes.
Don't forget sub and join my channels under this idea!

IOTA / TetherUS Trending Up under High VolumeIOTA / TetherUS Trending Up under High Volume - IOTA is a cryptocurrency with its own blockchain. IOTA is a cryptocurrency, with a purpose for IoT (Internet of Things). It's build upon DAG (Directed acyclic graph), called Tangle. The Tangle ledger is able to settle transactions, with zero fees.


IOTA Big! Cup and Handle A cup and handle idea for IOTAUSD
Also threw in a nice little Adam and Eve pattern which has led to the formation of the handle
This structure is common among many altcoins I will be looking into more of these cup and handles on altcoins

IOTA Double Bottom BounceyIOTA is sitting above 1.618 of its current forming uptrend
And has formed a double bottom
This is also the 0.5 Fib of the larger overall downtrend
Momentum upward should continue within the conditions of a bull market

IOTAUSD Analysis - Adam and EveAn Adam and Eve formation has allowed the transition through 1.618 into the next fib ring
Now a rounded Top is forming which I love to see, as they tend to break out to the upside frequently
The only question is will this breakout be localized within the same Fib ring or push out into 4.618? Time will tell
A few other patterns have been included also
My personal bias on IOTA is neutral

IOTA downtrend breakoutIota broke the downtrend and did the retest (downtrend breakout confirmation).
Target: U$3 (+31,5%)


IOTAUSDT Trendline breakoutIOTAUSDT (1H CHART) Technical Analysis Update
Trend line breakout
IOTA/USDT currently trading at $1.98
Buy-level: $1.92- $2.00
Stop loss: Below $1.80
Target 1: $2.15
Target 2: $2.28
Target 3: $2.45
Target 4: $2.60
Max Leverage: 2X
ALWAYS KEEP STOP LOSS...
Follow Our Tradingview Account for More Technical Analysis Updates, | Like, Share and Comment Your thoughts.


Big movement incomingIota is holding strong above EMA 50.
In the first hit, have seen +55%.
In the second hit, have seen +110%.
Now, in the third hit, +55% = U$1,85 and +110% = U$2,50.
RSI is holding VERY STRONG above 50 level.
Totally bullish scenario.
I believe in U$2+ on the next week.

IOTA parabola working wellIf IOTA doesn't break the parabola, IOTA could reach $2+ by the end of the month.

IOTA 900 days BREAKOUTIOTA broked the downtrend line (green line, 900 days).
If btc continue climbing or going sideway, IOTA price will explode soon.
TARGET: U$0,80

IOTA 900 days BREAKOUTIOTA broked the downtrend line (green line, 900 days).
Weekly candle closing above U$0.44 confirm the breakout.
TARGET: U$0,80

IOTA 900 days BREAKOUT soon!IOTA has not broken a downtrend line (green line, 900 days) yet.
BTC has corrected and ALTS has fallen.
The best moment to entry is the breakout confirmation.
It's safer to entry if the daily candle closes above $0,45.

IOTAUSDT: Possible Long (09.11.2020)On D1, the RSI reached the oversold level, after which the price formed an initial upward impulse.
On H1, the RSI also reached the oversold level, indicating the end of the local correction for the first upside impulse. Also, the price found support at the Fibonacci level of 38.2% (mirror level of 61.8%).
We recommend buying IOTA in order to hold the position above $ 0.35.

Don't miss the great buy opportunity in IOTUSDTrading suggestion:
. There is a possibility of temporary retracement to suggested support line (0.2118). if so, traders can set orders based on Price Action and expect to reach short-term targets.
Technical analysis:
. IOTUSD is in a range bound and the beginning of uptrend is expected.
.The price is above the 21-Day WEMA which acts as a dynamic support.
. The RSI is at 70.
Take Profits:
TP1= @ 0.2975
TP2= @ 0.3680
TP3= @ 0.5537
SL= Break below S2

A sign!--- Please if you find this informative and/or agree with the idea don't forget to give a like. Thank you! ---
This is an update from my previous idea, plz here you can find attached.
It is an important event in nature as it is the intersection with the MA200.
We don't know for sure the outcome of this action, although at least we expect some interesting movement here. Nice, isn't it?
From a 4h view we've been above the moving average for few hours already, but jut starting.
How far do you see Iota performing this summer? Please feel free to leave any comment.
Thanks again!

IOTA - Minimal View (Breaking the triangle)Another educational chart. Just an image,
an instant of time captured in a chart..
Could be beautiful, isn't it?
What are your thoughts? Is it going to break it or not?
You know the rules.
Thanks!

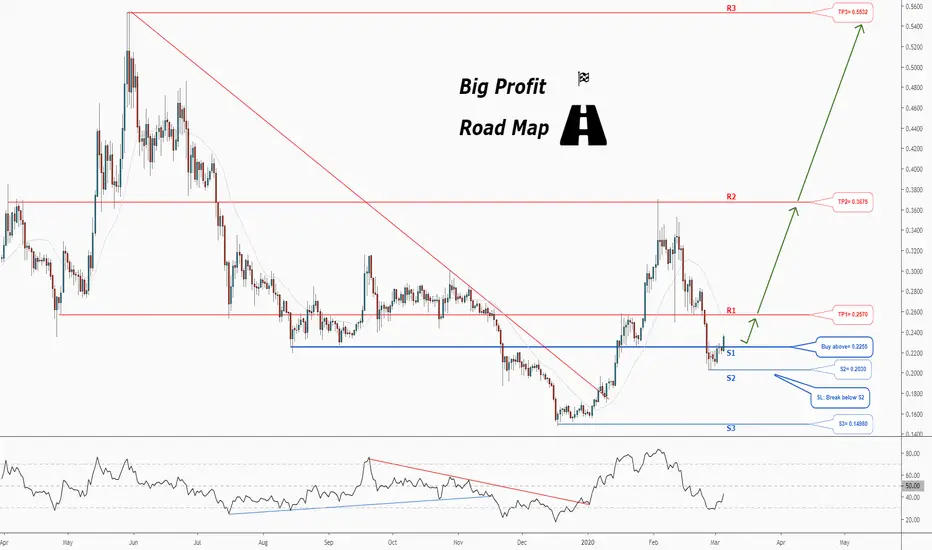
Don't miss the great buy opportunity in IOTUSDTrading suggestion:
. There is a possibility of temporary retracement to suggested support line (0.2255). if so, traders can set orders based on Price Action and expect to reach short-term targets.
Technical analysis:
. IOTUSD is in a range bound and the beginning of uptrend is expected.
.The price is above the 21-Day WEMA which acts as a dynamic support.
. The RSI is at 43.
Take Profits:
TP1= @ 0.2570
TP2= @ 0.3675
TP3= @ 0.5532
SL= Break below S2