IOTAIOTBTC
Moving in white channel. Waiting for break out this channel. 38,2% fibonacci. RSI - oversold.
Iotausd


Lower High rejection. Channel Down continuation. Still short.IOTA didn't cross the 0.7947 Resistance level and subsequently a new Lower High was made at 0.7428 that initiated a strong rejection (STOCHRSI = 19.365, Williams = -87.292, STOCHRSI = 15.207) within the 1D Channel Down (MACD = -0.042, Highs/Lows = -0.0660, B/BP = -0.0550). The new 4H Channel Down that has emerged can gradually take IOTUSD to our target set on this new bearish 1D leg. TP still = 0.3199 (November 02, 2017 low) and 0.1459 (July 15, 2017 low) in extension.

$IOTA, Otra Ves…
Weekly
Looking at our trend timeframe we see price has found support at 7000 satoshis, stochastic rsi showing momentum is shifting towards the upside. Will be watching smaller timeframes for a reversal, a close above resistance and expect a radical push towards 15000.
Daily
Shifting over to our pattern timeframe we see price has broke out of its minor downtrend and formed a higher high. Stochastic RSI showing momentum is looking for support, price has formed a higher low at 9000. A daily close above 9500 and expect a higher high to form near 13000, however if rejected at this level expect a sell off towards 7000.


IOTUSD bullish trend reversalMACD upside momentum is increasing on the Daily Renko chart and there are bullish crossovers. Watch for the price to move above the upper trendline for a big trend reversal.

IOTA heading to 0.30 centsI think there is no need to explain this view....time will show
----------------------------------------------------------------------------------------------------------------------
***** This is not a trading advice. Please invest responsibly *****


Extending the consolidation within the Channel Down. Still shortIOTA is within the 4H Resistance (0.7950) and Support (0.6700) lines (STOCH = 47.520, ADX = 19.955), as the 1D Channel Up extended the consolidation since the latest report. It is however on a slightly negative gradient as the 1D Lower High applies selling pressure on those 4H levels. There is no reason to alter our shorting strategy as long as long as 1W is still on Lower Highs (MACD = -0.270, Highs/Lows = -0.1063, B/BP = 0.3526). TP still = 0.3199 (November 02, 2017 low) and 0.1459 (July 15, 2017 low) in extension.
Let's change our point of view(IOTA)Alright guys here we go again with new chart of IOTUSD..check the similarities if 1 is 1'
2 is 2' and 3 is 3' then we are going super bullish but ,to have a bull run we have to break some serious resistance lines and the first is BTC to brake to 7150 then 8430 and after all and most important is to break the 10k levels..let's observe and see..

IOTA 1D facing resistance, can breakout with added bullish Ichi * Bullish signal HA candle printed day ago
* TrendMaster conservative stop at end opening of candle; less riskier, within body or prev candle's close (or a bit below it)
Ichi TA:
* Bearish market sentiment
* Bearish Chikou, facing res from price
* Price above Kijun, bullishness addition
* Possible bullish TK cross (weak signal strenght, as we're still below the Kumo)
Thoughts? Thanks

IOTAUSDT Forming Cup And Handle PatternIOTA/USDT
(2H Chart)
(Bullish)
Forming Cup and Handle Pattern and to retest resistance at 0.236 Fib/0.79

Ascending triangleIOTA/USD price is ranging in a nice ascending triangle. The ascending RSI points that the triangle might break upwards.

Just an idea for IOTACompare last years downtrend and uptrend. Would the timing be the same this year? Interesting to see how things will evolve upcoming months.


IOTAUSD DECISION TIME! Iota needs to come down, but how far down will she come?
Have we just completed ABC 4th wave correction or are we currently in a 5 wave impulse?
Iota is currently completing a 5th wave Diagonal, the next retrace will tell us all x
Making charts to buy wine and pay for surfboard repairs. #nofinancialadvice


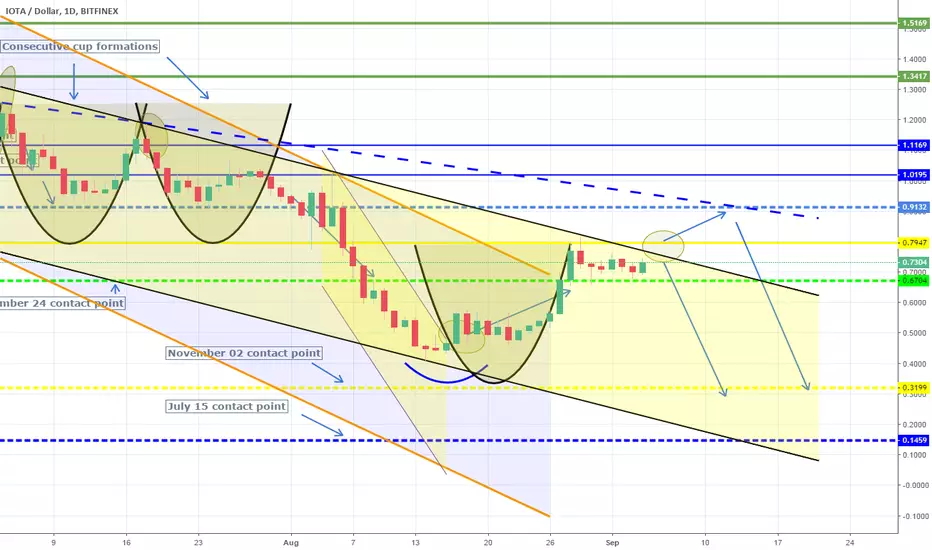
Lower High crossed. Expecting consolidation.The 0.67000 Lower High on 1D was crossed and the Channel Up (RSI = 57.762, Highs/Lows = 0.1669) is breaking to the upside. We expect IOTUSD to enter a consolidation phase, similar to the late June - late July consolidation, with successive cup patterns. Any upside attempt is still limited at 0.7947 and 0.95 (blue staccato lines) as 1W remains bearish (MACD = -0.282, Highs/Lows = -0.1543, B/BP = -0.5574). We remain short on IOTA, TP = 0.3199 (November 02, 2017 low) and 0.1459 (July 15, 2017 low) in extension.

BTCUSD EW analys road [7000$ -> 5300$ -> 20000$]BTCUSD EW analys road to NEW YEAR 2018
Hello everyone, after a long break from May, I update the information about the bitcoin movement
Look at the previous analysis, he was true!
But back to today's situation
and I think we are in the fifth wave of the correctional figure. That is, I expect in the near future growth in the region of 7000 and then again fall to 5300, after which the correction beginning with the month of January will end, and we will continue to move in the final fifth wave of momentum in the area of $ 20,000
subscribe to updates, thank you!!!

IOTA ANOTHER STEP DOWN?Harmonic Pattern, many resistances above.
But IOTA is often green wave coin.
Despite it I wait if it retrace around 0.3 dollars
I wait it there

