Iotausd

Ascending channel IOTAOn the 1h there is a very clearly defined ascending channel. As with all channels, you can rather safely trade them long or short depending on where they should bounce, with a very tight SL.
Safe trades.

Symmetrical triangle/Pennant BROKEN! amazing short opportunityAfter yesterdays failed pump, (it technically DID break up but since it was a byproduct of BTC's blatant manipulation I chose to ignore it) Iota broke down the symmetrical triangle and confirmed in 4h, a good enough timeframe, our short entry. Right now, setup looks very promising and barring any other BTC pump we should see at least a 20% retrace to our previous local bottom. Could take profits inbetween depending on price action. R/R is 2.33, not the greatest, but good enough.
We also have ema9 decisively crossing down on sma20 and a tightening on Bollingers, which signals a big mvoe soon.
Remember to use stop loss, trade safe!

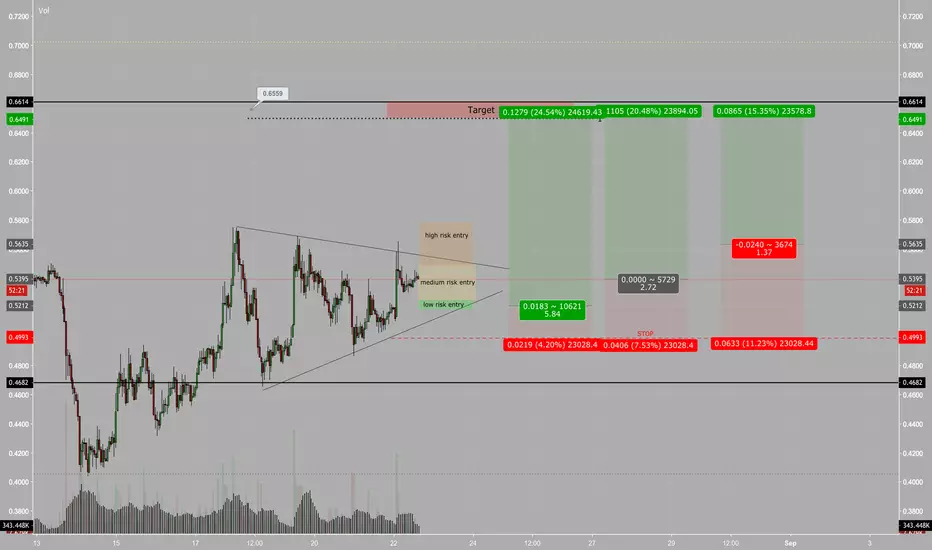
IOTA TRADE SETUP - SHOWING DIFFERENT ENTRY STRATEGIESHi guys, been a while.
IOTA just had its first initial impulsive leg up after a downtrend and is forming a continuation pattern. In this pattern i have layed out three different areas where you could go long with respectively their risk to reward ratios. As you can see the best entry is the one closest to the baseline of the triangle, but it doesnt reach this level too often. Depending on how aggressive / conservative you are as a trader, you choose at which point you would like to enter. Breakout trades are usually high in risk, but when done properly can give a higher succes rate.
Im looking to go long at the low risk level obviously, but when iota breaks out before it reaches that, i would take a smaller position size long at higher prices.
good luck
Short term consolidation before further downside. Short.The first curve shaped support held for IOTA and the 4H Channel Down broke sideways on neutral RSI = 47.802, STOCH = 50.707, ADX = 24.263, Highs/Lows = 0. With such a low pace (MACD = -0.104, Highs/Lows = 0, B/BP = -0.0521), the 1D Channel Down (RSI = 37.278) is limited to a 0.6700 Lower High maximum extension. As long as this holds, we will remain short on IOTUSD, targeting 0.3199 (November 02, 2017 low) and 0.1459 (July 15, 2017 low) in extension.


IOTA to stand TALL against Bitcoin?IOTA is forming an upwards trend with significant touches. At the moment is struggling to cross it because it has not bounced back up as normal. However, the current wave in crypto looks favorable and there are signs of strength. In this regard, we can expect both a cross down and a bounce up.

IOTA/USD - 1D Chat AnalysisAfter the Bearish trend was confirmed at the end of July the market started to correct since the 16th of August.
The RSI jumped from the "oversold" area and the MACD line just crossed the Signal line showing the beginning of the uptrend, at least for the short time.
If the price will break the resistance level of 0.6629$ it can be considered the confirmation of a Bullish trend. If not, the chances for the support level of 0.49$ to be reached again are quite big.

IOTA/USD - 1H AnalysisThe price has stared to move sideways since the 14th of August.
Ideal Scenario : With the RSI on a neutral position and with the MACD above the signal line, we are just waiting for the first candle to close on green above the 20 Days Moving Average as a confirmation of a short term uptrend towards 0. 4765$.
Alternative Scenario : If the first candle will close on red above the 20 Days Moving Average and if the MACD will cross the Signal line, the changes of having a short term downtrend towards 0.4360$ will be increased.

Awaiting for confirmation on support on Lower High. Short.As expected 4H formed a Channel Down that has now found support (RSI = 48.008) near the projected first curve shape as it approached the November 02, 2017 low. 1D is now on a critical short term level where if today's 4H Lower High breaks then the price will most likely rise within the 1D Channel Down (RSI = 30.058, MACD = -0.139, Highs/Lows = -0.0860, B/BP = -0.2131) to make a Lower High near 0.6700. In both events (break or rejection) we expect IOTUSD to hit the TP = 0.3199 (November 02, 2017 low) and 0.1459 (July 15, 2017 low) in extension.

IOTA. When will the fall end?After a long fall, IOTA is now in its heaviest price zone. sellers broke down the trend line and now passes its test buyers. After such a strong fall, we need a consolidation and a price zone test that has stopped the fall.
I have two scenarios, from where a strong upward movement can begin.
The first scenario is from a price range of $ 0.41-0.43.
The second scenario is $ 0.35-0.37. It was from there that the previous upward movement began in November 2017. So now, I'll keep track of whether the buyers will keep price zones, whether there are still volumes for sellers to continue to fall, whether buyers will return the price above the trend line and whether the willingness of traders to buy this coin.
If the forecast is correct, the global target is $ 1.
If buyers do not keep $ 0.35-0.37. I'll forget to buy this coin for a while.

IOTA/USD going to 0.4$ ?!I would never imagine to see this again, but well, IOTA is showing sines it will go back to 0.4$.

IOTA b Learning.Just for myself to see if it happens. Using trend channels, MacD divergence and volume profile. Idea is it to repeat the last drop. Obviously wont happen if BTC moons which is unlikely. Lets see does it happen/work.
Sell @ 55c stop if it starts to trade up the way.
Target 38c and lower.
Not so cluttered view
Targets from volume profile.

21 Period Low on IOTA, looking for quick bounceUsing a strategy described by John Carter. Low risk, nice reward.

Both targets hit. Emerging Channel Down. Short.Both TP = 0.7947 and 0.6704 (Nov 24, 2017 contact point) have been hit as IOTA followed our bearish break-out signal on the previous report, was rejected again on the 1.0195 Resistance and eventually made a new 1D low at 0.6000. We expect a new 4H Channel Down to emerge (RSI = 28.620, MACD = -0.069, Highs/Lows = -0.0378, B/BP = -0.1041) that will drive the price down to the November 02, 2017 contact point = 0.3199 at least, if not the July 15, 2017 = 0.1459. That will be a technical Lower Low within the 1D Channel Down (RSI = 31.382, MACD = -0.086, Highs/Lows = -0.1902, B/BP = -0.3909) for IOTUSD and a rebound is expected.

IOTA breaks all dreams of mom's traders :)Well, as I said before IOTA won't go up until BTC is in strong downtrend.
Anyway, a lot of mom's traders continue to paint their stupid dreams about IOTA for 3-5$ in August :) Of course, it won't happen.
Now there is no any reason to take a long. You can just buy it and hold if you are mom's investor.
P.S. Perhaps, we will see small rebound, but it's not "to the moon" )

IOTA/BTC TRADE - DOWNWARD WEDGE - CryptoManiac101This is self explanatory chart as always.
Enjoy this trade advice my Crypto Maniacs, but remember to invest only what you can afford to lose or you're going right back to poverty on drop. We are not your financial advisors.


IOTAUSD Key Support ZoneWeekly close under this zone means that there will be blood. But still I think that buying close to the zone has a good R/R.
Upper diagonal line just a possible take profit line(roughly) if it doesn't break the support.
The line is not for a descending triangle like I said.


There is a possibility for the beginning of an uptrend in IOTUSDTechnical analysis:
. IOTA/DOLLAR is in a range bound and the beginning of uptrend is expected.
. The price is below the 21-Day WEMA which acts as a dynamic resistance.
. The RSI is at 39.
. While the RSI and the price downtrend in the Daily chart are not broken, bearish wave in price would continue .
Trading suggestion:
. Price is in the resistance zone (0.96 to 0.70), traders can set orders based on Daily-Trading-Opportunities and expect to reach short-term targets.
Beginning of entry zone (0.96)
Ending of entry zone (0.70)
Entry signal:
Signal to enter the market occurs when the price comes to "Buy zone" then forms one of the reversal patterns, whether "Bullish Engulfing" , "Hammer" or "Valley" in other words,
NO entry signal when the price comes to the zone BUT after any of the reversal patterns is formed in the zone.
To learn more about "Entry signal" and the special version of our "Price Action" strategy FOLLOW our lessons:
Take Profits:
TP1= @ 1.16
TP2= @ 1.33
TP3= @ 1.62
TP4= @ 2.04
TP5= @ 2.60
TP6= @ 3.10
TP7= @ 3.92
TP8= @ 4.75
TP9= @ 5.80
TP10= Free
