IOTA/USDT Weekly Analysis – Critical Support Retest
📊 Pattern & Price Structure:
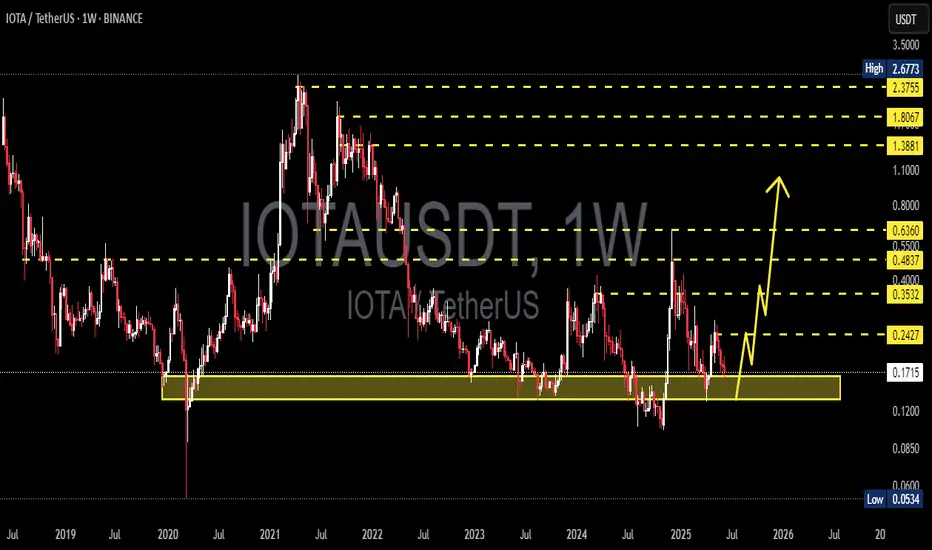
The chart indicates that IOTA is currently retesting a major historical demand zone in the range of $0.110 – $0.160, which has served as a strong support since 2020. The price has bounced off this area multiple times in the past, reinforcing it as a solid accumulation zone.
There is also a potential formation of a double bottom or accumulation range around this level, which often acts as the foundation for a major reversal if accompanied by volume and momentum.
🟢 Bullish Scenario:
If this support holds and buyers show strength:
1. The price could rebound and test key resistance levels:
$0.2454 (initial resistance)
$0.3496
$0.4000
$0.4751
2. A breakout beyond those levels may trigger further upside targets at:
$0.8982 (weekly key resistance)
$1.4913
$2.000
$2.390 and potentially even $2.677
3. Bullish catalysts such as positive fundamental news, rising market sentiment, or visible accumulation volume could spark an explosive move.
🔴 Bearish Scenario:
If the price fails to hold the $0.110 – $0.160 support zone:
1. A breakdown could lead to a decline toward previous extreme lows around:
$0.0700 – $0.0534
2. This would signal a loss of long-term buyer interest and open the door to deeper bearish continuation.
⚠️ Technical Conclusion:
The yellow zone is a make-or-break level — bulls must defend this to maintain any bullish structure.
As long as IOTA stays above $0.110, the risk-reward favors a bullish reversal.
A confirmed bullish weekly candle and volume spike would strengthen the bullish outlook.
📌 Key Levels:
Major Support Zone: $0.110 – $0.160
Resistance Levels to Watch:
$0.2454 → $0.3496 → $0.4000 → $0.4751 → $0.8982 → $1.4913 → $2.000 → $2.390 → $2.677
#IOTA #IOTAUSDT #CryptoAnalysis #AltcoinBreakout #TechnicalAnalysis #BullishReversal #CryptoSetup #SupportAndResistance
Iotausdtrade

IOTAUSDT 1W AnalysisIOTA ~ 1W Analysis
#IOTA Buy back gradually from here if you still have confidence in this coin with a short term target of at least 20%+ from here.
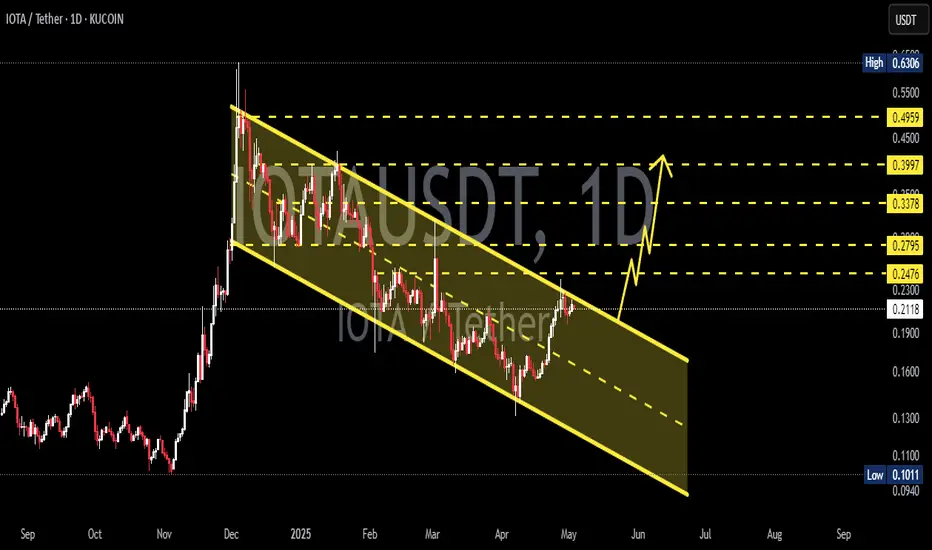
IOTAUSDT 1D AnalysisIOTA ~ 1D Analysis
#IOTA Buy after successfully penetrating this resistant line with a short -term target of at least 10%+ from here.
IOTAUSDT 1WIOTA ~ 1W Analysis
#IOTA Buy gradually from here if you still have a Conviction on this coin with a short -term target of at least 20%+.

IOTAUSDT BIG move incoming Position Accordingly
IOTAUSDT 1D
Thiis going to Hold here and give a massive Pump sooner.
Next leg Up is going to be faster and greater.
I am already in a Spot long and will look for Longing this with leverage.
Note: Not a Financial Advise.

IOTAUSDT 1WIOTA ~ 1W Analysis
#IOTA Buy gradually from here if you still have a Conviction on this Coin.
With a short -term target of at least 20%+.

IOTAUSDTIOTA ~ 1W
#IOTA this is the lowest support block on this coin. Buy in stages with a minimum target of 20%++. Don't miss this lowest price.

IOTAUSDTFWB:IOTA ~ 1W
#IOTA If you have Conviction on this coin,. This support block would be a very good buy for now.

IOTAUSDTIOTA ~ 1W
#IOTA If you have Conviction on this coin,. This support block would be a very good buy for now.

IOTAUSDTIOTA ~ 1W
#IOTA If you have Conviction on this coin,. This support block would be a very good buy for now.

Iota/Usdt On The Verge Of BreakoutIota/USDT appears to be exhibiting strength in the short term. All that is required now is to wait for a breakout of this pattern. In the event of a successful breakout, a 15-30% bullish move can be anticipated. It is important to note that this is not financial advice; please conduct your own research (DYOR).

IOTAUSD 1WIOTA ~ 1W
#IOTA Make purchases gradually on this support block, with a minimum target of 20%+

IOTA/USDT BREAKOUT! READY FOR A PUMP🚀In the 4-hour time frame, IOST has broken out of this falling wedge pattern and is currently bouncing after retesting this pattern. If we look at it on a higher time frame like daily, we can see bullish divergences in the RSI. This seems like a solid choice. Its strong tokenomics and competent team make it a promising asset. The chart indicates the potential for significant growth in the next few weeks.
Entry: Current Market Price (CMP) and add more up to $0.22
Target: According to the pattern, we can expect up to a 50% to 70% bounce in the price.
Remember to do your own research.
NFA
#Crypto FWB:IOTA

IOTSUSD 1WIOTA ~ 1W 📈
#IOTA The retest of this support line has been successful. Make purchases gradually from here with a minimum target of 20%+.
It will remain Bullish as long as price continues to stay above this Support line.

IOTA prediction, Price target ---> 0.57$?BINANCE:IOTAUSDT
Hello dear traders.
As you can see, the price has jumped higher after attracting support in the indicated area, contrary to the bearish scenario predicted by some traders.
The price is now in an upward rally and there is no specific price resistance up to the $0.57 level.
If USDT.D continues its neutral or bearish trend, Bitcoin and other altcoins can rise further.
✌💥If you are satisfied with my analytical content, please share my ideas💥✌
✍🐱👤Otherwise, make sure you leave comments and let me know what you think.🐱👤✍
🍾Thank you for your support. I hope you will gain profit by following my analyses.🍾

IOTAUSDT: Short PositionHello friends . It's possible to accure this way and touch 0.2303 $ Sell position
Short Position
entry Price : 0.2709
Target : 0.2303
Sl :0.2742

IOTA and the 1150 Risk To rewards potential Opportunity Hi Everyone;
today we have one of the best risk to reward Investment opportunity
it is more than 1150 times the risk and the chart is look very promising.
I expect breaking the previous bear market key point will clear the way to the final target

IOTAUSD MIOTA Sell TF H4 TP = 0.1565On the 4-hour chart the trend started on June 27 (linear regression channel).
There is a high probability of profit. A possible take profit level is 0.1565
But do not forget about SL = 0.1970
Using a trailing stop is also a good idea!
Please leave your feedback, your opinion. I am very interested. Thank you!
Good luck!
Regards, WeBelieveInTrading

IOTA Long Setup 1 HR TFBINANCE:IOTAUSDT.P Long Setup: The price has now retested the previous level. This is a bullish sign, as it suggests that the price is ready to continue its uptrend. This suggests that the bulls are still in control and that the price is ready to continue its uptrend.
Entry Price and SL mentioned.

IOTA will potentially reach 0.1984h time frame
-
IOTA creating double bottom.
Notice the first resistance around 0.19
Final target is 0.1982

IOTA will reach $2 next yearDaily time frame
-
IOTA creating a symmetrical structure
Big possibility to see $2 from 2024/03 to 2024/07
Try to put it into your portfolio!

Iotausdt Most Probably IOAUSDT
has recently confirmed the trendline resistance breakout and retest, and a symmetrical bullish pattern has emerged on the 8-hour timeframe. This pattern indicates a potential bullish move to the upside if a successful breakout occurs.
It is recommended to wait for confirmation of the breakout before taking any positions. Proper risk management is important to avoid losses in case of a false breakout or a sudden market reversal. If the breakout is successful, the price is likely to move 30-50% higher from the breakout level. Traders should keep a close eye on the price action and adjust their positions accordingly.
If You Are Satisfied With Our Work Join us

IOTA: Shake It Off!I’m just gonna shake, shake, shake, shake, shake, shake…
IOTA should really turn up this Taylor Swift song and step up, for we expect the altcoin to shake off the recent correction phase and to move upwards, crossing the resistance at $1.0550. First, though, IOTA must finally complete wave ii in magenta, which could initially lead it a bit deeper into the magenta zone between $0.3634 and $0.0600. However, the altcoin should be careful not to drop below the support at $0.0600.
