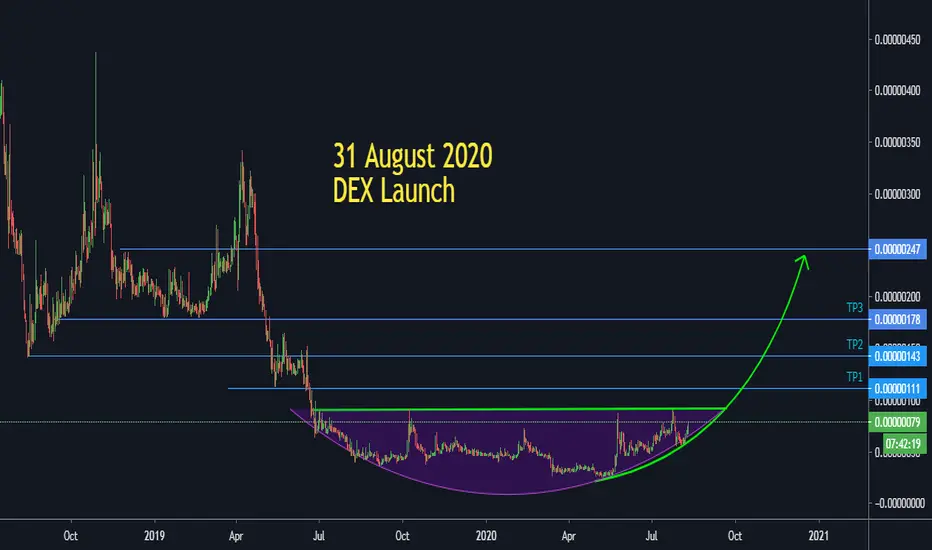
IoTex (IOTX) Bull Confirmed, Huge Potential!The growth action that will ensue on this chart has been confirmed, strong bullish action detected.
Here are the main three signals we spotted a second after looking at this chart:
1) The "cup pattern" is now common between many altcoins that are breaking bullish and growing big.
2) High volume is one of the best indicators to confirm a "real" move.
3) Moving above EMA50 is a basic milestone that needs to be reached before any pair can really move higher.
IOTXBTC printed all three with many more...
Get ready, because this altcoin pair will also continue to grow.
Thanks a lot for your continued and amazing support.
To support this content and get more, all you have to do is hit LIKE, leave a COMMENT, and send us some LOVE!
Namaste.
Iotx


IOTXETH Butterfly is ready to fly...IOTXETH Bullish Butterfly Pattern is ready to fly...
Possible targets are marked on the chart...

✳️IoTeX/BTC Analysis (21/12) #IOTX $IOTXIOTX is at the 30sts strong support zone, which can help push the price of IOTX up again in December and January.
IOTX will head towards the resistance zones of 40sts, 55sts and even 75sts.
However, the market is still not stable so IOTX can still drop to 25sts, so we should have back-up money for this zone.
📈BUY
-Buy: 28-30sts
-Buy: 23-25sts. SL if B
📉SELL
-Sell: 38-40sts if B. SL if A
-Sell: 53-55sts if B. SL if A
-Sell: 73-75sts if B. SL if A
❓Details
Condition A : "If 1D candle closes ABOVE this zone"
Condition B : "If 1D candle closes BELOW this zone"

✳️IoTeX/BTC (20-10) #IOTX $IOTX #IOTXBTC50-55sts is the start point of the last rally of IOTX and now we can see a quick pump on it. So this zone is quite good for us to buy in.
Targets should be 65sts and 80sts, these levels are very important and these levels refused IOTX in October, so it will get some selling pressure in these levels.
The lower support is 45-46sts that we will trust in.

IOTXBTCIt's on the lowest support level which mean perfect BUY opportunity. Altho I wouldn't suggest to trade it on leverage but you could go on margin with careful stop-loss setting.
Cheers!!

IOTXUSDT AnalysisSince there are 2 SELL signals present, I'm BEARISH .
And I don't think this is a good time to buy.
If you want to buy again, we have 3 different options.
1- You can wait for EngineeringRobo's BUY signals to be present,
2- You can wait for candles to open-close above resistance level (0.011) for 1D to buy,
3- You can buy when candles touching the support line (0.0062).
After you buy, please watch out for EngineeringRobo's sell signals and consider selling it.

IOTXUSDT analysisBuy 1 and bull signal say we can buy. Here is my analysis:
1. We can buy when risk/reward ratio is greater than 2, we can buy at 0.0081
2. We can buy at support = 0.007usdt
3. We can buy when resistance turns to support (1D open & close above resistance) = 0.011usdt
Since there is an existing sell2 signal, either sell 1 or bear signal is required for sell decision. We must also sell if the chart goes 1D open & close below the support line.

IOTXUSDTprices up almost %300 percent since a moon in mid may and with no hell signal plus recent support from a buy1+buy3 we could see continued upward movement and new all time highs but if we close below support we could see a retest of that uptrend line.

IOTXUSDT ANALYSISI have 4 positive signal it is above the support(horizontal now) line
If you cought with 50 ma cross 20 ma buy signal you got x5 profit
If you cought with Moon signal you got x4 profit
If you cought with Bull signal you got x2 profit at this chart that is why you should use EngineeringRobo
If you want to buy this coin it is ok to buy now but watch carefully EngineeringRobo signal
If you hold this coin don' t hurry to sell it watch EngineeringRobo' s sell signal
Finally and Unfortunately EngineeringRobo gave Sell 1 & Sell 2 and Sell 3 to Bitcoin, I am not strongly recommending to buy any altcoins at the moment
If you want to use EngineeringRobo please dm me. Have a good trade

IoTex (IOTX) Bullish Beak! [UPDATE]I am really happy to see IoTex (IOTXBTC) deciding to break bullish since I bought another bag just recently... It is always fun to see prices move shortly after buying.
Here is the same chart drawing shared on the 2nd of July.
Pretty clear, very simple... All the targets are clearly marked.
IOTXBTC Chart Analysis/Signals
We have prices moving above all the MAs/EMAs on low volume...
Since the cycle is bullish, the low volume can be taken as a continuation signal, meaning that we can see additional growth.
Closing daily above 74 satoshis (0.00000074), would signal additional strength and tells us that our next target is getting close.
Let's see how it goes, we are aiming for a higher high on this new wave.
This is not financial advice.
This chart analysis is not meant for you to trade.
Remember to do your own research and have your own plan/strategy before you trade.
Namaste.
---
Previous chart | July 2
IoTeX (IOTX) Prints Strong Consolidation

$IOTX, Crossing over ~90 sats level w/ potential R/S flip $IOTX
Crossing over ~90 sats level w/ potential R/S flip on the 12H...
Also DEX coming on the following days that could drive some traction..
Aim for an entry at support level w/ a proper SL just in case...
#IOTX

IOTXUSDT ANALYSISBased on my analysis, the candles are stuck between dashed line and the horizontal line(0.008227). In my opinion, the candles cross and pass the last horizontal line(0.008227) very soon. Therefore,
If you wanna a little risk, you will buy it now, or
you wait a few days and when you see the candles will open and close above the horizontal line, that time you may buy it.
Your choice, but if you ask me, I would prefer to wait until pass the line.
Besides, I prefer to look at EngineeringRobo's signals as well. :))


$IOTX, Flipped ~64sats level into support...$IOTX
Flipped ~64sats level into support and its trying to gain traction again aiming for ~90/110/140 sats as targets
UCTS remaining bullish at HTFs after some accumulation over this level..
Aim for entry as low as possible and keep some alerts to see how it evolves!
#IOTX

IOTX possible 200% gainsNice entry for possible 200% + gains with news of IOTX Ucam product launch on Amazon this month.
Link : coinmarketcal.com

IOTXUSDT⚠️✅⚠️ Breakout Incoming, pay attention!💬 IoTeX (IOTX) looks like it is gearing up to break resistance. Let's analyze this bad boy of blockchain and Chainlink partnerships to see if the bulls can break on through or if the bears will end the glory here.
Hit that 👍 button to show support for the content!
Help the community grow by giving us a follow 🐣
-----
Support:
S1: The first support level is the S1 orderblock. Anything more than a quick wick down to here breaks our current bullish structure of higher lows. So even though there is support here, it should be viewed cautiously.
S2: The S2 S/R flip is a logical place to find support. The momentum of the current move would be lost here, but that doesn't mean this support can't or won't hold.
S3: If needed there is also the S3 orderblock range. Anything below this changes our overall bullish outlook on IOTX.
Resistance:
R1: The R1 orderblock at the previous swing high is our first point of resistance. We'll be looking for this to act as support once broken.
R2: The R2 high from the initial move up back in May is the last point of resistance. What the bulls will want to see is a move up to R2, support found at R1, and then a push higher through the Multi-timeframe resistance noted below.
Daily Multi-Timeframe:
There is a major price pivot point that is currently acting as resistance. It is the potential to break this and for the USDT pair to make new highs that has us excited. Let's go bulls!
BTC 4h Multi-Timeframe:
You can see that the current daily USDT range is also significant on the 4h for the BTC pair. While there is a rather large range here to consider, this chart illustrates what we are looking for. We want to see an ABC move above this resistance, with a retest of it, before moving higher.
-----
Summary:
This play is all about breaking resistance with the current momentum, so a retest of lower ranges is pretty far outside the scope of what we are looking for. We want to see a run now, do you think we'll get it?
Resources:
cryptobriefing.com
✨ Drop a comment asking for an update, we do NEW setups every day! ✨

IOTX looking BEARISH1. MACD histogram showing the bearish divergence.
2.Also the the candle are touching the weekly resistance level. They are going to retrace from there and going to test the daily support at 69. and it breaks 69 we may test 58 daily zone.
3.IOTX has to find a strong support in order to continue the upward trend.
4. Candles have reached the upper layer of Bollinger band, it also indicates the bearish or retracement from here.
5. Volume has also been exhausted which is an indication for bearish movement.

IOTX trading idea. Hello, traders.
We are forming an ascending triangle on smaller time-frames on IOTX, but we are close to an important resistance level.
The ideal is that it breaks the resistance and pullback this new support. That's where we should buy more safely with a definite stop point.
But this asset is very bullish, let's keep an eye on it!
Best regards.
Sandro and Gustavo.
Push the like button and follow us on TradingView.

IOTXBTC | Above 300D EMA [112%]BINANCE:IOTXBTC breaking above the 300D EMA, and also a symmetrical flag break out are the signs that the currency is likely to go higher. According to the previous levels, the coin is likely to give a 112% returns.
Thank you for reading, hope you have a good day!!!

IoTeX (IOTX) Prints Strong ConsolidationIoTex (IOTXBTC) is looking good.
After the recent bullish breakout, which took place in late May, we have a retrace with no strength.
No strength on the retrace is good for the bulls.
We are having strong consolidation and prices trading above EMA10 and all the major EMAs that are shown on this chart... What this means is that IOTXBTC can easily move up .
The RSI is ultra-strong and the MACD is showing a bullish cross... IOTXCBTC can easily resume its uptrend and continue to grow.
Conditions for change
If prices move below MA200 (0.00000044), this analysis is invalidated and a new one is needed.
Thanks a lot for your support.
Namaste.

IOTX DAY TRADE BREAKOUTIOTX has Breakout From a nice Triangle.. i am expecting a breakout move from it..targeting 75 SATS
