GBPUSD H1 compression BUY/HOLD TP1 +100 TP2 +200 pips low risk🏆 GBPUSD Market Update
📊 Technical Outlook
Short-term: BULLS active; resistance forming mid‑1.3600s, consolidation below 1.3600s
Mid-term: Neutral to slight bullish bias; bulls seek 1.3600–1.3700/1.3730 zone
Status: Narrow trading range (tight band) ahead of key UK CPI, Fed & BoE meetings
🔥 Latest Forex Updates
GBP/USD is consolidating in a narrow range around the mid‑1.3500s ahead of this week’s UK CPI and central bank meetings.
The pair holds defensive below 1.3600, with dovish BoE bets capping gains while the Fed is expected to stand pat.
GBP/USD sits near a 40‑month high (~1.3600), boosted by geopolitical risk tone, but lacking momentum to break much higher.
GBP/USD hit ~1.3600 after rebounding from 1.3515 amid renewed Middle East tensions and a weaker US dollar.
Live charts show a mild bullish tilt, awaiting central bank outcomes.
💡 Trade Recommendation
Buy GBPUSD at 1.3530 (recommended entry near 1.3530)
Take Profit at 1.3730 → +200 pips profit target
Stop Loss: 50 pips (around 1.3480)
This trade aligns with the current structure: shallow dip followed by rebound, positioning ahead of central bank catalysts. Momentum above resistance could propel GBP/USD toward 1.3730.
📌 Market Overview
Metric Details
Current Price ~1.3565–1.3600
24H Range 1.3515–1.3600
Central Event Risks UK CPI (Wed), US Retail Sales & Fed (Wed), BoE (Thu)
Geopolitical Middle East tension supports USD weakness, aiding GBP
📈 Forecast Highlights
Support Levels: ~1.3530 (100‑period SMA), ~1.3460, ~1.3425
Resistance Levels: 1.3600, 1.3630 static ceiling, followed by ~1.3700–1.3730 for bulls
🧭 Final Take
GBP/USD sits in a tight range, awaiting central bank clarity. The recommended long trade at 1.3530 aims to capitalize on upside momentum toward 1.3730, supported by technical confluence and a softer USD. Manage risk with a 50‑pip stop loss.
Iran

Markets rally as missiles fly | how long can risk be ignored? Markets may be underpricing Israel and Iran risk.
Despite continued fighting—including high-impact strikes and rising casualties—global equities moved higher to start the week.
U.S. indices led the advance, with the Nasdaq gaining 1.5%, followed by the S&P 500 and Dow. Earlier in the session, European and Asian markets also closed higher, with Germany’s DAX up 0.8% and Japan’s Nikkei rising 1.3%. Now Asian markets are set to open for the second trading day of the week.
Tensions escalated further on Monday as Israel launched drone strikes on Iran’s state-run IRINN television headquarters in Tehran, interrupting a live broadcast. Additional Israeli attacks hit the South Pars gas field. In retaliation, Iran launched a fresh wave of missile attacks into Israel, killing at least five people.

Gold Cooling After Spike – $3375 Key Level to WatchBy analyzing the gold chart on the 4-hour timeframe, we can see that after surging to $3450 amid the Iran–Israel conflict, gold faced a pullback following a liquidity sweep above that level.
Currently, gold is trading around $3392, and after a potential correction down to $3375, I expect to see further upside movement.
⚠️ Stay cautious — gold remains highly volatile and sudden moves are likely!

WTI rebounds from key support as Middle East tensions intensifyThe latest escalation in the conflict between Israel and Iran initially didn't cause much panic in the oil market. After spiking initially to an overnight high of $75.70, WTI has since been on a decline, before hitting a low so far of $68.50. That represents a 9.5% drop from the overnight high, which is massive. Investors have been pricing out the risk of of oil supplies being meaningfully impacted. But the latest air strikes on Tehran and Israel declaring that it had "full aerial operational control" over Tehran means tension are rising another bombardment of Tel Aviv was most likely on the agenda for Iran. Oil has been bouncing back as a result. So far, it hasn't impacted equities, with major US indices remaining near their session highs. But will that change if oil extends it recovery?
Key support at $68.60 has been defended as we can see on the hourly chart. $70.00/$70.10 is now reclaimed, which is a bullish sign. Resistance is seen around $72.20. Above that, $73.00 will be in focus.
By Fawad Razaqzada, market analyst with FOREX.com

BTC is Bullish!Hello TradingView Family / Fellow Traders. This is Richard, also known as theSignalyst.
📈BTC has been overall bullish trading within the rising channel marked in blue.
Moreover, the red zone is a strong structure!
🏹 Thus, the highlighted blue circle is a strong area to look for buy setups as it is the intersection of structure and lower blue trendline acting as a non-horizontal support.
📚 As per my trading style:
As #BTC approaches the blue circle zone, I will be looking for bullish reversal setups (like a double bottom pattern, trendline break , and so on...)
📚 Always follow your trading plan regarding entry, risk management, and trade management.
Good luck!
All Strategies Are Good; If Managed Properly!
~Rich

ETH is doing it AGAIN!Hello TradingView Family / Fellow Traders. This is Richard, also known as theSignalyst.
📈ETH has been overall bullish trading within the flat rising channels marked in blue.
Moreover, the green zone is a strong support zone!
🏹 Thus, the highlighted blue circle is a strong area to look for buy setups as it is the intersection of support and lower blue trendlines acting as non-horizontal support.
📚 As per my trading style:
As #ETH approaches the blue circle zone, I will be looking for bullish reversal setups (like a double bottom pattern, trendline break , and so on...)
📚 Always follow your trading plan regarding entry, risk management, and trade management.
Good luck!
All Strategies Are Good; If Managed Properly!
~Rich

Nasdaq must hold its line, otherwise more downsideMarkets are on edge. The Nasdaq is hovering just above its 200-day moving average and with so much angst in the market, this line must hold. If it breaks, risk sentiment could unravel quickly, and we could see a retest of recent 2025 lows.
The trigger isn’t hard to find. Rising tensions in the Middle East are putting upward pressure on oil and energy. A sustained rally in crude would reignite inflation fears just as central banks begin easing. Powell was supposed to start cutting, but wars are always complicated.
Higher energy costs hit consumers, slow growth and force policymakers to rethink their next moves. That’s a headwind for tech and growth names.
Equities have enjoyed a solid run this year, pricing in a soft landing. But that assumption now feels shaky. Particularly for risky assets like the Nasdaq. The Dow might do better relative. The market isn’t just worried about geopolitics. It’s digesting the reality that inflation remains sticky. Bond yields are rising. Rate cuts are being pushed back. And oil isn’t helping.
If the Nasdaq holds its 200-day line, the bulls stay in control. But a break below will shift the momentum. That’s why this week matters.
We’re watching a simple but powerful signal. Stay above 20,500 and markets can stabilise. Break below, and volatility returns.
This trade is only for the brave. The story is shifting. Stay alert.
The forecasts provided herein are intended for informational purposes only and should not be construed as guarantees of future performance. This is an example only to enhance a consumer's understanding of the strategy being described above and is not to be taken as Blueberry Markets providing personal advice.

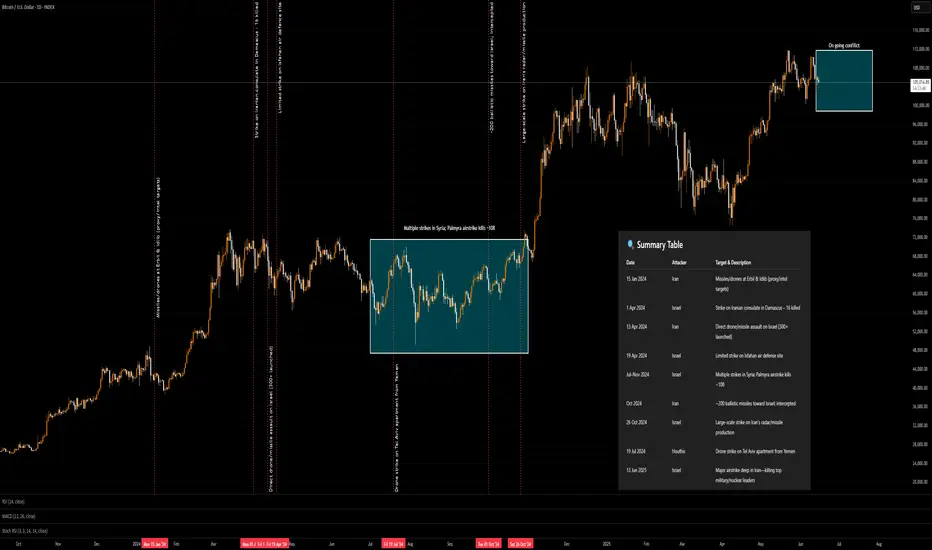
Major Conflict (Isreal - Middleeast and Iran) on CryptoAs you can see crypto is doing its own and what general markets are doing in general. I applied the dates thanks to ChatGPT to make a summary table. you can see these issues over the past two years did not make a huge impact.
The only problem is Iran's response might not be as short as the last time. therefore I am guessing a range of timeframe rather than a vertical line.
Remember any higher escalation will lead the risky assets to dump and off-risk assets rise, such as Oil and Gold.
Usually Summer time is not very profitable for crypto and as I stated in my last Youtube video I am expecting boring price action in June 2025.
This chart can clearly shows, as long as it not become a major international issue and world wide panic, such as 2019 and 2008 it would be scary moments for few weeks at top
Gold: silence on the charts—because the real money already movedThe gold market isn't reacting — it's confirming. The Israeli strikes on Iran? That’s the trigger. But the move started earlier. Price was already coiled, already positioned. All the market needed was a headline. And it got it.
Price broke out of the accumulation channel and cleared $3,400 — a key structural level that’s acted as a battleground in past rotations. The move from $3,314 was no fluke — it was a textbook build: sweep the lows, reclaim structure, flip the highs. Volume spiked exactly where it needed to — this wasn’t emotional buying. This was smart money pulling the pin.
Technicals are loaded:
— Holding above $3,396–3,398 (0.618 Fibo + demand re-entry zone)
— All major EMAs (including MA200) are now below price
— RSI strong, no sign of exhaustion
— Candles? Clean control bars — breakout, retest, drive
— Volume profile above price = air pocket — resistance is thin to nonexistent up to $3,450+
Targets:
— $3,447 — prior high
— $3,484 — 1.272 extension
— $3,530 — full 1.618 expansion — key upside target
Fundamentals:
Middle East is boiling. Iran is ready to retaliate. Israel is already escalating. In moments like these, gold isn't just a commodity — it's capital preservation. The dollar is rising — and gold still rallies. That means this isn’t about inflation, or rates. It’s about risk-off. Pure, institutional-level flight to safety.
Tactical view:
The breakout is done. Holding above $3,396 confirms the thesis. Pullbacks to that zone? Reloading points. While gold remains in the channel and momentum is clean, the only side that matters right now — is long.
When price moves before the news — that’s not reaction. That’s preparation. Stay sharp.

Israel VS Iran War: Oil Spike!Tensions between Israel and Iran have escalated dramatically, with both nations engaging in direct military strikes. Israel launched Operation Rising Lion, targeting Iran’s nuclear infrastructure, missile factories, and military personnel. In response, Iran retaliated with missile attacks on Israel, hitting Tel Aviv and wounding civilians
The conflict stems from long-standing hostilities, particularly over Iran’s nuclear program, which Israel views as an existential threat. The situation has drawn international attention, with the United States distancing itself from Israel’s actions while maintaining strategic interests in the region.
The escalation has raised concerns about a wider regional war, with analysts warning of unintended consequences and further retaliation. The global markets have also reacted, with oil prices surging amid uncertainty.

LMT sky high rocket stock LMT has been experiencing some intense changes in geopolitical conflict for next week. Leading analysts to observe closely LMT price behavior according to avg volume. We’re al expecting LMT to rise just above $520 by next week in order to accommodate some liquidity. Keep buying if not yet more.

Tensions in the Middle East.(Geopolitical and Technical updates)As it was expected there was a deep fall in the market due to Israel Vs Iran tensions. US is also a direct or indirect party to the situation and if there is further escalation other global powers will mostly get involved. Due to the this situation market opened gap down at 24473. What we saw post that is Indian market recovered smartly from that situation to close at 24718. That is a huge 245 point recovery to end the day. This is why colour of the candles throughout the day (As this is an hourly chart are green despite we ended in red. (That is a classic Technical lesson for understanding candle sticks analytics). The closing is above the father line support of 24674 which is a good sign as this will be our support (Strong support for Monday.) I have spent more than 15 years in the Middle East and happen to know a little bit out of my personal experience, having interacted with a lot of locals. Thus I am trying to answer a few questions that might be coming in the minds of may investors including myself.
The Question now are we out of danger?
Answer: Not yet.
Question 2: Why we are not out of danger?
Ans: The geo-political situation is very tense. The scale of Israeli attack was massive and there are clear and present chances of Iran counter attack which has already begun. Israel will respond again and Trump has already said that the next attacks by Israel will be even more fierce. No Iran is no palestine and there would be many countries that might support Iran. Specially China has already hinted support. Russia another ally is busy with Ukraine but you never know.
Question 3: How it goes for the other Middle Eastern countries?
Ans: There are lot of countries with US and Western bases on them. If Iran attacks them there are chances of other Western countries getting into the act too. In addition to some Middle Eastern countries getting into the act for the purpose of self defence. Thus over the weekend the things can get either very tense.
Question 4: What happens to India and Indian markets?
Ans: Today Indian markets have shown a lot of resilience. Global meltdown can affect us to for sure. But as we are neutral (As of now as it seems). The damage to our market hopefully will be minimal. Moreover recovery will be swift once the situation becomes less tense.
Question 5: What should investors do?
Ans: Long term investors can hold on to their long term positions in blue chip stocks. Keep stop losses and trailing stop losses in place for the mid-cap and small cap stocks. If some stop losses are hit or trailing stop losses are hit, you can always buy again as market is not going anywhere. The dip that we might potentially see can be an opportunity for long term investors for bottom fishing again and recalibrating their portfolios. (You can use the current situation to realign your portfolio for buying the trending stocks which have giving good results this quarter or have been giving good results since last few quarters.) Get rid of the stocks that have been dragging your portfolio down. Market has provided another opportunity for a fresh start.
Things you can do:
1) Gold and Silver are always a great option when it comes to uncertain times.
2) Do not give a knee jerk reaction in selling off your winners.
3) Watch the global updates and keep stop losses and trailing stop losses accordingly.
4) Re-calibrate your portfolio
5) If you are sitting on cash use the dip for investing in stocks with long term perspective.
The support for Nifty Remain at: 24674 (Father line support), 24640 (Mid-channel support), 24492 (Trend line support), 24382, 24208 and finally 24077 (Channel Bottom Support). a closing below 24077 will enable and empower bears to Pull Nifty further down.
Resistances for Nifty remain at: 24752, 24818, 24906 (Mother line Resistance), 25043, 25138 and finally 25223 (Channel top Resistnace). Above 25223 Bulls will potentially take over the market.
To know more about Mother Father and Small Child theory, Parallel Channel, Technical and Fundamental analysis and to learn it to master it. Read my book. The Happy Candles Way To Wealth Creation available on Amazon in Paperback and Kindle version. The book is one of the highest rated books in the category and many readers consider it as a Hand Book for Equity investment.
Disclaimer: The above information is provided for educational purpose, analysis and paper trading only. The political commentary is based on personal views and analysis. Please don't treat this as a buy or sell recommendation for the stock or index. The Techno-Funda analysis is based on data that is more than 3 months old. Supports and Resistances are determined by historic past peaks and Valley in the chart. Many other indicators and patterns like EMA, RSI, MACD, Volumes, Fibonacci, parallel channel etc. use historic data which is 3 months or older cyclical points. There is no guarantee they will work in future as markets are highly volatile and swings in prices are also due to macro and micro factors based on actions taken by the company as well as region and global events. Equity investment is subject to risks. I or my clients or family members might have positions in the stocks that we mention in our educational posts. We will not be responsible for any Profit or loss that may occur due to any financial decision taken based on any data provided in this message. Do consult your investment advisor before taking any financial decisions. Stop losses should be an important part of any investment in equity.

live trade and break down 5k profits, 3500 targetGold price sticks to positive bias as sustained safe-haven buying offsets modest USD strength
Gold price sticks to its bullish tone for the third consecutive day on Friday and trades close to its highest level since April 22 through the first half of the European session. Against the backdrop of trade-related uncertainties, a further escalation of geopolitical tensions in the Middle East tempers investors' appetite for riskier assets.

WW3 IS COMING?! Stop kidding me. Today in X and my PM there were a lot of people who were screaming: “Oh nooo war is coming!!!!”
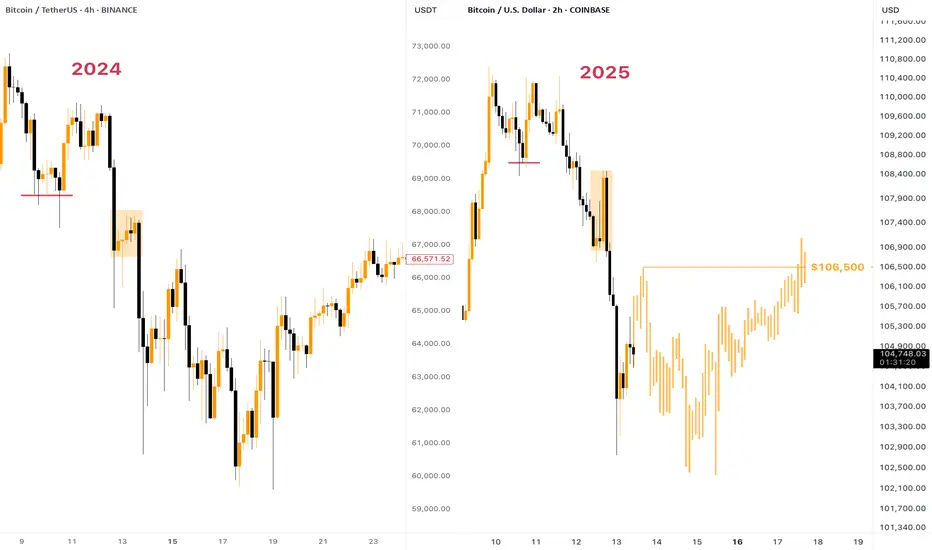
Guys, don’t freak out ahead of time. The same events happened a year ago (13-14th of April 2024) .
I don’t speak any politics here, just facts: Israel attacked Iran, then Iran attacked Israel. Finish. Everyone was afraid that the WW3 is coming, but it ended in a couple of days.
Something similar I expect to happen now too. No one need this war, what’s more - no one has spare billions&billions of dollars to fund it.
As for the chart — some fluctuations above the $101,000 support won’t do any harm to the global picture. More to say, the current chart literally copies the one from 2024: pump from the horizontal support that ended up with dump, then another fake pump and quick massive dump.
Expect to see some consolidation in the $101,000 - $105,000 range, then we can ride upwards.
Peace ✌️
Chasing Oil Spikes? How Geopolitics Can Wreck SetupsOil prices surged over 12% in Asia on Middle East headlines, sparking a surge of volatility across safe-haven currencies and stock market futures during thin trade.
It felt like a good time to provide food for thought to newer traders looking to chase these moves, highlight the mockery geopolitics can make of technical analysis with recent examples, and provide a filter for when the waters may be safer to reenter.
Matt Simpson, Market Analyst at City Index and Forex.com

Iran tensions rise: a setup brewing for gold and oil Geopolitical tensions surrounding Iran might fuel safe-haven demand for gold.
A break above $3,403 might open the door for a test of the May high at $3,437. However, price action over the last two sessions potentially indicates that buyers are reluctant to drive spot prices above $3,400.
At the same time, analysts are suggesting that oil could climb toward $120 if Israel takes military action against Iran. “I don’t want to say it’s imminent, but it looks like something that could very well happen,” President Trump said during a White House event.
Meanwhile, cooler-than-expected US CPI and PPI prints have potentially strengthened expectations that the Federal Reserve could begin cutting interest rates by September, with a second cut possibly following before year-end.

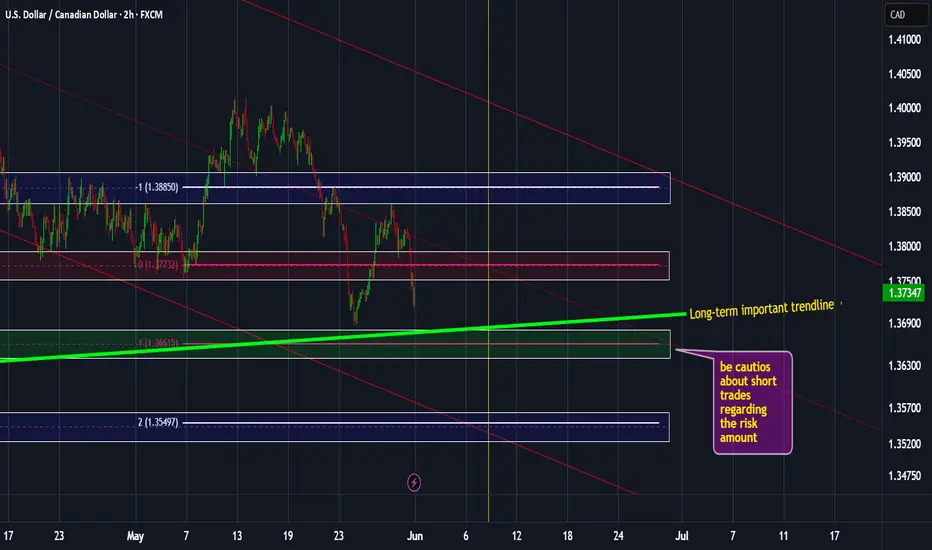
USDCAD weekly analysis: Jun 1, 2025 – Jun 7, 2025Most important news and situations are for this pair.
1st, BOC rate decision week!
2nd, Iran-US negotiations that could make a real difference to oil markets.
3rd, The relatively strong long-term bullish trendline.
*******************************************************************
The indicated levels are determined based on the most reaction points and the assumption of approximately equal distance between the zones.
Some of these points can also be confirmed by the mathematical intervals of Murray.
You can enter with/without confirmation. IF you want to take confirmation you can use LTF analysis, Spike move confirmation, Trend Strength confirmation and ETC.
SL could be placed below the zone or regarding the LTF swings.
TP is the next zone or the nearest moving S&R, which are median and borders of the drawn channels.
*******************************************************************
Role of different zones:
GREEN: Just long trades allowed on them.
RED: Just Short trades allowed on them.
BLUE: both long and short trades allowed on them.
WHITE: No trades allowed on them! just use them as TP points
GBPJPY Signal : 1H / 4H Beautiful buy !!!Hello Traders! 👋
What are your thoughts on GBPJPY ?
Symbol : GBPJPY H1
Market price : 193.20
BUY limit : 192.40 - 192.00
Tp1 :193.40
Tp2 : 194.60
Tp3 : 196.40
Tp4 : 199.60
Sl : 190.80
Don’t forget to like and share your thoughts in the comments! ❤️
Remember this is a position that was found by me and it is a personal idea not a financial advice, you are responsible for your loss and gain.

EURAUD Signal : 1H / 4H Beautiful buy !!!Hello Traders! 👋
What are your thoughts on EURAUD ?
EURAUD
Market price : 1.7330
Buy at : 1.7330 - 1.7310
Tp1 : 1.7420
Tp2 : 1.7520
Tp3 : 1.7630
Tp4 : 1.7880
Sl : 1.7220 ( 100 pip )
Don’t forget to like and share your thoughts in the comments! ❤️
Remember this is a position that was found by me and it is a personal idea not a financial advice, you are responsible for your loss and gain.

GOLD ( XAUUSD ) : H4 / D1 : Big Long !!!Hello Traders! 👋
What are your thoughts on Gold?
After a strong upward move, gold entered a corrective phase upon reaching the $3500 resistance zone.
This correction could offer a buy-the-dip opportunity, with potential for a move back toward the recent highs.
XAUUSD
Market price : 3240
Buy limit : 3140 - 3120
Tp1 : 3240
Tp2 : 3340
Tp3 : 3500
Tp4 : 3750
Sl : 3030 ( 100 pip )
Don’t forget to like and share your thoughts in the comments! ❤️

SIGNAL FOR TRADE IN 15m TIMEFRAMEBTCUSDT prepare for downward trend in 15m timeframe
its my opinion about this chart

Fool trump BTC@Watch and follow the processBitcoin in the 15-minute time frame seems to have a tendency to rise in the short term
And we are in a range of fluctuation

Thanks to STUPID TRUMP the downward trend continuesDo you agree with me that Trump is a narcissistic and crazy man who has decided to destroy the world economy, or is he discrediting powerful people and just lying
