ITC


Clear Down is Vissible upto 179A) 1, 3, 4, Reacts as a sign of Good up movement/ uptrend
( reverse of Rs.179.00 will be a good take off for the
breakout of Rs. 199.00 and the target will be around 220 for shorterm)
B)No. 2, 3a reacts as a continuous downtrend
(if the above fails the price will react at Rs.170 then it will expected
to go down or otherwise it will confirm the next clear trend at around Rs.190.00)
* NOTE- THIS IS MY PERSONAL ANALYSIS AND IT WAS POSTED FOR KNOWLEDGE SHARING BASIS
Clearly this is NOT FOR ANY KIND OF SUGGESTION TO BUY OR SELL.

LTC|USDHello, everyone. Thanks for reading.
You can buy, risk reward is good.
Thanks for reading
Dont foreget to leave a like if you liked my idea

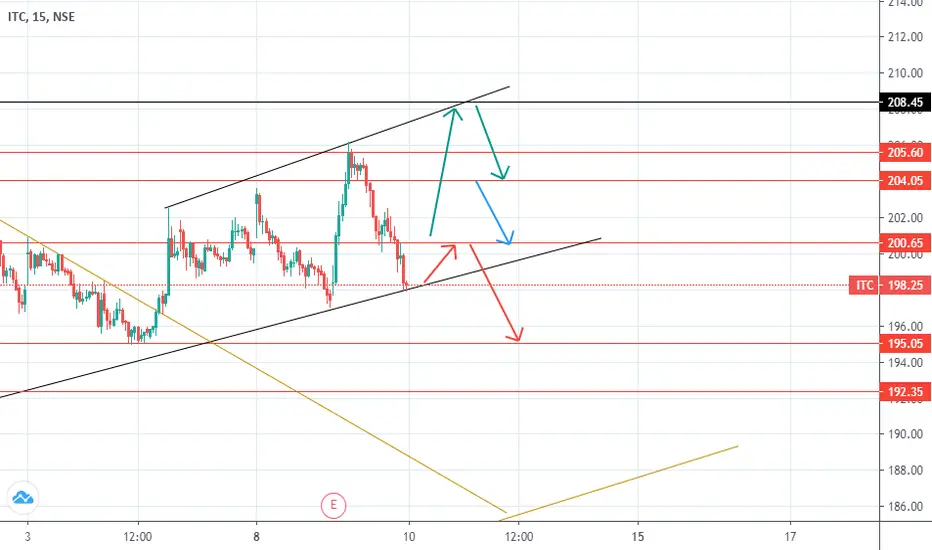
ITC intraday projectionPossible start and reversal levels are shown in different colors with support and resistance levels shown
ITC from 6 June 2020ITC is in consolidation zone . .. with high uptrend possibility higher lows forming
for risk takers buy above 203 ...
...
buy only when rsi above 60 in hourly chart with small target if 210 ..
safe traders buy only when red line becomes support for new trend cycle

ITC rally may halt near 220 levelsNSE:ITC which is in a downtrend in monthly timeframe is currently retracing its excess fall.
But this rally may pause near 220 levels.

ITC - in between support and resistance Resistance @ 200 - Price + Fib + Trend line
Support @ 190 - Previous swing resistance turned support.
Probability - Might go sideways in the range , therefore i am waiting for a breakout/breakdown before initiating any trade.


It still looks good to meHorizontal supports must sustain as of now, my target would be 218.
I kept it far, a bit deliberately as the pattern looks good.

BUY ITC IF IT SUSTAIN 200 LEVELITC break its importance resistance if it will hold 200 level we can see 250 level soon.


ITCFollow us on telegram for live updates t.me/tradeking9_11
Wait For levels tomorrow morning between 9:15 and 10:30.
If it sustain above 195.25 then buy with target of 198.70
If it sustain below 188 then sell with target of 184.50.

ITC symmetrical triangle formation.CORRECTION TIME Maybe !!!Short ITC below 188.50 levels.
Astrologically the market tomorrow should open flat and can fall down. Let's See how it goes.

ITC is read for short if it breaks @185 levelNSE:ITC
ITC is making divergence in multiple timeframes and it's a downtrend.
Sell only if it will break 185 support level.

ITC ::: LONG21 MAY 2020
INSTRUMENT: ITC
TIME FRAME: DAY
OTHER TIME FRAMES FOR CONFIRMATION:
3Hr. 4Hr
INDICATORS AND THEIR TRENDS:
PSAR: Bullish
STOCHASTICS: Bullish
MOVING AVERAGE: Bullish SUGGESTED TREND: Bullish
Technical levels
CMP: 188.89
Sell below: 187.31
SL: 185.55
TARGET 01: 192
TARGET 02: 194
My analysis of ITC is it is expected to gap up tomorrow 21 MAY 2020 and reach a target of 192 to 194. It has the capacity to reach up to 203. If it retraces from 203 to below 195 then would prefer shorting on a long term basis


ITC - Short is still on , stop revised to 165TC - Short is still on , stop revised to 165
Tgt 150 - 145 and 130
Do not follow blindly, please do your own research


simple chart works tiptop 5 year return -27.63%
3 month return -25.84%
something is wrong with this stock.
this company 100% owned by public.

Be-careful long traders on ITC. Price can be trade in range.
long-term trend is downward
expected no trading activities above attraction line.
price can rest between lower bound and attraction line.
project will help to how stock can perfect.
Advised to traders and investors: be careful to take long.
