Jade Lizard on PLTR - My 53DTE Summer Theta PlayMany of you — and yes, I see you in my DMs 😄 — are trading PLTR, whether using LEAPS, wheeling, or covered calls.
I took a closer look. And guess what?
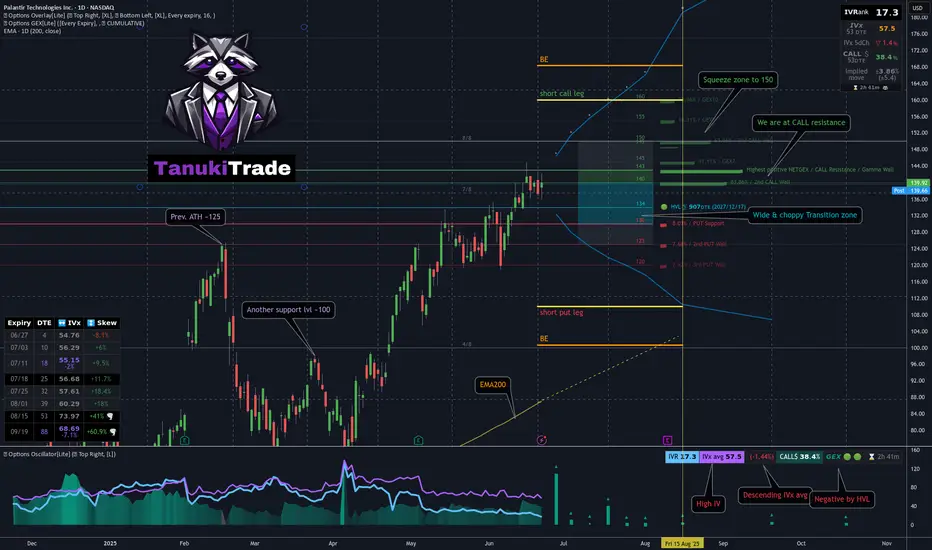
📈 After a strong move higher, PLTR was rejected right at the $143 call wall — pretty much all cumulative expiries cluster resistance there
Using the GEX Profile indicator, scanning all expirations:
After a brief dip, the market is repositioning bullish
Squeeze zone extends up to 150
The most distant GEX level is sitting at 160
On the downside, 130 is firm support, with some presence even at 120 — the market isn’t pricing in much risk below that
📉 From a technical standpoint:
We’re near all-time highs
125 (previous ATH) and 100 are key support levels
The OTM delta curve through August is wide, and the call side is paying well — with a current call pricing skew
🔬 IVx is at 57, trending lower + call pricing skew📉 IV Rank isn't particularly high, but the directional IVx matters more here
💡 Summer Theta Play: Jade Lizard on PLTR
Since I’ll be traveling this summer and don’t want to micromanage trades, I looked for something low-touch and high-confidence — and revisited an old favorite: the Jade Lizard.
If you're not familiar with the strategy, I recommend checking out Tastytrade's links and videos on Jade Lizards.
🔹 Why this setup?
Breakeven sits near $100, even with no management
On TastyTrade margin:~$1800 initial margin ~$830 max profit
53 DTE — plenty of time for theta to work
Earnings hit in August — I plan to close before then
Covers all bullish GEX resistance zones
Quickly turns profitable if IV doesn’t spike
Highly adjustable if needed
My conclusion: this strategy covers a much broader range than what the current GEX Profile shows across all expirations — so by my standards, I consider this to be a relatively lower-risk setup compared to most other symbols right now with similar theta strategies.
🔧 How would I adjust if needed?
If price moves up:
I’d roll the short put up to collect additional credit
Hold the call vertical as long as the curve supports it
If price drops:
Transition into a put ratio spread
Either extend or remove the call vertical depending on conditions
🛑 What’s the cut loss plan?
I have about 20% wiggle room on the upside, so I’m not too worried — but if price rips through 160 quickly, I’ll have to consider early closure.
If that happens, the decision depends on time:
If late in the cycle with low DTE:→ Take a small loss & roll out to next month for credit
If early with lots of DTE remaining:→ Consider converting to a butterfly, pushing out the call vertical for a small debit→ Offset this with credit from rolling the put upward
As always — stay sharp, manage your risk, and may the profit be with you.
See you next week!– Greg @ TanukiTrade
Ivrank
06/02 Weekly GEX Analysis - 6000 Looks EasyThe biggest event last week was undoubtedly the court ruling involving Trump. The market responded with optimism, and on Thursday premarket, SPX surged toward the 6000 level — only to get instantly rejected. That strong rejection suggests this is a firm resistance zone.
From the GEX expiry matrix, it's clear that the market is hedging upward for this week, but downward for next week. To me, this indicates that while the near-term GEX sentiment remains slightly bullish, the market may be preparing for a pullback or retest in the medium term.
This week, SPX has already entered a GEX zone surrounded by positive strikes — up to around the 6000 level. That makes 6000 an “easy target” for bulls, and we’ll likely see profit-taking here, just like we did last Thursday premarket.
⚠️ However, if we look more closely at the weekly net open interest:
...we can see a strong bullish net OI build-up starting to emerge around the 6100 level — a price zone that currently feels distant and even unreachable. But if the 6000 resistance breaks, we could see a fast gamma-driven squeeze up to 6050 and possibly 6100 before the next wave of profit-taking kicks in.
As is often the case during bullish moves, the market seems blind to the bigger picture — no one’s looking down, only up. The mood is greedy, and momentum favors the bulls... for now.
Never underestimate FOMO — but also never underestimate Trump. He’s unlikely to accept the court’s decision on tariffs quietly. Any new negative headline could shake the market, no matter where price is sitting…

[05/27] Weekly GEX Outlook for SPX⚠️ Unbalanced GEX & Institutional Hedging – A Closer Look
I haven’t seen such an asymmetric GEX setup in quite a while — and it’s definitely not a pretty one 😬. The current profile suggests a highly skewed positioning in the market:
📍 Massive upside expectation:
It feels like the market is almost exclusively preparing for a move toward 6000.
🛑 Limited downside protection:
Below the current level, there's very little hedging in place — especially unusual with Friday’s expiry approaching.
🔻 Current Key Zone: 5925-5930
The largest put open interest is sitting right around 5925, which is also close to spot.
Below that? Things get murky. The GEX profile becomes fragmented and mixed, with no clear put support until much lower.
Interestingly, most of the current downside hedging is clustered around the 5900–5925 range, which includes ITM puts — not OTM, as you’d typically expect from retail.
🧠 Institutional Footprint vs. Retail
This hedging pattern — closer to ATM rather than deep OTM — suggests institutional players are managing downside risk with precision.
In contrast, retail traders don’t seem to be actively hedging the downside with OTM puts, which is a notable shift from typical behavior in high-IV weeks like this.
🔼 What to Watch: The 5930 Breakout
If SPX can break and hold above 5930, it enters a clear, call-dominated zone.
From there, the path to 6000 looks much cleaner, with lighter resistance and the potential for a gamma-driven push 📈.
The details show the same picture when examining more details:
SPX conclusion
😬 In short: we’re at a tipping point.
Below 5900, hedging is tactical and institutional.
Above 5900, the path is open to 6000 — but only if bulls can take control at 5930!

04/28 Weekly GEX AnalysisDETAILED IMAGE:
Here’s what the charts and indicators are showing right now until Friday.
We are approaching a key breakout zone.
🐂 🟢 IF the market breaks above the white bearish daily trendline, the next bullish target could be between 5515–5680.
🟦 ⚖️ The chop area is between 5435–5515.
Expect more back-and-forth moves here if the breakout fails.
🐻🔴 Watch out: if the price drops below 5435 or 5425, there’s little support left.
This could trigger a sharp sell-off ("Bearish Armageddon" scenario).
GEX profiles remain positive 🟢 across all near expirations — for now — suggesting that underlying support still exists, but we need to monitor any changes closely.
IVRank is still relatively high (30.9), meaning options are priced with a decent amount of implied volatility.
🟢Short-term sentiment is currently bullish, with some speculative activity picking up.
This suggests that traders are expecting less volatility over the next month compared to what we saw in the past week.
However, if we look at institutional positions focused on longer-term expirations (especially beyond 30 days on SPX/AM maturities), the picture remains bearish 🔴 or at least highly volatile.
These players are still strongly hedging against downside risks.
This confirms the broader point:
Even though price action managed to recover to pre-tariff-announcement levels — with very low trading volume — we’re not out of the woods yet.
Until we can break and hold above the key resistance bearish trend with HIGH BUY VOLUME (aka. momentum), we shouldn't expect a strong, stable GEX profile across all expirations like we had in the past.

GEX Analysis & Options “Game Plan”🔶 Short- and longer-term perspective in a high IV, negative GEX environment
🔶 KEY LEVELS & RANGES
Spot: 221
Gamma Flip / Transition: around 250 (the turquoise zone on the chart)
– This zone typically marks a “power shift.” If price decisively breaks above 250 and holds, market makers’ gamma positioning could flip from neutral/negative to positive.
Put Support: 200
– A large negative gamma position has accumulated here, making 200 a strong support level. If it breaks, the downside may accelerate.
Call Resistance: 400
– A major long-term “call wall” where a significant amount of OTM calls are concentrated. It’s more relevant to LEAPS; currently far from spot, so not a realistic short-term target.
Call Resistance #2: 300
– A medium-term bullish objective, still above the 200-day MA. You’d need to be strongly bullish to aim for ~300 by May (e.g., going for a 16-delta OTM call).
Short-Term / Intermediate GEX Levels:
– There are gamma clusters around 220–230 and 250–260 . These areas often see higher volatility, possible bounces, or stalls (chop) due to hedging flows.
🔶 WHATEVER SCENARIO – SHORT TERM (0–30 DAYS)
A) Upside Continuation / Rebound
– If TSLA closes above 225–230 , the next target is 240–250 (transition / gamma flip).
– If it breaks above 250 and holds (e.g., successful retest), market makers may shift to “long gamma,” fueling a quicker move to 260–270 .
– Resistance: 250, 300, with an extreme LEAPS-level at 400.
B) Downside Move / Bearish Break
– If price dips below ~220 and sustains, the next targets are 210–200 (major put wall / negative gamma).
– If 200 fails, negative gamma may magnify the sell-off. It’s an extreme scenario but still on the table given high IV and macro/geopolitical risks.
– Support: 210, 200 — likely stronger buying interest near 200, possibly a short-term bounce.
– The options chain suggests near-term hedging via puts for this scenario.
C) Chop / Sideways
– If TSLA stays in 210–230 , market makers (short options) might benefit from high IV/time decay.
– Negative GEX, however, can trigger sudden moves in either direction; caution is advised.
🔶 LONGER-TERM FOCUS (6–12 MONTHS, LEAPS)
NET GEX = -61.97M (negative territory) suggests longer-dated positioning is also put-heavy or carries notable negative gamma.
HVL / pTrans = 250 is a key pivot; cTrans+ = 400 is distant call resistance. Between these levels, there’s a mix of put/call dominance.
If Tesla undergoes a fresh growth phase (AI, robotaxi, energy storage, etc.) and clears 250/300 , 400 could become the next significant call wall — but that’s more of a multi-month horizon.
🔶 STRATEGY IDEAS (High IV Environment)
1. Short-Term Bearish
– If you’re bearish and expecting TSLA to test 220–210, consider a bear put spread or net credit put butterfly (lower debit) to leverage high IV.
– Targeting 200, but keep in mind negative gamma may accelerate downside movement.
2. Medium-Term “Contra” Bullish (bounce to 250)
– If GEX suggests a bounce off 210–220, consider a bull call spread (e.g., 220/240) or a net debit call butterfly (220/240/250).
– Be mindful of sudden swings, as we remain in negative gamma territory.
3. Longer-Term Bullish (>3–6 months)
– A call butterfly with upper strikes around 300–350 offers capped debit and higher potential payoff if a bigger rally materializes.
– A diagonal spread (selling nearer-dated calls, buying further-out calls) exploits elevated front-end IV.
4. Neutral / Range-Bound
– If TSLA stays in 200–250 , you could use Iron Condors (e.g., 200/260) to benefit from time decay and any IV collapse.
– Exercise caution: negative gamma can generate abrupt, directional moves, making a neutral stance riskier than usual.
🔶 ADDITIONAL NOTES & “BIG PICTURE”
High IV & Negative GEX: TSLA has a track record of large swings. Negative GEX can intensify sell-offs, while forced hedging might trigger rapid rebounds.
Preferred Structures: With expensive premiums, spreads (vertical, diagonal) and butterfly configurations generally fare better than plain long options (less vulnerable to time decay).
Potential Catalysts: AI announcements, Autopilot breakthroughs, new product lines, and macro changes can swiftly alter market dynamics. Keep tracking GEX updates and news flow; TSLA tends to respond dramatically to fresh developments.
🔶 Bottom line: From 221 spot, watch 210–200 on the downside and 240–250 on the upside short term. Medium-term bullish target = 300 , while 400 remains a far LEAPS scenario. High IV + negative gamma = fast, potentially volatile moves — so risk management and spread-based approaches are crucial.

[02/10] SPX – GEX Until the First Weekly ExpirationThe SPX opened with a huge gap-down in both the futures and CFD markets. After the previous two Fridays, there was a massive gap-down in the premarket each time. Everyone was expecting the same scenario again, but it seems the market quickly recovered from the put support at the 6000 level, and we are now steadily moving toward the positive GEX range.
Although we are still in the transition zone (where it’s easy to switch between positive and negative GEX territory), we may soon reach the HVL level at 6060, which, if I had to guess, might be adjusted during today’s premarket update.
The GEX levels align with the technical foundations:
🟢 6090–6100 to the upside is a bullish take-profit zone, and our purely positive GEX range is fairly narrow. If buying pressure is strong, above 6100 we could see a very strong positive gamma squeeze upward.
🔴 To the downside, “armageddon” could begin if the put support around 6010–6000, which held the sell-off this morning, fails to hold. The next target in a negative gamma squeeze could be 5950, followed by 5900.
The transition range is quite wide, and the market is expecting a volatile week (though I believe that from now on it’ll expect volatility every day for the next four years...).
The transition zone is sure to narrow by Friday. It’s worth paying attention to the premarket update around 6:45 AM, about three hours before the market opens!
If the red zone extends very deep afterward (for example, if it’s red below the HVL level all the way to the put support at around 5950), it indicates a significant downside risk compared to any potential rally—which I don’t think will change unless we get a breakout above 6100.
🔶 So, be cautious with those bullish horns—below 6100, we can’t talk about a confirmed breakout to the upside.

[02/03] SPX Weekly GEX OutlookSPX shifted into a strong sideways trend after recent market whipsaws, but premarket today saw a sharp sell-off.
Now, let’s break down the GEX levels set for Friday’s weekly expiration (first weekly expiry). These are already reflected in today’s GEX data—check them on your indicator!
COMMENT: This week, we’ve started updating our seamless GEX & options indicators before the market opens . This has been a long-standing request from users—especially 0DTE traders, who will likely benefit the most.
Key GEX Levels for SPX
📍 Highest Positive Call Wall (Call Resistance): 6075
Acted as resistance last Friday, as it often does initially.
📍 Sideways Zone: 6000-6070 (Transition Zone with GAMMA flip)
Wide Transition Zone → Expect high volatility or slow drifting within this range.
Easy flow between positive and negative GEX profiles, meaning potential sharp moves in either direction.
📍 Put Support (Sum 4DTE): 5900
Very deep support—market is clearly pricing in fear of a potential future drop.
📌Below 6000, there are only negative NetGEX strikes down to 5900, which signals a lack of strong support until that level.
What This Means for the Week
📊 SPX opened (gapped down) in negative GEX territory—if buyers don’t reclaim this zone, we are in for a highly volatile week, potentially with a spiking VIX.
🚫 No reason for bullish optimism unless we break above 6070—until then, expect uncertainty and potential downside pressure.
PS: FINAL GEX ZONE COLORING SHEET

[02/03] TSLA GEX Outlook for February expiration📌 Key Levels & GEX Insights
Gamma Flip Zone: ~400 (until Febr expiration)
Tight Transition Zone, Wide Clear Movement Range
Above 420 Call Resistance : Every strike has positive Net GEX, meaning a return to this range would likely support further balanced upside or sideways movement.
Below 375 : The next PUT support is at 350, so a break below this level could open the door for a deeper drop.
There are 3 weeks until expiration. IV and IVR remain high even after earnings.
Despite today’s selloff, the high call pricing skew is still attractive if we want to collect credit.
In this case, a call butterfly or broken-wing call butterfly could be worth considering—but strictly based on GEX levels.
PS: FINAL GEX ZONE COLORING SHEET

[02/03] AAPL GEX Outlook for February expirationWhile iPhone sales faced some challenges, Apple’s diversified revenue streams and high-margin services business continue to showcase the company’s resilience. The stock initially reacted positively after earnings, but the broader market disagreed during open hours, leading to a sell-off on Friday.
Now, let’s analyze the GEX chart together. For NASDAQ:AAPL , I’ve chosen the First Monthly Expiration (Febr 21), as multiple high gamma exposure expirations align with this date. Since we trade stocks and ETFs over a broader timeframe, rather than day trading, this is the most relevant perspective.
Key GEX Levels & Market Implications
📌 Uncertainty Below 250
Friday’s sell-off and today’s premarket action have weakened the outlook.
GAMMA FLIP ZONE:
AAPL is currently in the 230-237.5 Transition Zone, meaning price action can shift quickly in either direction.
📌 Break Below 230?
A move below 230 would open the door to 220.
📌 Put Support at 220
Implied volatility (IV) remains high, making this an attractive setup for a potential neutral post-earnings trade.
With a 220-250 range, we remain well inside the OTM 16-delta zone for March expiration, which is ideal for premium selling strategies for high IV.
PS: FINAL GEX ZONE COLORING SHEET

Weekly GEX Insights: 01/13 SPX dropTotal Correction? What Can an Options Trader Do in This Situation? How Far Might We Fall This Week? We’ll tackle these questions in this week’s options newsletter!
It looks like the new president hasn’t even been sworn in yet, but the market is already reacting with fear to every statement he makes. Last week’s economic data didn’t help ease those concerns either.
SPX Weekly Analysis
Friday’s red candle set a bearish tone heading into this week. Everyone is predicting and pricing in a potential market apocalypse, and I keep getting the same question: “Greg, how far can we fall?”
My answer remains the same: we can fall indefinitely—nobody can know for certain ahead of time.
What we can do, however, is analyze our charts and use the our weekly GEX profile to identify the key levels, so we can better understand the market’s dynamics.
Examining expirations through Friday, every NETGEX profile is negative , so we can expect volatile movements this week. We’re currently trading below the HVL level, which means that market makers are likely to move in tandem with retail traders. This typically results in bigger swings.
We already saw this heightened volatility last week—just look at the size of the candles, and you can tell how quickly sentiment can shift.
Below 5965 (the HVL level), we are in a high volatility zone what lies underneath?
1st Support Range: 5780–5800
5800: Currently the strongest PUT support level on the downside. A correction may pause here due to profit-taking.
Right beneath this level is the previous gap-fill zone. Remember, these areas function as ranges rather than single lines, as I’ve highlighted down to 5780. This could easily be a take-profit target for traders playing gap fills—an approach that’s quite popular.
2nd Support Range: 5700–5650 (Very Strong)
Starting at 5700: We encounter another robust PUT support zone.
This area is reinforced by previous lows, previous highs, and the 4/8 grid boundary from our indicator.
Even if nowhere else, many expect at least a local rebound to occur within these levels.
Putting it all together, it’s clear that the weekly trading range is shaping up to be roughly between 5680 and 5965, expecting big & volatile moves.
Remember, CPI and PPI data are coming out on Tuesday and Wednesday, which could trigger additional volatility.
When looking at SPX, SPY, or /ES futures, my opinion is that the rapidly spiking implied volatility (IV) during a market drop, along with a PUT pricing skew, can present favorable opportunities for options traders. The distance to the strongest lower support zone is around 100–150 points, so you could:
Trade directionally for the short term—hoping to be either right or wrong quickly, or
Try to profit from the market situation in a more strategic way (which is what I typically do).
Personally, I prefer the second approach:
I’ll open short-term (a few days) credit put ratio spreads for a small credit, which gives me a wide breakeven range and a big “tent” on the downside.

12/09 Weekly SPX InsightsLast week’s assessment aligned well with the anticipated positive SPX range. The index moved sharply up toward the 6100 area, yet as Friday’s session progressed, the call resistance around 6100 capped further upward momentum.
Looking ahead, I have doubts that the previously unbridled optimism will persist. Currently, we find ourselves in a “chop zone,” suggesting that the short-term direction is less clear.
In aggregating GEX (Gamma Exposure) levels and examining the landscape a week out, it appears that 6100 remains a strong call resistance level. Meanwhile, the HVL (High Volatility Level) has crept closer to around 6080, placing the market uncomfortably close to a higher-volatility environment. Below 6080, the market may experience increased turbulence, potentially retesting 6035 and then 6000.
On the other hand, if the index can break and hold above 6100, an upward gamma squeeze could emerge, pushing prices even higher. Currently, overall GEX sentiment is negative, but the approach toward the HVL zone suggests caution. From these conditions, I’m not expecting a strong, sustained rally in the immediate term.
In terms of intraday and short-term dynamics, 0DTE (same-day expiry) sessions and Fridays continue to hold relatively higher positive gamma exposure compared to other days.
Volatility indicators:
VIX: remains low
IVR (Implied Volatility Rank): also low
Put Pricing Skew: currently low, although it has begun to show a very slight uptick
Key Levels for This Week (for educational reference):
Above 6100: Omni-bullish environment
Between 6100–6065: Chop zone (directionally uncertain; not ideal for unhedged directional trades)
Below 6080: Bearish tilt, with targets around T1: 6035 and T2: 6000 (near the 16-delta OTM put level)
On Wednesday, inflation data is scheduled for release. Anticipation alone may drive volatility, so it’s something to keep on the radar for educational scenario planning.

GEX levels of SPX for Weekly Option TradersAlthough the SPX is currently trading within a relatively neutral positive gamma range, it’s worth taking a closer look at what the week might hold.
This week, SPX is moving between critical resistance and support levels, which are showing significant options activity. The 5900 level is the key CALL resistance, acting as the gamma wall for the next 7 days (7DTE) . This suggests that as long as the price remains below this level, it will face strong resistance in moving higher. If the market breaks through this level, it could signal a bullish breakout, leading to increased turbulence.
🟨 DETAILED VIEW:
In case of a breakout, keep an eye on the second weaker CALL wall at 5925 and the third weaker CALL wall at 5940, which are the next potential resistance levels once the market moves past the 5900 gamma wall. These levels could play a pivotal role in the price’s upward movement and indicate further buying pressure.
🔶 HVL Level and Gamma Environment: 5830
The 5830 level represents the High Volatility Level (HVL), which determines whether we are in a positive or negative gamma environment. If SPX closes below this level, we enter the negative gamma zone, which could lead to increased market volatility. This could result in sharper price movements during the week if this level does not hold. In that case, the PUT supports come into focus.
The 5750 level marks the strongest PUT support, providing substantial downward support for the market. However, before reaching this level, it’s important to consider the emerging PUT wall at 5765, which may stop the price from falling lower. This could act as an intermediate support, slowing or even halting a decline before the 5750 level comes into play.
🔶 Implied Volatility and Time-Based Strategic Opportunities NOW
The decrease in implied volatility, as shown by the IV and IVx indicators, signals a calmer market environment. Based on IV rank and average IV levels, volatility is running lower, which presents good opportunities for various spread strategies, especially time spreads that can be optimized between the 11/01 and 11/04 time frame.
Key levels above could fuel further market movement throughout the week if a breakout occurs. CALL/PUT gamma levels on the options chain strongly outline the potential resistance and support levels, but these levels can change dynamically, especially if SPX breaks through the 5900 level.
🔶 SPX Key Levels This Week:
5900 CALL resistance – Main gamma wall, strong resistance.
5925 and 5940 – Second and third weaker CALL walls, offering additional resistance if broken.
5830 HVL – Key level determining the gamma environment.
5765 PUT wall – Emerging intermediate PUT support, which could slow a decline.
5750 PUT support – Strongest PUT gamma wall and support.
Keep these levels in mind throughout the week, as they will likely influence market movements and the volatility environment. By applying the right options strategies, this information can help you structure profitable positions.

$MSFT iron condor for 33% profit, 83% PoP #tradingHigh IVR, I'm not leaving money on the table.
Max profit: $250
Probability of 50%Profit: 83%
Profit Target relative to my Buying Power: 33%
Max loss with my risk management: ~$200
Req. Buy Power: $755 (max loss without management before expiry, no way to let this happen!)
Tasty IVR: 80 (ultra high for Microsoft)
Expiry: 50 days
SETUP: IC for $MSFT, because IVR ultra high, collecting 2.5cr
* Buy 1 MSFT Jan21' 290 Put
* Sell 1 MSFT Jan21' 300 Put
* Sell 1 MSFT Jan21' 360 Call
* Buy 1 MSFT Jan21' 370 Call
SAFETY ZONES: : Prev. resistance could act as support at ~$306, prev.ATH could act as resistance at $338.
Stop/my risk management : Closing immediately if daily candle is closing out of the the box, max loss in my calculations in this case could be ~$200.
Take profit strategy: 50% of max.profit in this case with auto buy order at 1.25db
Of course I'll not wait until expiry in any case!
If you liked this article, check my other ideas.
Anyway: HIT THE LIKE BUTTON BELOW , and for fresh option ideas FOLLOW ME( @mrAnonymCrypto ) on tradingview !

$ARKF SHORT PUT for Jan21, high PoP 20% profit #ark #optionsAny kind of ETF naked PUTs are my favorite at high IVR.
My choice for today: ARK Fintech Innovation ETF
Reasons:
- high reward for Jan21 monthly expiry (mangeable with rolling) -> collecting credit
- RSI is already oversold
- breakeven point is far
- PUT strike at 0.618 fib
Max profit: $210
Probability of Profit: 89%
Profit Target relative to my Buying Power: 20%
Req. Buy Power: $1035 (max loss without management before expiry, no way to let this happen!)
Tasty IVR: 73 (very high)
Expiry: 38 days
SETUP : NAKED PUT for $ARKF, because IVR is high, for 0.7cr
* Sell 3 $ARKF JAN21'35 PUT
Management : ROLLING if daily candle is closing below of BE.
Take profit strategy : 70% of max.profit in this case with auto buy order at 0.2db
Of course I'll not wait until expiry in any case!
If you liked this article, check my other ideas.
Anyway: HIT THE LIKE BUTTON BELOW , and for fresh option ideas FOLLOW ME( @mrAnonymCrypto ) on tradingview !

$BABA highest IVR in this year = bullish Iron Condor #tradingAlibaba IVR is 170 without event?! No way.. I'm literally waiting these rocket IVR days in this year!
Chinese stocks are dumping hard. Alibaba Group is maybe the biggest and the best to play with some bullish IC.
Max profit: $230
Probability of 50%Profit: 81%
Profit Target relative to my Buying Power: 30%
Max loss with my risk management: ~$200
Req. Buy Power: $770 (max loss without management before expiry, no way to let this happen!)
Tasty IVR: 170 (high for )
Expiry: 49 days
SETUP: IC for 2.3cr, because IVR ultra high
* Buy 1 BABA Jan21' 80 Put
* Sell 1 BABA Jan21' 90 Put
* Sell 1 BABA Jan21' 150 Call
* Buy 1 BABA Jan21' 160 Call
Stop/my risk management : Closing immediately if daily candle is closing out of the the box, max loss in my calculations in this case could be ~$200.
Take profit strategy: 60% of max.profit in this case with auto buy order at 0.92db
Of course I'll not wait until expiry in any case!
If you liked this article, check my other ideas.
Anyway: HIT THE LIKE BUTTON BELOW , and for fresh option ideas FOLLOW ME( @mrAnonymCrypto ) on tradingview !

$USO IronCondor 72%PoP, 45% profit - gift of the day with 176IVRDon't miss the opportunity of the day!
Highest IVR ETF today with the value of 173!
Of course, -5 delta meaning bearish Iron Condor.
SAFETY ZONES: 200MA could act as support, bullish trendline too.
Max profit: $314
Probability of 50%Profit: 72%
Profit Target relative to my Buying Power: 45%
Max loss with my risk management: ~$150
Req. Buy Power: $686 (max loss without management before expiry, no way to let this happen!)
Tasty IVR: 137-173 (ultra high for options )
Expiry: 56 days
SETUP : IC for , because IVR ultra high, for 3.14cr
* Sell 1 USO Jan21' 35 Put
* Buy 1 USO Jan21' 45 Put
* Buy 1 USO Jan21' 55 Call
* Sell 1 USO Jan21' 65 Call
SETUP: IC for USO, because IVR is epic high.
Stop/my risk management : Closing immediately if daily candle is closing out of the the box, max loss in my calculations in this case could be ~150$.
Take profit strategy: 65% of max.profit in this case with auto buy order at 1.1db.
Of course I'll not wait until expiry in any case!
If you liked this article, check my other ideas.
Anyway: HIT THE LIKE BUTTON BELOW , and for fresh option ideas FOLLOW ME( @mrAnonymCrypto ) on tradingview !

$AMD IC 40% Profit and 77% PoP #amd #trading #optionsI'm waiting for this AMD corrention....
* Big red trending candle.
* Reasonable safety S/R zones.
* Long run and now correction.
Why Iron Condor?
Let the bulls/bears to choose direction, I would like to making money in any direction!
Max profit: $286
Probability of 50%Profit: 77%
Profit Target relative to my Buying Power: 40%
Max loss with my risk management: ~$200
Req. Buy Power: $770 (max loss without management before expiry, no way to let this happen!)
Tasty IVR: 94 (very high)
Expiry: 49 days
SETUP: IC for 1.43cr each, because IVR ultra high
* Buy 2 AMD Jan21' 110 Put
* Sell 2 AMD Jan21' 115 Put
* Sell 2 AMD Jan21' 170 Call
* Buy 2 AMD Jan21' 175 Call
Stop/my risk management : Closing immediately if daily candle is closing out of the the box, max loss in my calculations in this case could be ~$200.
Take profit strategy: 60% of max.profit in this case with auto buy order at 0.57db each.
Of course I'll not wait until expiry in any case!
If you liked this article, check my other ideas.
Anyway: HIT THE LIKE BUTTON BELOW , and for fresh option ideas FOLLOW ME( @mrAnonymCrypto ) on tradingview !

$DAL 16% Profit for 16 days? Not bad. #nakedput #daytradingDealta Airlines correction, playing out with naked put option.
Reasons:
- high reward for next monthly expiry (mangeable with rolling) -> collecting credit
- breakeven point is far
- RSI is oversold.
Max profit: $92
Probability of 50%Profit: 78%
Profit Target relative to my Buying Power: 16%
Req. Buy Power: $558 (max loss without management before expiry, no way to let this happen!)
Tasty IVR: 96 (very high)
Expiry: 16 days
SETUP: NAKED PUT for $DAL, because IVR is high, for 0.92cr
* Sell 1 DAL DEC17'32 PUT
Management : ROLLING if daily candle is closing below of BE.
Take profit strategy: 50% of max.profit in this case with auto buy order at 0.46db
Of course I'll not wait until expiry in any case!
If you liked this article, check my other ideas.
Anyway: HIT THE LIKE BUTTON BELOW , and for fresh option ideas FOLLOW ME( @mrAnonymCrypto ) on tradingview !

S&P500 Iron Condor 60% profit 76% PoP50, high IVR for #optionsI just can't resist the very high IVR for large ETFs, like SPY.
My most common strategies these at corrections are the Iron Condors, neutral or negative delta.
SAFETY ZONES: 200MA could act as support, ATH could act as resistance.
Max profit: $375
Probability of 50%Profit: 76%
Profit Target relative to my Buying Power: 60%
Max loss with my risk management: ~$150
Req. Buy Power: $625 (max loss without management before expiry, no way to let this happen!)
Tasty IVR: 49 (ultra high for S&P500)
Expiry: 56 days
SETUP : IC for , because IVR ultra high, for 3.75cr
* Sell 1 SPY Jan21' 420 Put
* Buy 1 SPY Jan21' 430 Put
* Buy 1 SPY Jan21' 480 Call
* Sell 1 SPY Jan21' 490 Call
SETUP: IC for SPY, because IVR ultra high.
Stop/my risk management : Closing immediately if daily candle is closing out of the the box, max loss in my calculations in this case could be ~150$.
Take profit strategy: 50% of max.profit in this case with auto buy order at 1.88db.
Of course I'll not wait until expiry in any case!
If you liked this article, check my other ideas.
Anyway: HIT THE LIKE BUTTON BELOW , and for fresh option ideas FOLLOW ME( @mrAnonymCrypto ) on tradingview !

How Does Implied Volatility Effect Premium Selling Strategies?In this video I address a question from a member of my social media. I wanted to answer this for them and educate others on why paying attention to Implied Volatility is important to your probability of success and your strategy returns if you are employing Premium Selling Strategies (Iron Condors, Credit Spreads, Straddles, Strangles, Butterflies, etc.)

88% PoP #ironcondor for $BABA in chinese crash #option #optionsChinese crash credit play, because of high IVRank.
My Iron Condor Hunter script have signaled a safe entry here.
REASONS:
1) Confirmed bear trend
This is the safe playground of IC for credit.
The backtested 3 years of bullish trend changed.
2) My automatic Iron Condor Hunter script
My Iron Condor Hunter script gave a reliable signal to opening IC position.
To subscibe for free trial of it: please follow and requeast access for free.
Max profit: $188
Probability of 50%Profit: 88%
Profit Target relative to my Buying Power: 23%
Max loss with my risk management: ~$200
Req. Buy Power: $812 (max loss without management before expiry, no way to let this happen!)
Tasty IVR: 81 (very high)
Expiry: 53 days
Buy 1 BABA Sep17' 140 Put
Sell 1 BABA Sep17' 150 Put
Sell 1 BABA Sep17' 220 Call
Buy 1 BABA Sep17' 230 Call
Bearish IronCondor for 1.88cr, Tasty IVRank is extreme high (81 IVR).
Stop/my risk management : Closing immediately if daily candle is closing OUTSIDE the box, max loss in my calculations in this case could be 100$.
Take profit strategy: 65% of max.profit in this case with auto debit order for 0.66db.
Of course I'll not wait until expiry in any case!
If you liked this article, check my other ideas.
Anyway: HIT THE LIKE BUTTON BELOW , and for fresh option ideas FOLLOW ME( @mrAnonymCrypto ) on tradingview !

$SPY BULL short put spread 90% PoP, 20% profit #options #option
After a beartrap switched back to bullish view with large ETF-s.
First of all: SPY
Max profit: $204
Probability for 50% of Profit: %90
Profit Target relative to my Buying Power: 20%
Req. Buy Power: $996 (max loss without management before expiry, no way to let this happen!)
Expiry: 22 days
Buy 3 SPY Jul16' 420 Put
Sell 3 SPY Jul16' 416 Put
Credit Put spread for 0.68cr each.
Stop/my risk management : Closing immediately if daily candle is closing BELOW the box, max loss in my calculations in this case could be 350$.
Take profit strategy: 65% of max.profit in this case with auto sell order at 0.24db.
Of course I'll not wait until expiry in any case!
If you liked this article, check my other ideas.
Anyway: HIT THE LIKE BUTTON BELOW , and for fresh option ideas FOLLOW ME( @mrAnonymCrypto ) on tradingview !

$TAL is oversold, bullish spread with 72% PoP 33% profit #optionLong time waiting for a pullback at this territory....
Today RSI breaking up, volume arrived, but IVR is still very high.
Optimal for some credit put spread.
Max profit: $250
Probability for 50% of Profit: 72%
Profit Target relative to my Buying Power: 33%
Req. Buy Power: $750 (max loss without management before expiry, no way to let this happen!)
Tasty IVR: 80
Expiry: 22 days
Sell 2 TAL Jul16' 22.5 Put
Buy 2 TAL Jul16' 17.5 Put
Credit Put spread for 1.25cr each
Stop/my risk management : Closing immediately if daily candle is closing BELOW the box, max loss in my calculations in this case could be 250$.
Take profit strategy: 65% of max.profit in this case with auto sell order at 0.44db.
Of course I'll not wait until expiry in any case!
If you liked this article, check my other ideas.
Anyway: HIT THE LIKE BUTTON BELOW , and for fresh option ideas FOLLOW ME( @mrAnonymCrypto ) on tradingview !
