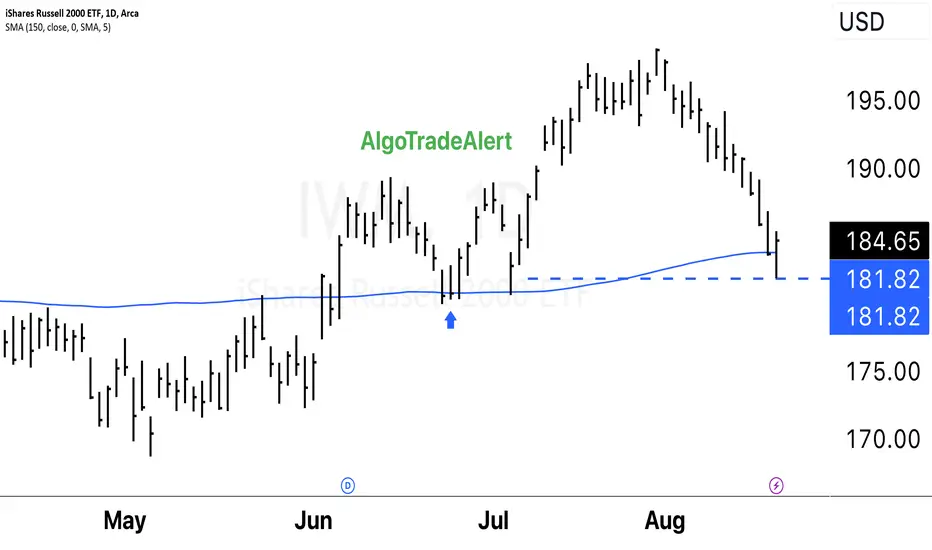
$IWM Bullish Daily Close AMEX:IWM Small Caps had a Bullish Daily Close. Tested my support level. Small caps will lead the broader market. The IWM is more sensitive to liquidity. I have been long since the blue arrow.
A "double bottom" is a bullish reversal pattern that occurs after a downtrend and is characterized by two consecutive lows at a similar price level, followed by a breakout above the pattern's neckline. This pattern suggests a potential reversal from the downtrend to an uptrend.
A "false breakdown" occurs when a price breaks below a support level but quickly reverses and closes back above it. This can be interpreted as a bullish sign, indicating that the selling pressure wasn't sustained, and buyers stepped in to push the price back up.
The idea that "the best moves come from failed moves" is a common adage in trading and investing. It suggests that when a market or a security initially breaks out or breaks down and then reverses, it can lead to strong price movements in the opposite direction. This is often attributed to the idea that traders who were positioned on the wrong side of the initial move are forced to close their positions, contributing to the momentum in the opposite direction.
It's important to note that while these concepts are commonly discussed in trading circles, they are not foolproof strategies. Technical analysis is just one approach to understanding price movements in financial markets, and it should be used in conjunction with other forms of analysis and risk management strategies. Markets can be unpredictable, and there is no guarantee that any pattern or signal will always lead to a profitable outcome.
IWM
NDX - Rising Trend Channel [MID-TERM]🔹Rising trend breaking downwards in medium long term.
🔹Support at 13700 and Resistance at 15800.
🔹Technically positive for the medium long term.
Chart Pattern:
🔹DT - Double Top | BEARISH | 🔴
🔹DB - Double Bottom | BULLISH | 🟢
🔹HNS - Head & Shoulder | BEARISH | 🔴
🔹REC - Rectangle | 🔵
🔹iHNS - inverse head & Shoulder | BULLISH | 🟢
Verify it first and believe later.
WavePoint ❤️

SPY - Rising Trend Channel [MID-TERM]🔹Rising trend breaking downwards in medium long term
🔹Support at 430 dollars, indicating a potential positive reaction as it rises to 477 or more.
🔹Technically positive for the medium long term.
Chart Pattern:
🔹DT - Double Top | BEARISH | 🔴
🔹DB - Double Bottom | BULLISH | 🟢
🔹HNS - Head & Shoulder | BEARISH | 🔴
🔹REC - Rectangle | 🔵
🔹iHNS - inverse head & Shoulder | BULLISH | 🟢
Verify it first and believe later.
WavePoint ❤️

DJI - Rising Trend Channel [MID-TERM]🔹Rising trend breaking downwards in medium long term.
🔹Support level is around 34425, indicating good buying opportunities.
🔹Support at 34200, potentially indicating a POSITIVE reaction, but a break downwards through 34200 indicating a NEGATIVE signal.
🔹Technically positive for the medium long term.
Chart Pattern:
🔹DT - Double Top | BEARISH | 🔴
🔹DB - Double Bottom | BULLISH | 🟢
🔹HNS - Head & Shoulder | BEARISH | 🔴
🔹REC - Rectangle | 🔵
🔹iHNS - inverse head & Shoulder | BULLISH | 🟢
Verify it first and believe later.
WavePoint ❤️

PayPal Long?PYPL has been a slow grinder lower. Each time it gains momentum it somehows manages to lose it.
The only positive thing about this chart is the long divergence that is occurring between price & RSI.
When will this divergence bear fruit? Anyone's guess but you do have it on the daily, Weekly & Monthly time frame.

Upstart Squeeze over?Upstart has completely fallen from the skies.
I took a small speculative long play today at the lows...sizing for loss.
Will this buy now pay later company, bounce now or bounce later?
Even crappy companies see technical bounces.

$COIN Retesting Breakout Area?There is a lot to like about this NASDAQ:COIN chart. First, it has had a long stage one base (about a year). It seems to have established an area of resistance during that basing period. Then on July 11, 2023, it broke-out with big volume, retested the next day the then on July 13th it had the biggest volume day since May 2022. Since that breakout it has consolidated and pulled back to the breakout area on lesser volume. I have no idea if it will take off again, but I like the prospects. See notes on chart for my thought process.
Ideas, not investing / trading advice. Comments always welcome. Thanks for looking.

IWM - Rising Trend Channel [MID-TERM]🔹Breakout resistance 179 in double bottom formation.
🔹Approaches resistance at 198 potential NEGATIVE reaction; upward break POSITIVE.
🔹Technically NEUTRAL for medium long term.
Chart Pattern;
🔹DT - Double Top | BEARISH | 🔴
🔹DB - Double Bottom | BULLISH | 🟢
🔹HNS - Head & Shoulder | BEARISH | 🔴
🔹REC - Rectangle | 🔵
🔹iHNS - inverse head & Shoulder | BULLISH | 🟢
Verify it first and believe later.
WavePoint ❤️

$NFLX Pullback & Breakout?NASDAQ:NFLX looks to be breaking out after a short consolidation period. This pullback, even though it had big initial volume, has been orderly and shallow. I went long ½ size position on Friday July 28 on the gap up open and made it a full-sized position today. See notes on chart for my thinking.
Ideas, not investing / trading advice. Constructive comments always welcome. Thanks for looking. Hope this helps.

$DJI $NDX $SPX $RUT closesHow #indices closed last week.
TVC:DJI
After a BEARISH ENGULFING it then closed Friday with a doji = battle for the bulls and bears which is unresolved
NASDAQ:NDX
Fighting back but it is still showing Negative RSI Divergence.
SP:SPX
Suffering from Negative Divergence. We''ll how #SPX trades over the next few days, weeks. AMEX:RSP (Equal weight) was weaker. This means that the usual big boys pulled more weight.
TVC:RUT needs big move soon, lower highs.
Lots of earnings this week! Have a great trading week!

Potential upsides on RTYWe tried to reject the Weekly trend line but looks like it was a fake out and we might see a breakout.
We are sitting right at the weekly trend line with a bull flag on the daily timeframe
Entry - 1990
Stop - 1960 (I would like to see a daily close below this level)
First target - 2050
Final Target - 2100
Please share your views. Happy trading!

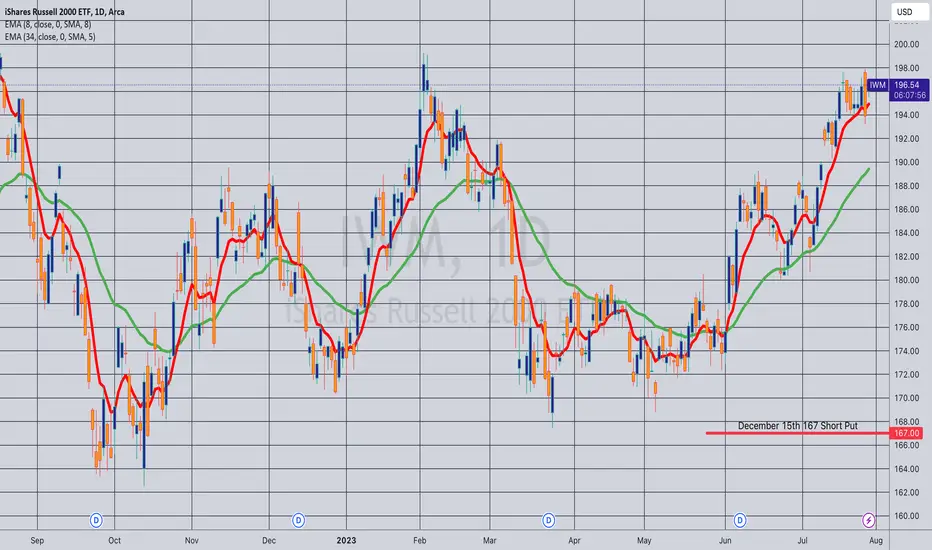
Opening (IRA): IWM December 15th 167 Short Put... for a 1.74 credit.
Comments: Going ahead and rounding out my broad market fourth quarter rungs here with an eye to adding in shorter duration if we ever get higher IV.
Targeting the <16 delta strike paying around 1% of the strike price in credit to emulate dollar cost averaging into the broad market.
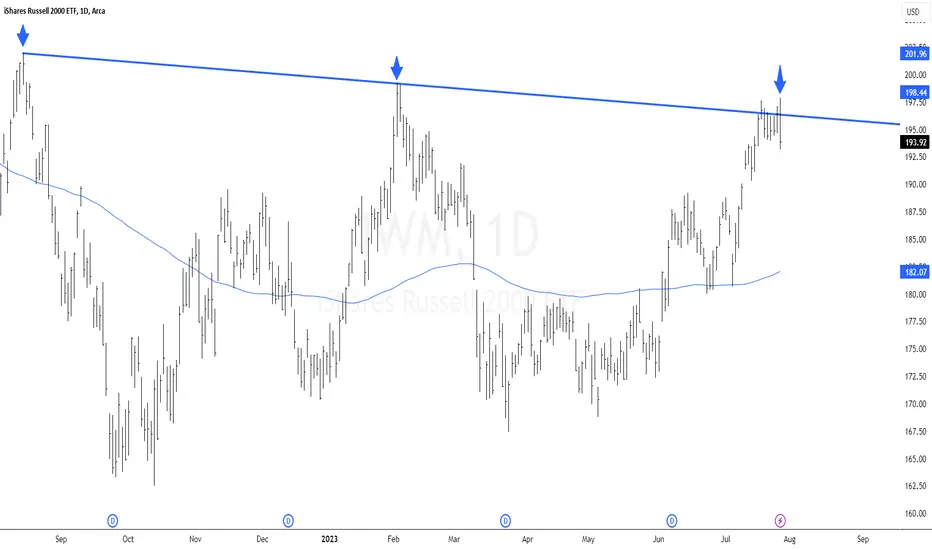
$IWM Trend Line TestAMEX:IWM Trend Line Tested
The Russell 2000 index tested its trend line today. This is a significant level, as it is the second time that the index has bounced off of this trend line in that started last year in August 16, 2022.
IWM Bearish Engulfing +5 CandleThe IWM ETF which tracks the Russel 2000 index put in an outside reversal, or bearish engulfing, candle today which eclipsed the 6 prior daily candles. When the body of a price candle completely engulfs the prior candle it is called a bearish engulfing candle. Since todays candle also engulfed the 5 candles prior to yesterdays it is called a bearish engulfing plus 5 candle(BE+5), for a total of 6 candles that were eclipsed by todays candle. The more candles that are engulfed by an outside reversal candle the more bearish the move and outlook.
Raising your stop-losses and/or taking some short bets against the market isn't a bad move here on an outside reversal day like today was, especially if markets close down going into the weekend. If markets close red on a Friday, they tend to close red the following Monday as well.

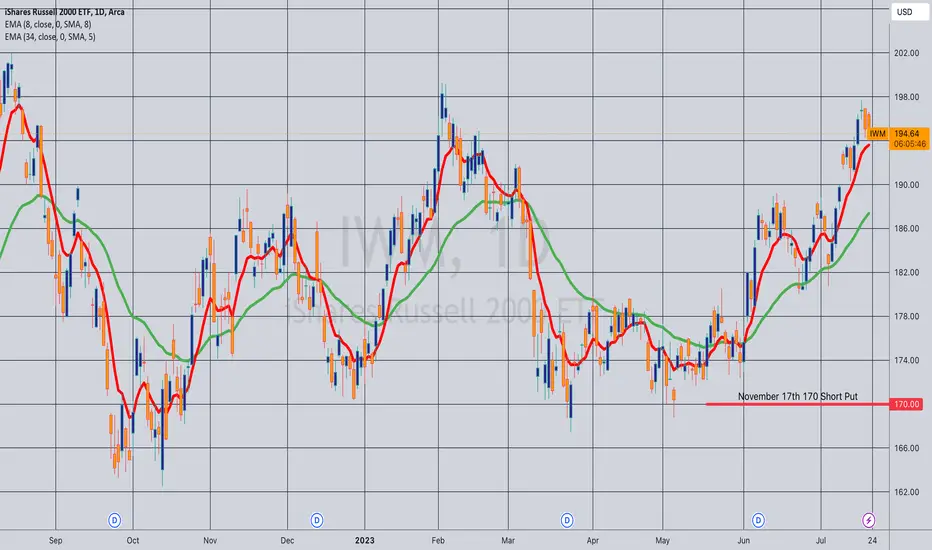
Opening (IRA): IWM November 17th 170 Short Put... for a 1.74 credit.
Comments: My weekly IWM short put in the shortest duration contract where the <16 delta is paying around 1% of the strike price in credit to emulate dollar cost averaging into the market without actually being in stock.
The fact that I'm having to go out to November to do this is a testament to how crappy premium is at the moment, but will look to add in shorter duration should we get an uptick in volatility and/or weakness.
Opening (IRA): IWM October 20th 166 Short Put... for a 1.73 credit.
Comments: Targeting the <16 delta strike in the shortest duration paying around 1% of the strike price in credit to emulate dollar cost averaging into the broad market.
As usual, will look to add in shorter duration and at lower strikes if we ever get an uptick in volatility at some point.

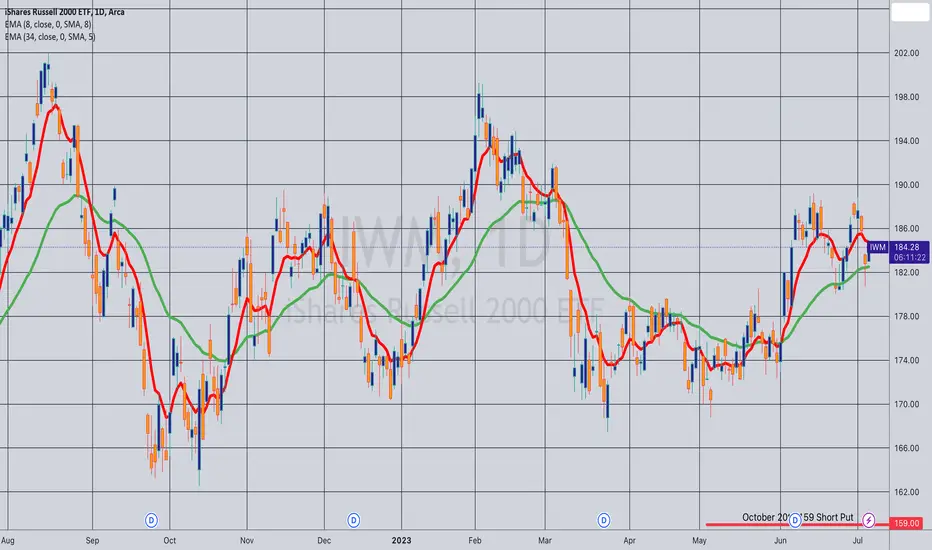
Opening (IRA): IWM October 20th 159 Short Put... for a 1.61 credit.
Comments: Targeting the <16 delta strike in the shortest duration paying around 1% of the strike price to emulate dollar cost averaging into the broad market.
RTY | IWM | InformativeCME_MINI:RTYU2023
If the price of RTY breaks above the bullish line of 1947.4, it may indicate a bullish signal, suggesting potential upward price movement. In this scenario, the target price could be set at 1964.5.
Conversely, if the price of RTY breaks below the bearish line of 1937.5, it may suggest a bearish signal, implying potential downward price movement. In this case, the target prices could be set at 1932 and 1919.

How To Make Money playing lagger Bull Stocks- XBI IWM ARKK FXI these sectors may play lagger bull catch up soon if market continues to run
- PYPL BABA and other growth stock names may as well.

$VTR Broke Out June 29thNYSE:VTR broke out with a bullish engulfing candle on June 29. I like that breakout because of the engulfing candle, it took back the 40-week MA (White), it broke the downtrend line. NYSE:VTR was on my radar, but I missed the breakout on the 29th. I did start a ¼ sized position on the 30th on the pullback (in at 47.43). I added again today at $48.08 for a ½ size trade. This may be a little stretched for a new position here, but you may want to put this on your watchlist for any pullback / consolation entry, assuming it aligns with your trading plan. (My idea, your money). If you do wait for a pullback or a consolidation sideways, which may or may not happen, make sure you buy when it starts to move back up. I’ll look to build this to a full position on pullback or consolidation as mentioned. I don’t usually set targets, but I think this can run back to the $52 area before it hits much resistance. All TBD.
Ideas, not investing / trading advice. Thanks for looking. Constructive feedback welcome.

$PATH Breaking Out of Consolidation?I have a small position from July 11 on regaining all shorter-term MAs in anticipation of a new breakout. It looks as though that may be happening today. See all my notations on the chart. What I like about this is that we have a nice long base lasting about 9 months. The 18 Month AVWAP is now right at the area of resistance and price is over both. The chart shows a higher low which is indicative of an uptrend. Notice the first breakout failed. That has been happening a lot this year. Often the second or third attempt works.
I will be looking to add to my position with any consolidation over the now (hopefully) support area. My stop is close below the 21 EMA (Blue).
Ideas, not investing / trading advice. Constructive feedback always welcome. Thanks for looking. Hope it helps.

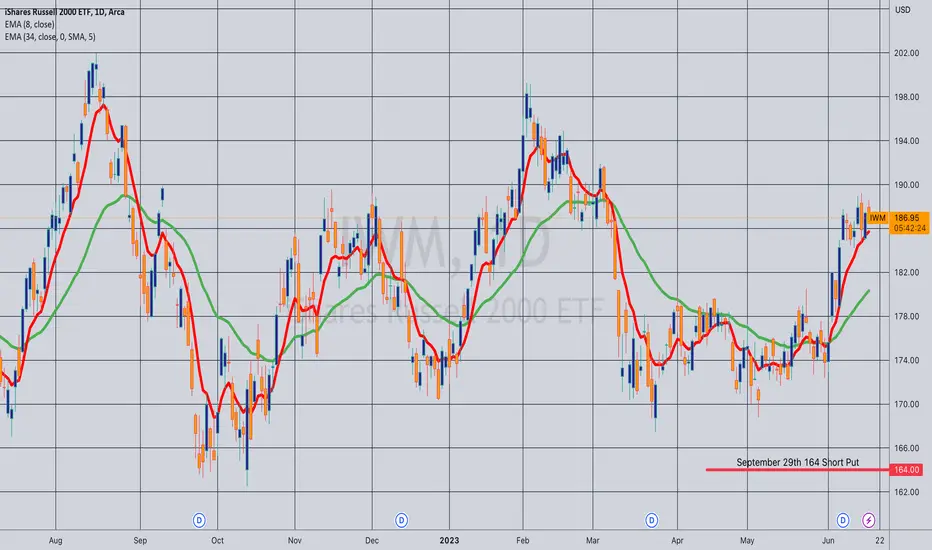
Opening (IRA): IWM September 29th 164 Short Put... for a 1.69 credit.
Comments: Selling premium in the shortest duration where the <16 strike pays around 1% of the strike price in premium.
This is less than ideal; you generally want to sell on weakness/higher IV, but am looking to keep theta on and burning. Will naturally look to add rungs in shorter duration/higher IV should the <16 strike start to pay.
IWM Russel 2000 - No Love For Small CapsI hadn't really looked at IWM until a follower asked me about it on Twitter, and after thinking about it for a few hours and comparing it against SPY and QQQ, I realized that it's not that IWM is lagging, it's that it's not going to follow the recent mania.
Some wisdom I heard recently is that breadth is important in markets because it indicates a large amount of liquidity has entered or left, indicating the emergence of new bull and bear markets.
Unfortunately, with the exception of Friday alone, breadth has been terrible in this debt ceiling crisis pump, which means even though Nasdaq is flirting with 15,000 and SPX with 4,300, it's a bullish impulse within bearish macro conditions.
There's a lot of trouble on the horizon with the 2024 Presidential Election close enough that the game has to played and the trouble brewing in mainland China with the Communist Party being about to fall and the globalist bloc struggling to either cuckold or depose Xi Jinping.
What a bullish impulse in a bearish macro framework means for small caps is that although Microsoft, Nvidia, Google, Tesla, Amazon, Apple might pump, liquidity is not going to be going "risk on" on small caps and zombie corporations.
Instead, prices will be driven lower because as they sell the cycle highs in the blue chips, they'll be bidding a portion of their profits with lowball asks on small caps for the purposes of pumping them, and then dumping them, on retail's head after interest in the big names has become exhausted.
Those very large lowball asks will lead the algorithms to drive price towards them because the algo is designed to generate volume.
But on small caps, unless the company has significantly exceptional fundamentals, your expectations on how high it can go and how long it can go for during a reversal will have to be quite reserved.
In other words, if you missed the July '20 to October '22 pump on IWM then you missed the train and it's never coming back.
It is what it is. Just accept it.
You can make a lot of money trading puts on this thing on the way down.
It just means that if it really does bounce around $125, your expectation for where it can bounce to shouldn't be a new ATH, but probably back to $170.
Again, you can make a lot of money trading calls from $125 to $170.
But if you want to bUy tEh bOtToM fOr thE mOaSS and think you're going to get a 50 bagger instead of a "tiny little" 5 bagger, you're going to blow your account.
And if that's who you are, it's probably better you blow your account and go back to working a real job and learn the value of money again.
So here's the trade.
This recent breakout looks like it's just a consolidation squeeze. It's going down. But it might screw around for a while and could be as annoying as trading over $200 again. It's really hard to say.
Areas you'd really like to short and/or buy puts are called $188 or $190.
You'll need 4-6 months or so to get to the $127 level.
But either way, the R/R on a $188 short with a $212 stop and a $130 target is almost 7 to 1.
Go do sports betting for a while and enlighten to how hard it is to hit a +700 if you don't think that's a worthwhile trade.
You need to quit wanting to get rich quick. Getting rich isn't important and it isn't even valuable. What you need is to wake up to what's important in life and what you're really here to do.
And that question is answered in mankind's traditions and that 5,000 year old culture sitting in Mainland China after the CCP is utterly annihilated.
