IWM - is stochastic warning of a major support break?IWM has been rangebound for almost one year now. Price was around highs of 170 before the "Covid drop." The 212 area is strong support, but it may break soon. Since price broke out of the upper resistance and fell right back into range, a break of support may soon follow.
Let me explain how I use stochastic %K warning signals, which usually lead price movement. My custom setting is 10-period %K and 7-period %D (I do not use D-slow), which I find to work well for my day and short swing trades. When %K (blue line) drops from above 80 to under 20 in 2-3 candles, it warns of more selling, and the corresponding price candles are usually innocuous. Usually I look for price to bounce first and then make a significant drop, as happened at the end of October (white oval). %K gave a warning signal and was followed by a quick reaction bounce before a larger selloff. Sometimes, as is happening now, %K will give a warning and it is followed by lower RSI and continued selling. This signal does not work 100% of the time, but I use it regularly with high success to enter long option trades. Also, the same is true in the upwards direction; a sharp rise in %K from under 20 to over 80 signals a stock will soon make a significant move up.
On 6 Jan I bought two put positions when IWM was 218-219: 21Jan 215 strike and 18Feb 210 strike. With markets dropping sharply right now, wait for a good entry. IWM should retest 212 and if it bounces up again instead of breaking support then I have plenty of time to exit Feb puts without a big loss.
IWM

Leading Indicators point to more the obviousLeading Indicator panel update:
JNK - the topping pattern continues to play out for JNK, looking for a lower low, after the last lower high.
IWM - The Russell 2000 ETF failed a breakout late last year, and is about to break down of a support given the bearish weekly candle.
DJ Trans - a system Sell signal, and likely downside off the Dark Cloud Cover pattern.
Value Line - Similar outlook to DJ Trans, with bearish candlestick that failed to close the gap.
TIPS - Totally bearish Marubozu that broke two supports, with MACD bearish. This market forerunner is not boding decisively bearish.
TLT - Instead of the expected bullishness in a bearish market, we see TLT being dumped with a gap down marubozu.
VIX - still low, coiling to spike perhaps?
ES1! - The S&P500 futures had a Bearish Engulfing last week... indicative of a follow through downside in the weeks to come.
So... the leading indicators overall are bearish, and getting more so, with the S&P500 just became indicative of some real retracement potential in motion.

ROTATION ? OR TRANSITION TO BEAR QQQ VS QQQE has started to show a very clear move out and is just stating to hit the Big mega caps names . I DO NOT have any sign of a bottom now ! the line in the sand is at 375.91 in the QQQ and I would think that we will see the QQQE breaking the neckline of its head and shoulder pattern that has formed .Cycles are neg now till late jan to early feb . One by one of the winning mega caps cost msft seem to have now formed a top and i look for downside to be picking up rather soon . have a good weekend and best of trades WAVETIMER

Rolling (IRA): IWM January 21st 200 Short Put to February 194... for a 1.18 credit.
Comments: More IRA housekeeping. Here, rolling for duration for a realized gain and to the strike paying at least 1% of the strike price in credit. I've collected 2.35 (See Post Below) + 1.18 or 3.53 so far.

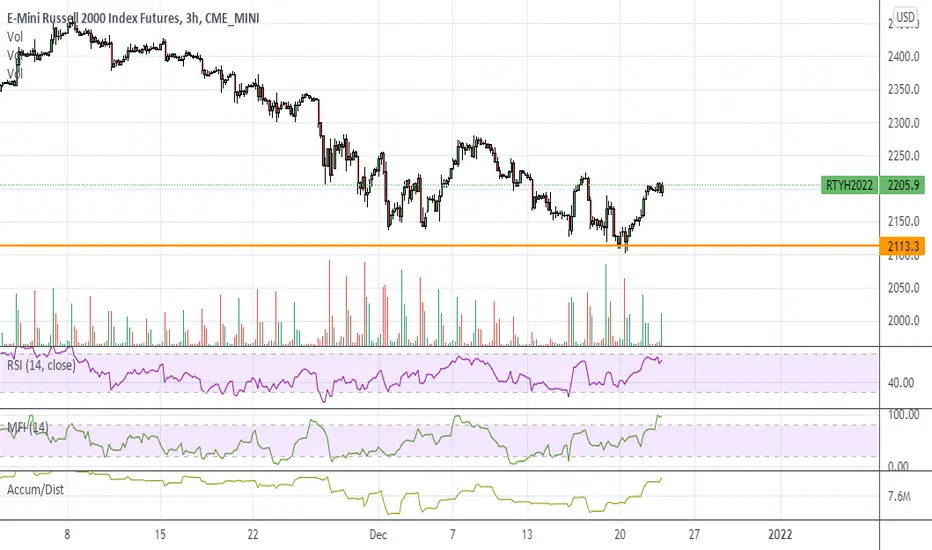
RTY UpdateMFI almost overbought, much like NQ
Don;t chase the pump, probably should be looking at cashing out soon if you;re long. I would not hold a long position over the weekend
There is the chance that RSI also need to go overbought but I wouldn;t count on it

Best places to go long or short the RussellThe Russell is even cleaner than the Nasdaq. Two major buy / sell areas on the chart. So far the Russell has been playing the game of chop. Sweep the lows, sweep the highs and move in the other direction. The same way we had a failed breakout, we could get a failed break down.
Best place to sell 2310-2360. Resistance/Gap combo and the real direction for now is down, so it is with the main trend.
2200 & 2080 are decent for short term trades. As we go down they are good for a bounce. If they get broken they are good to put shorts if the market bounces from lower.
Best place to buy long term is 1980-2030. Extreme support combo with 1. Untested breakout / gap, 2. Key Bollinger bands, 3. 400 DMA

IWM, Round #2, Fists Up!?Here comes IWM again, does it 'cojones' this week to run with the big boys or lag again back...? time will tell...

NOBODY RINGS THE BELL AT THE TOP RING RING RING WAVE B TOP From an EW view and the fact we thrust up out of a 8 month triangle I had hoping for more upside .But I feel and looking at the fact the nyse is nearing its long term target fib projection for wave 5 THE IWM looks to be ending what could be wave C up to end wave B top into .50% retracement DO NOT BE LONG THIS INDEX

Meanwhile, small caps...Small caps appear to be melting up, the index tends to fill gaps and there's a gap at my red line. Note that it's an index gap and not a futures gap so there's no guarantee on this one. Also, it's tagging along the overbought zone so it can tank at any time.
I'd stay away from garbage stocks though if you;re going long

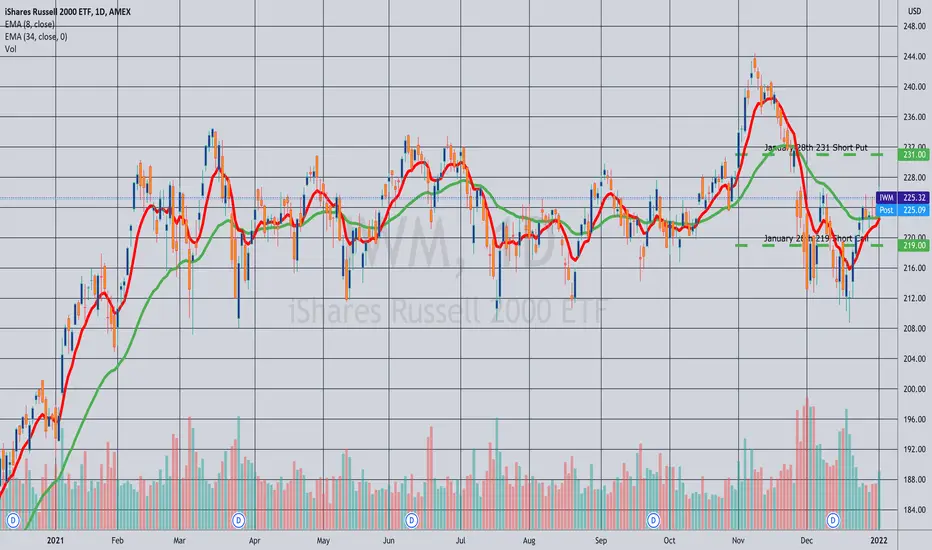
Closed: IWM January 28th 219C/231P Short Strangle... for a 16.48 debit.
Comments: Total credits collected of 16.48 (See Post Below); scratching it out here for exactly that amount. It's possible that I could've still made money on this trade since price was in-between the strikes of my inverted setup, but my preference is to look to scratch these out if given the opportunity and then redeploy the buying power in something more productive from an implied volatility and probability of profit perspective rather than hang out in them attempting to make them winners.
Do you feel it?are we seeing a moment of cool down on IWM? if we are this is how i think this thesis could play out like my drawings but if you agree please drop a like!
cheers

IWM: See You at Tha Crossroads IWM is at a crossroads. If buyers step in this week they must fill the gap at 228.53 (in blue). 226.67 will be hard, but if they successfully get through and a daily close above 228.53 a run to 240 is not out of the cards THIS WEEK.

IWM, where are you going, will the SPY save you or yourself?tool tip:
Green (open weeklies, from previous and/or past)
Red (Monthlies... * etc)
IWM looking weak, but it might have a chance soon to pop up. but will it save it self or will SPY come to the rescue?

Russell, 22 Dec. End of a Gigantic RangeIWM has been in a range for 329 days. It has tested the lower boundary 7 times. Many analysts now believe that 2022 will see a rotation back into value and small-caps, after 2021 was the year of the big tech corporations.
Elliott:
The range makes it difficult to determine a clean count, however we can count 5 waves to the downside in the last swing from 8 Nov. This is important because any complex correction such as the WXYXZ would complete with a 5-wave move, before price departs to the upside.
Oscillators:
The MACD crossover is imminent and the MFI is pointing upwards after a bullish divergence.
Geometry:
Price has reversed on the 50% Fib of the current pitchfork with a typical reversal doji. The next resistance is the pitchfork median at 221, potentially the end of wave (i).
How I trade it:
If we assume that the range is a completed re-accumulation, we can begin to build back long exposure. In Wyckoff terms, we would now be looking for the LPS/SOS stages. If price gives us a wave (i)-(ii) structure (in blue), we will get a H&S pattern that provides a solid bullish setup (long above wave B of (ii)). Support on the pitchfork median and a break of the 20 week MA at 224 would then signal that our assumption is likely correct.
A well-prepared entry is important because price can also exit the range to the downside. The bullish idea is invalidated if price moves out of the pitchfork altogether, which is below 202.

Fiverr Weekly setup$FVRR I have my eyes set on this for the longer term. Not interested in short term noise. Small cap company I personally believe in.
Looks like a giant falling wedge on the weekly timeframe currently into demand. I may think about starting a leap position here.
I’m not sure when but when this baby decides to reverse look at all that reward to the topside.

BNGO DBD or DBR? $BNGO I like. Look for be building a base after a big drop. Looking for the DBD or DBR. Nice pattern here.
Long over break and hold of top trend line/ Pivot at $3.41
Short below 3.16
Until $3.41 breaks I will only be watching this. Big target still remains $4. Patience will pay here.
Keep in mind we are sitting at a weekly support level so I expect a big move to either side whichever comes first. Hopefully we can see this play out within the next few days.

Potential reversal pointsHaving used some Fib retracement tools and with the help of trendlines I have found these potential reversal points/areas.

"most fear the unknown" iwm updatemost fear the unknown, and in turn they stay away from it,
i walk into the unknown with confidence, knowing there is always opportunity ahead.
----
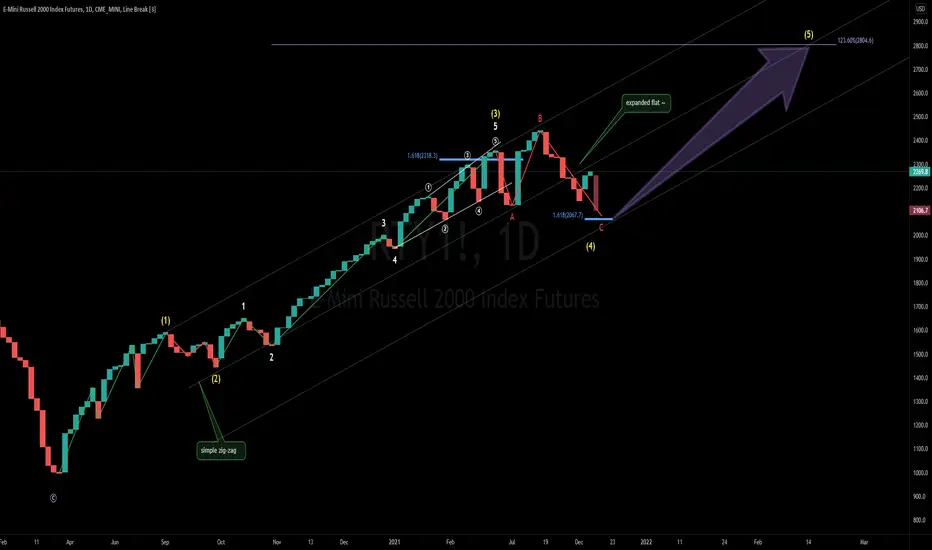
iwm\rty (small caps) look to be on the verge of finding a big local bottom in this local region here through an expanded flat.
the law of alternation states: "if wave 2 was a simple zig-zag, then wave 4 will have to be a complex correction".
that's precisely what we're seeing here, a little complex correction phase to really shake out the weak hands out of this wicked market.
-----
wave 4 target = $2067.70
wave 5 target = $2800
XLF next leg lower? Month price action!Hey yall this is where I see the bank sector going in the next 2 years. i can be 1% wrong tho.


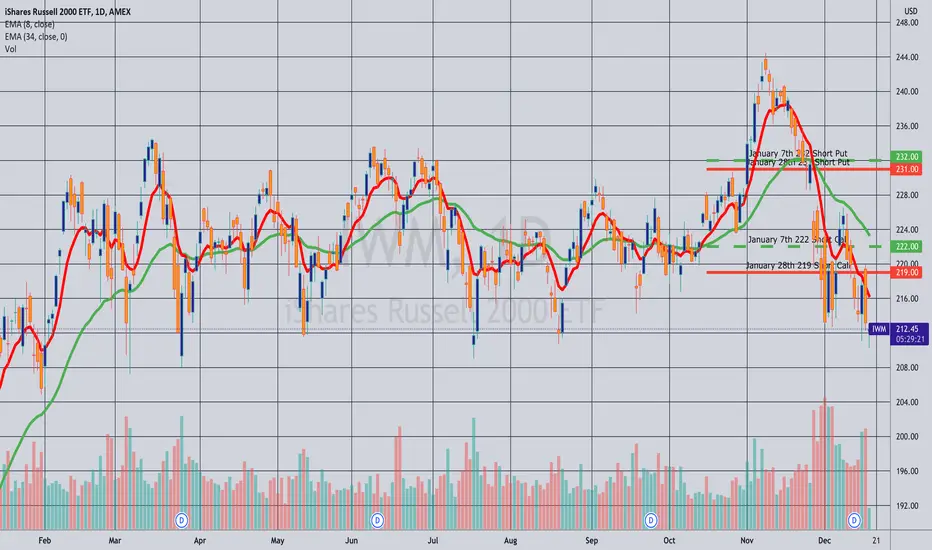
Rolling: IWM January 7th 222C/232P to January 28th 219C/231P... for a 2.61 credit.
Comments: Rolling my January 7th 10-wide inverted short strangle out until after the holidays to a 12-wide, but improving the short put strike a smidge. Total credits collected of 16.48, so I'm functionally long the 231's with a cost basis of 231 - 16.48 = 214.52. Put another way, my share price break even is 214.52, so I'll need movement above that level to have it work out.
Closed: IWM December 31st 213/230 Short Strangle... for a 3.37 debit.
Comments: I received a total of 4.98 in credits for the original strangle plus adjustments. (See Posts Below). Closed it out today via order to take profit equal to what 50% max of my original short strangle was. 4.98 - 3.37 = 1.61 ($161) profit.
