Macro Update: Stocks, Bonds, Yields, Housing, UnemploymentStocks are in a bull market.
Bonds are in a bear market.
Unemployment increases to 4%
FOMC & CPI on Wednesday.
Yield Curve remains inverted. Longest in history.
IWM

Next Week's IWM, 21 Day Pivot Standard Deviation RangeLooks like the medium term bias is to the downside for small caps, as we see the weekly pivot (red solid line) fall below the monthly pivot (dark solid line) with AMEX:IWM closing below both.
Both deviation boxes represent two standard deviations above and below the a moving monthly pivot. We may see demand in the lower deviation range if we fall to start off the week.
A rally to start of the week will likely be met with resistance from our pivot points and a fresh downward move from the 21 day moving average.
Investors that want to take advantage of this medium term bias could short volatility in the short term (June/July) for IWM using AMEX:TZA but bet bigger on long volatility in the longer term (September/January2025).
Take any short term gains to the upside and hold onto your short thesis heading into the second half of the year, into 2025.

Short squeezes are happening!Discussing some potential short squeeze candidates.
Some of these names have already bolstered huge gains and looking to potentially squeeze higher if price action holds firm.
All of these names need to be monitored in the near term for opportunities.
Shorts get nervous when stocks are moving higher.
AI, SPWR, CHWY, WOOF

MAY 30 MEMBERS DAILY ANALYSISMega cap tech saw massive selling.
MSFT & NVDA hit hard today. Cloud based stocks under pressure.
Small caps ripping!
Natural Gas collapse...Profits secured! KOLD
Weak GDP & Housing data send yields lower.

Members Daily Analysis May 27 2024SPX into monthly resistance.
NVDA carrying the market as other semis lag.
Oil reversing off support...trying to breakout of falling wedge.
Yields quietly moving over the CPI dump last week.
over 55% of the S&P500 companies trading below the 50day.

Members Daily Analysis - May 22 2024Markets Sold off: IWM (Small caps) underperformed.
Most commodities hit on the downside: Gold, Silver, Copper, Oil
Natural Gas surging & squeezing
NVDA pumping on earnings: Our SOXL calls will print.
SemiConductors i'll be trading tomorrow. NASDAQ:ON , NASDAQ:SMCI , NASDAQ:ARM

RIG monthly back-tests, high probability using game theory.RIG monthly back-tests, high probability using game theory (and macro/b-cycle). Price action following.. Self explanatory.

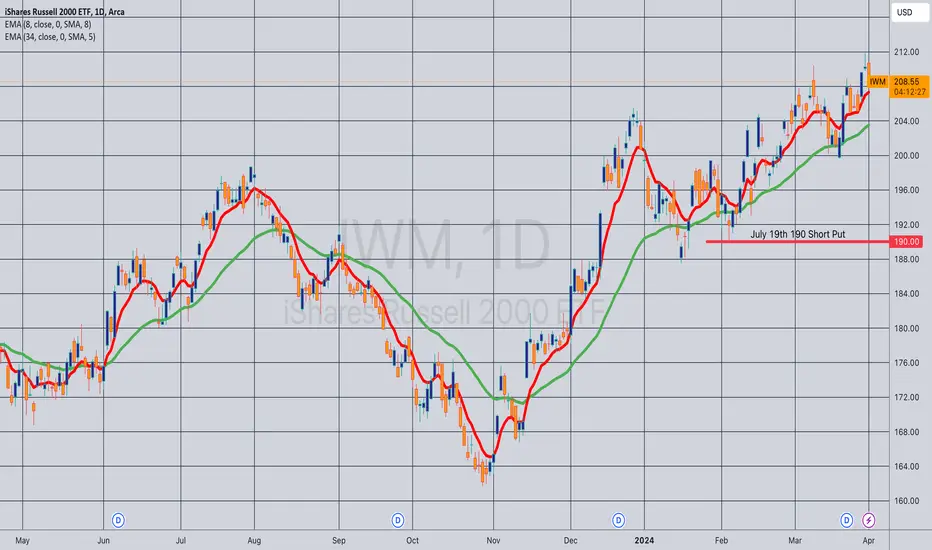
Opening (IRA): IWM July 19th 190 Short Put... for a 2.33 credit.
Comments: Targeting the shortest duration <16 delta strike paying around 1% of the strike price in credit to emulate dollar cost averaging into the broad market. (This is actually at the 18 delta, but it was either the 190 or the 185 where I wanted to pitch my tent from a delta standpoint).
Starting to slowly deploy third quarter rungs here in broad market (IWM, QQQ, SPY) while I piddle around with shorter duration higher IV sector ETF stuff.
Opening (IRA): IWM Sept/Oct 160/150 Short PutsComments: Going ahead and rounding out Q3 rungs here with IVR at 82.7.
September 20th 160: filled for a 1.99 credit
October 18th 150: filled for a 1.61 credit
Will look to manage shorter duration rungs as I come to them ... .

IWM target 181 ?????We now have the right shoulder of a large head n shoulder top in IWM we could now see the next move under 191 best of trades WAVETIMER stagflation anyone !!!!

Opening (IRA): IWM August 16th 170 Short Put... for a 1.78 credit.
Comments: Starting to round out my Q3 rungs here on weakness and higher IV, targeting the <16 delta strike paying around 1% of the strike price in credit to emulate dollar cost averaging into the broad market. Already have June and July rungs on, so going out to August here.

Opened (IRA): IWM June/July 182/180 Short PutsComments: Added at strikes better than what I currently have on in weakness, targeting the <16 delta strikes in the respective expiries paying around 1% of the strike price in credit to emulate dollar cost averaging into the small cap ETF.
June 21st 182: Filled for 1.89
July 19th 180: Filled for 2.22
I also briefly looked at QQQ and SPY, but couldn't get in at strikes better than what I currently have on, so am leaving those positions alone for now.

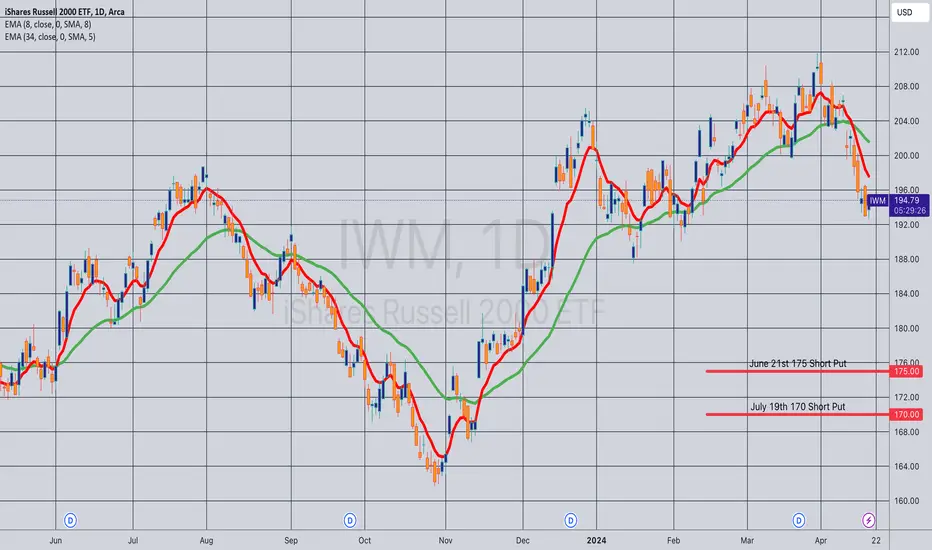
Opening (IRA): IWM June 21st 175/July 19th 170 Short PutsComments: Targeting the <16 delta strikes paying around 1% of the strike price in credit to emulate dollar cost averaging into the small caps ETF.
Adding here on weakness, better strikes than what I currently have on in those expires.
Filled the June 21st for a 1.75 credit; the July 21st 170 for 1.76.
Opening (IRA): IWM June 21st 185 Short Put... for a 1.87 credit.
Comments: Targeting the <16 delta strike in the shortest duration that pays around 1% of the strike price in credit to emulate dollar cost averaging into the broad market.
The ROC %-age isn't tremendously sexy here, so primarily doing this to keep theta on and burning while I work shorter duration, higher IV underlyings (e.g., SMH, XBI, GDX/GDXJ, etc.).

QQQ GOING FORWARD abc x abc CHOP till mid early may The chart posted is what I see forming within the correction phase . as you can see the Dia and Iwm are showing some real sights of weakest the game of musical chairs one by one drop off So far best of trades Wavetimer

04/27/2024 - Watchlist, Stocks, Crypto - Video Idea - TA ChartsWatchlist, Stocks Indexes, Bitcoin, Crypto TA Charts by @NoFomoCharts
00:25 Watchlist and News
02:05 Stock Indexes
06:22 Crypto, Bitcoin, Altcoins
Watchlist, SPY, QQQ, DIA, IWM.
TOTAL, Bitcoin (BTC/USD), Halving History, ETH/usdt, BNB/usdt, SOL/usdt, ADA/usdt, XRP/usdt.
04/27/2024, 08:00PM EST Video Idea.
Technical Analysis & Educational Chart Videos.
Follow, Comment, Boost, or Cheer to support. Thank you!
All content is Not financial advice.

SPY min upside 5150 and up to 5330 june 6thThe chart posted is that of the spy in which I posted back in March I have NOT changed the labeling as it was correct .We are at the end of wave A down and should see a rather sharp ABC rally back up to a min of 5150 and then a pullback followed by the last wave up I do think it can reach as high as 5330 this is the alt to my 5261. We are now one of the most over sold in a few years . Best of trades WAVETIMER

04/21/2024 - News, Stocks, Commodities, Crypto - Video IdeaNews, Stocks, Indexes, ETFs, Commodities, Bitcoin, Crypto TA Charts by @NoFomoCharts
00:22 Part 1 - News and Watchlist
03:32 Part 2 - Stock Indexes, Metals, Commodities
10:58 Part 3 - Crypto market, Bitcoin, Altcoins
Watchlist, SPY, QQQ, DIA, IWM, GLD, SLV, USO.
TOTAL, Bitcoin (BTC/USD), Halving History, ETH/usdt, BNB/usdt, SOL/usdt, ADA/usdt.
04/21/2024, 09:00PM EST Video Idea.
Technical Analysis & Educational Chart Videos.
Follow, Comment, Boost, or Cheer to support. Thank you!
All content is Not financial advice.

04/14/2024 - USA Stock Indexes - Video IdeaUSA Stock Index video idea by @NoFomoCharts
SPY, QQQ, DIA, IWM, DXY.
04/14/2024, 09:00PM EST Video Idea.
Technical Analysis & Educational Chart Videos.
Follow, Comment, Boost, or Cheer to support. Thank you!
All content is Not financial advice.

04/14/2024 - Weekly Watchlist - Video IdeaWeekly Watchlist video idea by @NoFomoCharts
04/14/2024, 08:30PM EST Video Idea.
Technical Analysis & Educational Chart Videos.
Follow, Comment, Boost, or Cheer to support. Thank you!
All content is Not financial advice.

IWM/SPY, high probability resistance, 26.decIn 26th dec, there was a high probability weakness in IWM based on this graph.
Top of BB's and impulse has no potential, yet important resistance/break out.
//rising TNX is bad for cyclicals or small caps.

Watching for IWM to bounce off support
IWM is currently in a strong accumulation area based on the volume profile delta. The indexes were a bit oversold after yesterday's CPI report and FOMC minutes, leading to a bounce in the afternoon. I am skeptical as to whether today's PPI report and fed speakers will have the same effect so I closed my puts. Here is my reasoning:
VIX keeps rejecting above $16.25. If it does not move up sharply at market open, I expect it to reject again and move back down towards $13.00.
The 10y bonds chart looks like yields have topped out for the week after hitting the R3 fib pivot point. I see it retracing down the channel until next week.
Same situation with the Dollar.
I expect a small rally into the weekend or early next week. Timing will depend on the reaction to today's PPI report. I'd like to see a dip in the morning so I can minimize risk in case there is not enough momentum to get to $206. I expect some choppiness there so we can either continue moving up next week or head for new lows.
Also thinking this looks like another bullish wedge on NYSE..

Spy / Oil / Natural Gas - Market Analysis CPI comes in hotter than consensus.
IWM slaughtered / QQQ under pressure / SPY closes negative.
Yields & Dollar ripping.
Oil ripping / Natural Gas selloff.
Are we entering a new reflation trend?
