Timing the market. IWMWhat we know? Oil is likely bullish in 2nd Half (24'). BTC leads the small caps. TNX usually works as a head wind (and has took a pause). Rate cuts are very bullish for small caps and financials benefit in this environment?
technically; the 20dma works as a driver. 50dma and 200dma just gives you context. You can add MACD to confirm things.
Im speculating that small caps breaks out in mid April.
U can fact check using IWM/SPX.
IWM

SMCI Critical level IncomingSMCI saw a nasty down move today with the market.
Semiconductors led the downside move today.
It seems massive amount of capital rotated out of the market today.
This low float volume stock can unwind in a sharp way if this support is breached.
Remember dip buyers will likely start to accumulate as semis are coming from All time high bull market.
Everyone is watching the potential head & shoulder pattern that could trigger with more weakness.

Small Caps take the lead. 50% gains ahead for $IWMCredit to Mr. Tom Lee for this one. Small caps are at a multi-decade low in value relative to the S&P. The Fed beginning to cut will be the catalyst for a huge move in the Russell over the next 12-18 months

Opening (IRA): IWM June 21st 180 Short Put... for a 1.82 credit.
Comments: Targeting the shortest duration <16 delta strike paying around 1% of the strike price in credit to emulate dollar cost averaging into the broad market. There is no July contract yet, but June is still paying at <16 delta ... .

IWM Russell2000 11% UP ?Russell 2000 index - exit from channel towards long, above average 150, depends on the drop in interest rates in the US, potential increase 11% & more.
Only an idea and not a recommendation for trading!

Gamestop market psychology during bubble in 2021.Very interesting take on GME. You need a sustainable higher highs for an uptrend, or most of these are perfect bull traps. Way to measure is also due to public sentiment, euphoria. Potentially easy money phase.

QQQ (Nasdaq etf) - Potential Bearish Momentum - WeeklyQQQ (nasdaq etf) has been uptrending for over a year (2023 to 2024).
However, signs of a potential pullback in the long-term charts are showing with the price and rsi oscillator.
In the long-term, a potential pullback may occur in the price, and the price could fall down to $426, $419, $400, $394 support levels.
Long-term resistance levels are: $460, $470, $480, $500.
QQQ etf volatility and trend can be affected by FOMC Interest Rates, Corporate Earnings, Consumer Sentiment, and Global Event Catalysts.
A major bearish catalyst or a series of bearish events would be needed to reverse the price back down.
Note: Without bearish events, the price of QQQ could continue rallying to new all-time highs.

$ARKK - VCP (Volatility Contraction Pattern)AMEX:ARKK Mark Minervini made famous the VCP as a set-up. It is also simply a wedging pattern that can break either way. However, where there was a previous uptrend, like in this chart, the direction of the break is usually to the upside. The path of least resistance is a continuation of the previous trend.
ARKK had a move of over 60% from the Oct 30th low to the Dec 27th high. It pulled back about 18% from that high and has been digesting since and is now down less than 8% from that most recent high.
As in life there are no guarantees on this. But here is my plan, I have an alert set on the upper downtrend line. Should that trigger, I will look to go long with a stop either below that day’s low or a close below the 20 EMA (White). All TBD.
Ideas, not investing / trading advice. Comments always welcome. Thanks for looking.

$QQQE & $RUT show breadth is not as bad as they're saying$QQQW is the equal weight NASDAQ:NDX and it is at an all time high, forming a cup. The question is, "Will it form the handle & breakout"?
TVC:RUT is in an uptrend but facing trouble at resistance.
This shows that breadth is not as bad as they paint it to be. However, it could be a lot better.
AMEX:IWM

IWM Canary in the coalmine 5th wave diagonal still formingTOPThe iwm the index most quoted this year to move up %50% by most of the Talking wall cnbc well now trick and trap is now setup to take the $

Opening (IRA): IWM June 21st 169 Short Put... for a 1.63 credit.
Comments: Laddering out at intervals, targeting the <16 delta strike paying around 1% of the strike price in credit to emulate dollar cost averaging into the broad market.
Will start looking at adding in shorter duration if I can get in at strikes better than what I currently have on.

SPY Correction Coming?Hello everyone!
First two new charts for 2024. Another year another upside logic market. We're breaking ATH with continually decaying economic data, new banking troubles, new wars, and an election year and markets ignore it all. It's a Fed controlled market so mysterious!?
Anyhow, in this chart I did a vague not so accurate EW that began Jan 2022 that bottomed in Oct 2022 which basically bounced off the Feb 2020 highs which pushed us into this new bull market. We finally broke the ATH for the S&P today with 5015ish, which makes me believe we should soon see a corrective wave hit.
The first support will be early Jan support of 475. If this stays within this channel, we should see the correction over (C) at the same level as (2) of the bear market of 2022 which is March/April of 455ish giving us about a 10% correction.
Now, this is all IF markets go as planned and there are no external factors influencing selling such as a larger scale geopolitical war, banking failures and so on. This is based off a market that is going at the current pace.
That being said, I do see a major geopolitical event that will shake markets to their core but until then, we base our market moves on the Feds dovish nonsense.
Technicals:
- RSI, MACD are about peaked.
- VIX is at critical levels

SPY IWM QQQ analysis : Blowoff top?SPY & QQQ saw negative reversal today despite the strength in semis.
Major resistance is in play.
IWM failed breakout on watch?

Opening (IRA): IWM May 17th 170 Short Put... for a 1.74 credit.
Comments: Back to short puts here, targeting the <16 delta strike paying around 1% of the strike price in credit. Just gradually building a position here at intervals.

IWM 5TH WAVE DIAGONAL HAS ENDED I now can label the rally as ENDED in the IWM . Most are looking at this rally as a break out I am worried if this breaks from here .If it does based on the P/C models we would break and it would be UGLY .

IWM long 170 . add 162 can keep sl at 154 , we are back at June 2018 lets in this snoozefest of an index, maybe time to wake up when nothings in its favour ,
contra call

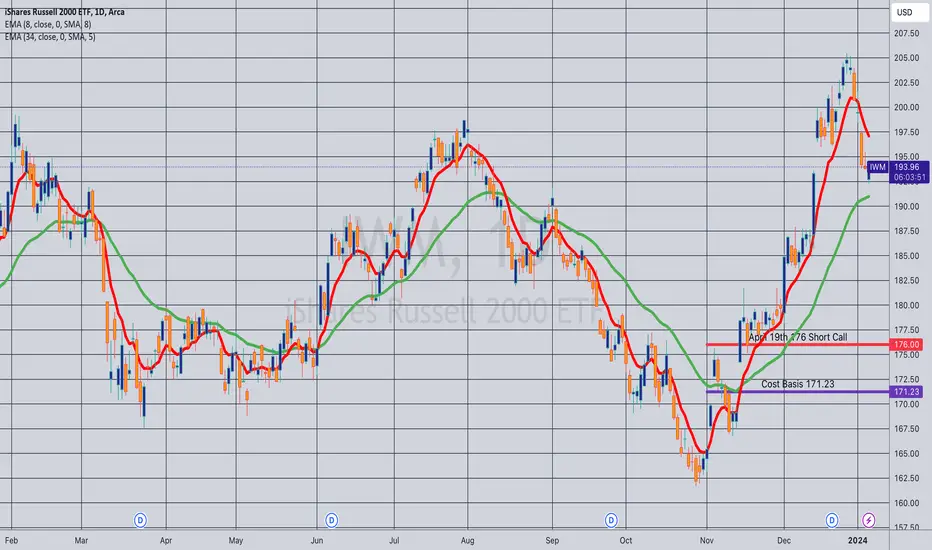
Opening (IRA): IWM April 19th 176 Monied Covered Call... for a 171.23 debit.
Comments: Buying stock and selling the -75 call against to emulate the delta metrics of a 25 delta put. This setup gives me a slight bump in premium over selling the 25 delta put due to call IV skew, along with built-in position defense with the short call.
Laddering out over time after flattening out at the end of the year. I'll naturally look to add in shorter duration if I can get in at strikes/cost basis below what I currently have on, but will probably continue laddering out to the end of the second quarter (June) for a bit here.
Will generally look to take profit at 50% max; look to roll out the short call to reduce cost basis further should price traverse the short call strike (since extrinsic is highest in at-the-money strikes).
IWM INVERSE HEAD & SHOULDERS CONTINUATONHere is IWM bouncing off of the 5ema while also in the process of confirming an Daily inverse head and shoulders pattern. The inverse head and shoulders will be confirmed once price breaks 199.53 and this could give IWM a chance for continuation to $205+.

Russel 2000 WeakLet's take a look at the Russel 2000. This index seems to be the only one between the Dow, Nasdaq, and S&P that is failing to break to new ATH while they are.
What we're seeing is a triple top/triple resistance in Aug 2022, than again February 2023, and again August 2023 which was confirmed with a break down to the lows of October 2023 before more manipulation came into play. Some will say inflation is declining and talks of rate cuts seems to be the reason markets rose, but from what we are hearing today from the Fed is that rate cuts aren't likely as they continue to backtrack and downplay rate cuts.
Perhaps, they know something before we do... perhaps double peak inflation like the 1970s? Just as everyone believes its declining, surprising new data comes out that proves otherwise? Let's see.
Once again we see the Russel 2K failed more recently to break and hold above 2020 with constant rejections. This would be the 4th rejection and we could be on the 5th rejection. And why not? Banks once again are starting to shake, with JPMorgan losing deposits, NY Community Bank failing, banks invested in CRE are tanking and this before the big ending to their Bank Term Funding Programme (BTFP) officially ending. Look at the chart for it, it spiked in March 2023 with the failure of SVB, and it is spiking once again Jan and Feb of 2024. Something coming down the pipelines?
I shudder when I see markets breaking ATH, because it has ALWAYS meant markets are more vulnerable to bad news (be it financial, economical, or geopolitical). What we're witnessing is a market that is getting fundamentally weaker and weaker. The economy does not support equities hitting ATH, as earnings are revised lower, personal debt is $17 TRILLION dollars (an ATH) and personal savings are at an all time low. This is not including the decaying jobs market, retail, national debt, manufacturing, consumer sentiment and so on. The floor is a 1 centimeter sheet of ice and it's warming up. This bubble is poised to pop any moment now.
My advice
Obviously, be vigilant. If you are holding positions from a lower price point and you are making profit, I say hold until whatever event happens and breaks the glass floor. If you are new money looking to invest, I can not suggest investing now at the top with such toxic economy and financials. Do your own research, look at the economic data and see if any of it or at least majority of it gives you peace about investing. People are broke, debt is exploding so retail will inevitably collapse and since we're a retail based economy, you can imagine what comes next.
Targets for Russel 2K - IWM
1) 1915, if we break that then
2) 1730, if we break that then
3) 1680, if we break that then
4) 1630, if we break that then run for the hills.

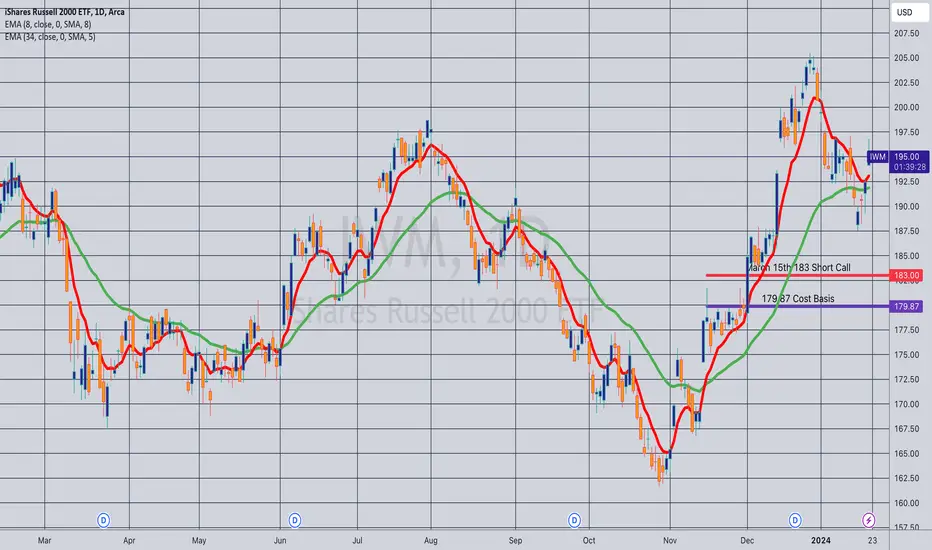
Opening (IRA): IWM March 15th 183 Monied Covered Call... for a 179.87 debit.
Comments: Doing another one of these in March with a short call strike and cost basis better than what I currently have on at the 186.
Selling the -75 delta call, buying a Johnny one lot to emulate a 25 delta short put in order to take advantage of call side IV skew.
3.13 max profit on BPE of 179.87; 1.74% ROC at max; .87% at 50% max.
Will generally look to take profit at 50% max/roll out the short call to reduce cost basis further in the event price breaks the short call.
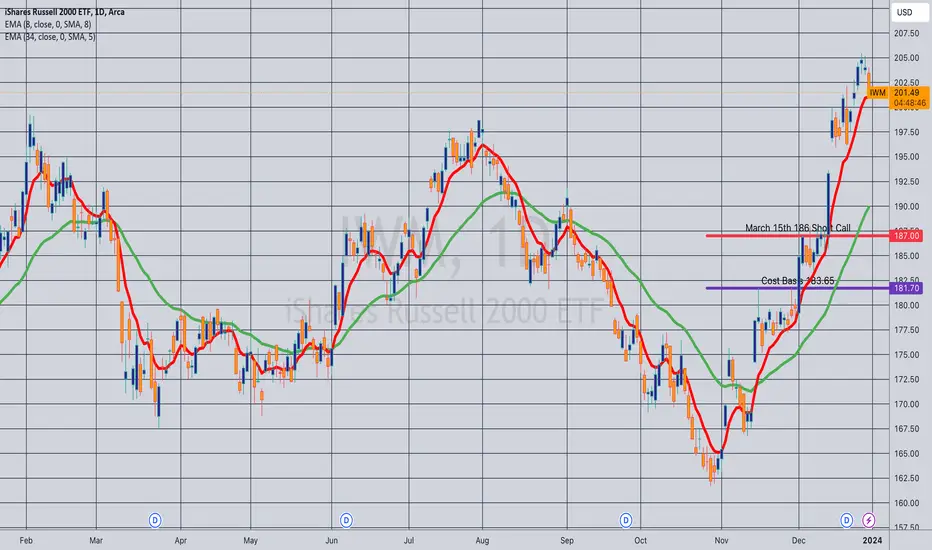
Opening (IRA): IWM March 15th 186 Monied Covered Call... for a 181.70 debit.
Comments: Buying stock and selling the -75 call again to emulate a 25 delta short put that is "defense ready" via roll of the short call.
4.30 ($430) max on buying power effect of 181.70; 2.37% ROC at max; 1.18% at 50% max.
Will generally look to take profit at 50% max and/or roll out the short call on price's traverse of the short call strike to reduce cost basis further.
$TGI Breaking Out?NYSE:TGI I have had my eyes on this one since the big volume breakout on December 21st. I did not want to chase it, so I have been waiting for a pullback and re-breakout. I have that this morning. See chart for notations.
I started a one third size position here with a stop on any close below the breakout trendline.
Ideas, not investing / trading advice. Comments always welcome. Thanks for looking.

$SPY$483 coming soon 💭... $470 by EOM.. I've got a repetition of July Top and Pullback in play here. Potential to lead to something much more serious.
