NASDAQ Prediction (No Guess) Based on mathematical modelHello traders!
I was analyzing NAS100 by using different mathematical formulas and models recently, then I just tried my favorite mathematical cubic curve model & the prediction is shocking.
NAS100 weekly chart is predicting the price in October aprox. 9000 !!!!!!!!!!!!
Isn't it Shocking ;)
P.S. This is just an analysis based on my personal research & not a financial advise !!!!!
Nasdaq Composite Index CFD

Comparing the Nasdaq, S&P, and the M2 money supplyThe current drawdown in the stock market may not appear like much when looking at a monthly chart, however when comparing to the money supply it tells a different story. From the peak of the dot com bubble the entire market is still down significantly when adjusted for all the money printing the fed has done.

Nasdaq Composite Index divided by M1 and M2 money supply The current drawdown in the Nasdaq may not appear like much when looking at a monthly chart for example, however when comparing to the money supply it tells a different story. Compared to M2 we are at the same level seen in early 2020, however compared to M1 we are at levels not seen since 1991.

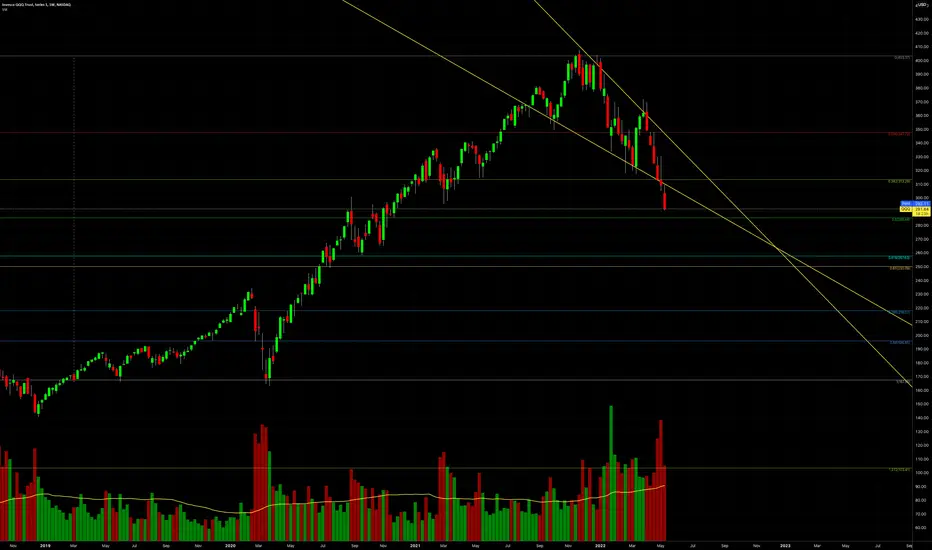
Nasdaq 100 - A correction is moving towards its endWe continue to be bearish on QQQ even despite the current bounce in price (correction). Indeed, we think that the current pricing is attractive for (re)entry of short position. Since all our price targets were hit before the rally; therefore, we would like to set a new short-term price target for QQQ at 300 USD. We would also want to set a medium-term price target of 290 USD.
Illustration 1.01
The picture above shows short-term support levels as well as relief from the selling pressure.
Please feel free to express your ideas and thoughts in the comment section.
DISCLAIMER: This analysis is not intended to encourage any buying or selling of any particular securities. Furthermore, it should not serve as a basis for taking any trade action by an individual investor. Therefore, your own due diligence is highly advised before entering a trade.

The worms are eating their fill on AAPLOutperforming all indices to the downside. Bounce probably soon but nothing major if this is a C wave.
Look for that 130 area and under by next week.

Nasdaq 100 - Dip buyers about to get obliterated Yesterday, Nasdaq 100 pushed above the immediate resistance we hinted at in our latest post on QQQ. We think the rally is due to end and the bearish trend to resume. Therefore, we would like to set a new short-term price target for NQ1! at 12 250 USD. We would also like to set a medium-term price target at 12 000 USD.
Illustration 1.01
The picture above shows yesterday's bullish breakout on the hourly chart. In our opinion, this is potentionally a perfect bull trap. Although, we will pay close attention to the price action of NQ1!; if it manages to break above the immediate resistance then it is likely that NQ1! might experience the last push higher before faltering.
Technical analysis - daily time frame
RSI points to the upside, which is bullish; however, we expect it to break down and turn bearish soon (the same applies to other mentioned indicators). MACD strives for a bullish crossover. Stochastic is bullish. DM+ and DM- remain bearish, while ADX signals a pause in selling pressure. Overall, the daily time frame shows less bearish conditions than a week ago; although, we still maintain a notion that the current bounce in price is just a “downtrend” rally.
Illustration 1.02
The picture above shows the daily chart of QQQ.
Technical analysis - weekly time frame
RSI and MACD remain bearish. Stochastic is bullish. DM+ and DM- signal the presence of a bearish trend. ADX grows which suggests that the bearish trend has not peaked. Overall, the weekly time frame is bearish.
Please feel free to express your ideas and thoughts in the comment section.
DISCLAIMER: This analysis is not intended to encourage any buying or selling of any particular securities. Furthermore, it should not serve as a basis for taking any trade action by an individual investor. Therefore, your own due diligence is highly advised before entering a trade.

NASDAQ Corrective WaveNasdaq is currently on corrective WAVE 3 on it's way to finish WAVE 4.
Looks like it's making a Zig Zag ABC correction and if it's true, then we could see a rebound from the "BLUE zone" to close several gap there before continue it's journey to WAVE 5.
Last correction area is the "YELLOW line".
Wave 4 invalid if price's touching the "RED line".

2008 is back.*As a Korean, I do not speak English. I used a translator. I get a lot of ideas from English-speaking countries while doing stocks.
Please send us your detailed comments.
*I need the opinions of great Americans
*History repeats itself.
]
Evidence is the chart pattern and * The US economy is similar.
If my prediction is correct.
After a bit of a rebound, the real hellish bear market begins. I think it will go down to the lowest point during the corona period. March 2020

Nasdaq100 inverse Head and Shoulders Chart PatternNasdaq 100 P/E ratio on May 12, 2022 was 20.71, which is below the Median of 26.59 or the Average of 30.04.
In the past 5 years, the Minimum was 15.74 on MAR 23 2020 and Maximum 86.30 on JUN 28 2017.
I have 2 scenarios:
1. Inverse head and shoulders chart pattern with a price target of $16650 by the end of the year.
2. Worst case scenario: bull trap at $13350 an retracement to the pre-pandemic level of $9750. I tend not to believe this scenario because of the too low price per earnings ratio of NDX.
Looking forward to read your opinion about it.

AAPL - follow the worms!Ideal short entry today. Down to 120 area by early June if I'm right. Panic selling hasn't started just yet.

NQ testy testy lost the channel and now retesting it. I think it's another objective short along with all big tech. This is a correction, not a rally.

QQQ (Nasdaq ETF) - Weekly - Support, Resistance, TrendlinesQQQ (Nasdaq ETF) - Weekly chart.
Support, Resistance, Trendlines for reference.
05/11/2022.
Nasdaq 100 - The relief rally is in a progressWe continue to be bearish on Nasdaq 100 index. Our view is supported by bearish technical and fundamental factors. The prospect of higher interest rates in the U.S. will continue to put pressure on the economy and drag market indices lower. We expect the rally to be short-lived and Nasdaq to resume its downfall soon. Therefore, we would like to set a new price target for NQ1! to 12 000 USD.
Illustration 1.01
The picture above links our bearish idea on QQQ.
Technical analysis - daily time frame
RSI, MACD, and Stochastic are bearish. The same applies to DM+ and DM-. ADX increases, which signals that the bearish trend is gaining strength. Overall, the daily time frame is bearish.
Illustration 1.02
Illustration 1.02 shows that the weekly volume continues to increase, which is bearish.
Technical analysis - weekly time frame
RSI, MACD, and Stochastic are bearish. The same applies to DM+ and DM-. Overall, the weekly time frame is bearish.
Please feel free to express your ideas and thoughts in the comment section.
DISCLAIMER: This analysis is not intended to encourage any buying or selling of any particular securities. Furthermore, it should not serve as a basis for taking any trade action by an individual investor. Therefore, your own due diligence is highly advised before entering a trade.

IXIC US Composite Nasdaq Corrects 50% from swing of 2020! Over? IXIC US Composite Nasdaq Corrects 50% from swing of 2020! Over?
#IXIC #NASDAQ #US30 #RUT #SPX500
NASDAQ:IXIC corrects 50% from the swing of 2020 bottoms.
Is it over? Economic fundamentals claim it has not bottomed out yet.
Most of the IT stocks gave the way for this correction. #TSLA #AMZN #FB #NFLX and so on to name.
Is it time for investment? Yes, for a long term holder who is not bothered with a small dips of 5-7% further fall, should start investing.
Are you salaried class person with a constant earning coming every month end? Or u have a business with a strong mindset of risk management and risk handling?
Be prepared with your investment plans! Personal Finances and Taxation. Earnings and Expenses. Savings and Return on Investment All are to be aligned in this latest world of increased necessities and demands with scarcity of resources.
As we have always read, this is actually happening in front of us.
Are we prepared?
Inflation and Unemployment will tame our greed and carelessness towards resources.
Investment opportunities? Ample of opportunities, waiting for appropriate investment entry.
Start investing start trading. Tradingview !
#tradingview.

QQQ - Dip buyers are about to catch a falling knifeYesterday, our price targets of 305 USD and 300 USD were reached. After that, the relief rally began, and QQQ erased some of its earlier losses. However, we expect the bounce in the QQQ to be short-lived. Accordingly, we remain bearish on QQQ and expect it to continue lower after the rally ceases; small time frames suggest this thesis as they slowly start to reflect overbought conditions. Therefore, our new short-term price target is 295 USD; the new medium-term price target is 290 USD (due to become a short-term price target once 295 USD is taken out).
Illustration 1.01
The picture above shows QQQ on the daily chart in pre-market on 10th May 2022. The downward sloping trendline acts as resistance.
Technical analysis - daily time frame
RSIs bearish structure remains intact. MACD and Stochastic remain bearish. The same applies to DM+ and DM-. Overall, the daily time frame is bearish.
Illustration 1.02
Illustration 1.02 shows that the weekly volume continues to increase, which is bearish.
Technical analysis - weekly time frame
RSI, MACD, and Stochastic are bearish. The same applies to DM+ and DM-. Overall, the weekly time frame is bearish.
Please feel free to express your ideas and thoughts in the comment section.
DISCLAIMER: This analysis is not intended to encourage any buying or selling of any particular securities. Furthermore, it should not serve as a basis for taking any trade action by an individual investor. Therefore, your own due diligence is highly advised before entering a trade.

Bitcoin & Nasdaq VS DollarAs stated in my earlier post , Bitcoin is entering the buy zone.
This time, I would like to provide some additional insight on Nasdaq composite index and US Dollar currency index.
Nasdaq, while definitely not looking bullish, is already in a state of preparation for a short term bounce.
How high it might go? I would say at least around 12.5k.
On the other hand, the U.S. dollar currency index (DXY) is overheated and its meteoric rise is losing momentum. It looks like it's destined for a correction (at least short term).
How deep? At least between 101 and 102.
Please keep in mind that I'm using the weekly chart, so these moves might take 1-2 weeks to materialize.
In a normal market I would be close to sure about the provided forecast, but since most markets are being affected by external factors lately, I am somewhat cautious - therefore my stance is neutral to cautiously short term bullish.

QQQ - QQQ poised to continue lowerWe maintain a bearish notion on QQQ. Accordingly, our short-term price target of 305 USD stays in place; the same applies to our medium-term price target of 300 USD.
Illustration 1.01
The picture above shows increasing selling pressure.
Technical analysis - daily time frame
RSI, MACD, and Stochastic are bearish. DM+ and DM- are bearish too. ADX paused a climb and dipped lower. Despite that, the daily time frame is bearish.
Technical analysis - weekly time frame
RSI, MACD, Stochastic, DM+, and DM- are all bearish. ADX increases, which indicates that the bearish trend is gaining strength. Overall, the weekly time frame is bearish.
Please feel free to express your ideas and thoughts in the comment section.
DISCLAIMER: This analysis is not intended to encourage any buying or selling of any particular securities. Furthermore, it should not serve as a basis for taking any trade action by an individual investor. Therefore, your own due diligence is highly advised before entering a trade.

Liquidity and NASDAQ?Here is a chart comparing the Fed's balance sheet vs. the NASDAQ price since 2003. It seems like NASDAQ chases the balance sheet most times, but gets scared out during tightening (2018-2019), and now. The FED came to save the day in 2019, but will they now? The reaction here seems to price in what the FED balance sheet would be after tightening.

SPX500 manic mondayWatch for support under 4k - bounce could be minor or major. A crack below 3900 this week is a bad sign for bulls, I doubt it happens so quickly TBH.

Daily Market Update for 5/6Summary: The market continued to correct as the US Dollar strengthened and Treasury yields rose on Friday. Defensive sectors in the S&P 500 gained while other sectors sank.
Notes
A brief update today due to holidays and travel. I will be traveling for the next week as well but will try to keep the Daily Market Update going.
Ideas always welcome in the comments. Errors will be amended as comments on TradingView or corrected inline in my blog.
-=x=-=x=-=x=-=x=-=x=-=x=-=x=-
Friday, May 6, 2022
Facts: -1.40%, Volume higher, Closing Range: 42%, Body: 28% Red
Good: Closing range is ok
Bad: Lower high, lower low, higher volume sell-off
Highs/Lows: Lower high, Lower low
Candle: Thin body in middle of long upper and lower wicks
Advance/Decline: 0.27, almost four declining stocks for every advancing stock
Indexes: SPX (-0.57%), DJI (-0.30%), RUT (-1.69%), VIX (-3.24%)
Sector List: Energy (XLE +2.98%) and Utilities (XLU +0.80%) at the top. Materials (XLB -1.43%) and Communications (XLC -2.06%) at the bottom.
-=x=-=x=-=x=-=x=-=x=-=x=-=x=-
Market Overview
A brief update today due to holidays and travel. The market continued to correct as the US Dollar strengthened and Treasury yields rose on Friday. Defensive sectors in the S&P 500 gained while other sectors sank.
-=x=-=x=-=x=-=x=-=x=-=x=-=x=-
Looking ahead
Fed's Raphael Bostic is scheduled to speak on Monday. Bostic is on the hawkish side of the Fed and could stoke fears of higher interest rate hikes despite Jerome Powell's assurance they would limit to 50 basis points.
-=x=-=x=-=x=-=x=-=x=-=x=-=x=-
Trends, Support, and Resistance
The Nasdaq fell to 12,000 before getting support on Friday. Some analysts have forecasted 12,000 as the bottom during this correction, but time and the market will tell if that's true. The 40w EMA is at 11,750.07. The index dipped below this line only in the 2000, 2008, and 2020 crashes.
If the index returns to the trend line from the 3/29 high, that would mean a +0.66% gain for Monday.
The one-day and five-day trend lines point to a -0.67% decline.
-=x=-=x=-=x=-=x=-=x=-=x=-=x=-
Wrap-up
Analysts have been waiting for broad market capitulation and maybe we've seen some over the past two days, or maybe there is more to come. Watch the two levels at 12,000 and 11,750. If those levels hold, then we could see some upside from there.
Stay healthy and trade safe!

IXIC - Rebound or falling further Comment :
1) Nasdaq Index has came to (e) Lv-2 target. Will it be rebound on Lv-2 or breakdown further more?
2) FundFlow+ indicator - Fund flow trend going downward
3) Tricol+ indicator - no banker-/weak- sentiment
Support & Resistance :
S : 12070
Remark :
- Length of ab = cd = de = ef
DISCLAIMER :
Analysis above SOLELY for case study purpose, not a PROFESSIONAL ADVISE. This analysis does not provide any trading advise and buy or sell. Trade at your own risk. Trade only after you have acknowledged and accepted the risks involved.

QQQ - Extremely bearishQQQ dropped a staggering 5% in the previous trading session, and by doing so, it erased its post-FOMC gains. Meanwhile, our price target of 310 USD was reached. Because of that, we would like to update our thoughts on QQQ. We continue to maintain the bearish stance as we think QQQ is due to continue lower. Because of that, we would like to change our medium-term price target of 305 USD to a short-term price target. Our new medium-term price target is 300 USD.
Illustration 1.01
The picture above shows QQQ on the daily chart. Volume bars below the graph indicate that the selling pressure has been increasing.
Technical analysis - daily time frame
RSI, Stochastic, and MACD are bearish. DM+ and DM- also show bearish conditions in the market. ADX suggests that the QQQ might be setting itself to trade within a range for the rest of the week. Overall, the daily time frame is bearish.
Illustration 1.02
As we predicted yesterday, the Nasdaq 100 futures formed a new low.
Technical analysis - weekly time frame
RSI, MACD, Stochastic, DM+ and DM- are bearish. ADX increases, which indicates that the bearish trend is gaining momentum. Overall, the weekly time frame is bearish.
Illustration 1.03
The spike in VIX confirms a bearish consensus.
Please feel free to express your ideas and thoughts in the comment section.
DISCLAIMER: This analysis is not intended to encourage any buying or selling of any particular securities. Furthermore, it should not serve as a basis for taking any trade action by an individual investor. Therefore, your own due diligence is highly advised before entering a trade.

QQQ - Nasdaq 100 is poised to move substantially lowerWe continue to be bearish on QQQ. Because of that, we would like to set a new short-term price target for QQQ at 310 USD. We would also like to set a medium-term price target of 305 USD.
Technical analysis - daily time frame
RSI is neutral. MACD and Stochastic are bearish. The same applies to DM+ and DM-. ADX reflects a strong downtrend. Overall, the daily time frame is bearish.
Technical analysis - weekly time frame
RSI, MACD, Stochastic, DM+, and DM- are all bearish. ADX grows which is bearish. Overall the weekly time frame is bearish.
Please feel free to express your ideas and thoughts in the comment section.
DISCLAIMER: This analysis is not intended to encourage any buying or selling of any particular securities. Furthermore, it should not serve as a basis for taking any trade action by an individual investor. Therefore, your own due diligence is highly advised before entering a trade.
