Daily Market Update for 4/12Trend lines drawn from the 3/5 low (25d), 4/5 (5d) and today 4/9 (1d).
Ideas always welcome in the comments. Errors will be amended as comments on TradingView or corrected inline in my blog.
-=x=-=x=-=x=-=x=-=x=-=x=-=x=-
Monday, April 12, 2021
Facts: -0.36%, Volume higher, Closing range: 71%, Body: -5%
Good: Higher low than previous day, high closing range
Bad: Distribution day, lower high, loss on higher volume
Highs/Lows: Lower high, higher low
Candle: Inside day, thin red body in upper half of candle
Advance/Decline: Almost three declining for every advancing stock
Indexes: SPX (-0.02%), DJI (-0.16%), RUT (-0.16%), VIX (+1.32%)
Sectors: Consumer Discretionary (XLY +0.64%) and Real Estate (XLRE +0.59%) were top. Technology (XLK -0.48%) and Energy (XLE -0.79%) were bottom.
Expectation: Sideways or Lower
-=x=-=x=-=x=-=x=-=x=-=x=-=x=-
Market Overview
After several days of big gains, its ok for the markets to take a pause. Morning selling turned into buying as treasury auctions showed little trouble and yields remained under control. But the confidence wasn't enough to hold the indexes near intraday highs as investors turned their attention to inflation data becoming available Tuesday morning.
The Nasdaq closed the session with a -0.36% decline on higher volume, marking a distribution day for the index. The thin red body of 5% represents indecision between the good news on treasury auctions, but the potential for bad news in inflation data. The positive is that the body is in the upper half of the candle with a high closing range of 71%, showing a slightly more bullishness in the market. There were 3 declining stocks for every advancing stock.
The S&P 500 (SPX) declined -0.02%. The Dow Jones Industrial average (DJI) declined -0.16%. The Russell 2000 (RUT) continues to underperform the other indexes with a -0.43% decline today.
The VIX volatility index advanced +1.32%.
Consumer Discretionary (XLY +0.64%) and Real Estate (XLRE +0.59%) were top performing sectors for the day. Technology (XLK -0.48%) and Energy (XLE -0.79%) were bottom. Energy opened the day at the top of the sector list, but quickly moved to the bottom.
-=x=-=x=-=x=-=x=-=x=-=x=-=x=-
Economic Indicators
The US Dollar (DXY) declined -0.11%.
The US 30y treasury bond yield remained flat while the and 10y treasury note yield advanced. The shorter term 2y note yield advanced, helping bring down the spread between short term and long term.
Prices on both High Yield Corporate Bond (HYG) and Investment Grade Corporate Bond (LQD) declined for the day.
Silver (SILVER) and Gold (GOLD) both declined. Crude Oil (CRUDEOIL1!) advanced. Timber (WOOD) declined slightly. Copper (COPPER1!) declined while and Aluminum (ALI1!) advanced.
-=x=-=x=-=x=-=x=-=x=-=x=-=x=-
Investor Sentiment
The put/call ratio ended the day at 0.596. The put/call ratio (PCCE) is a contrarian indicator that shows overly bullish or overly bearish investor behavior. The 0.7 level is considered normal. As it approaches 0.60 (overly bullish) and below, watch for a possible pullback in the market.
The CNN Fear & Greed index moved back to the neutral area.
-=x=-=x=-=x=-=x=-=x=-=x=-=x=-
Market Leaders
Of the big four mega-caps, Microsoft (MSFT) and Amazon (AMZN) were able to hold onto gains for the day despite closing below intraday highs. Apple (AAPL) and Alphabet (GOOGL) both declined. All four are trading above key moving average lines. Apple is getting close to getting the 21d EMA to cross above the 50d MA.
The accelerated gains for the big four this past week results in their prices getting extended and some pullback or pause may be in order. That may mean another day or two of pause in the indexes as well.
Alibaba (BABA) topped the mega-cap list despite being fined a record amount by the Chinese government over the weekend. The company stated the fine will have little impact to the company and investors must be relieved that the outcome wasn't worse.
Nvidia (NVDA), Tesla (TSLA) and Pfizer (PFE) fill out the remaining top four mega-caps for the day. In addition to Apple and Alphabet, the big mega-cap losers for the day included Taiwan Semiconductor (TSM) and Intel (INTC).
The mega-caps topped the growth stock list as well. Just below them in the list were Snowflake (SNOW), MongoDb (MDB), Okta (OKTA) and DataDog (DDOG). At the bottom of the growth list were FUTU Holdings (FUTU), DraftKings (DKNG), UP Fintech (TIGR) and Ehang Holdings (EH).
-=x=-=x=-=x=-=x=-=x=-=x=-=x=-
Looking ahead
All eyes will be on the Consumer Price Index data for March being released before market open on Tuesday. The data compliments the produce price index data released this past week. The produce price index data is leading indicator to consumer price index data, both providing an outlook on inflation. Investors are fearful of inflation bringing an end to lower interest rates.
Earnings reports will start to pick up this week, but there are no notable earnings for the daily update on Tuesday.
-=x=-=x=-=x=-=x=-=x=-=x=-=x=-
Trends, Support and Resistance
The index is inching toward the 14,000 support/resistance area. A breakthrough of that line will be a confidence booster on the way to new all-time highs for the Nasdaq.
The five-day trend line points to a +0.37% gain for Tuesday. The one-day trend line points to a +0.06% gain.
The trend line from the 3/5 low points to a -1.09% loss.
-=x=-=x=-=x=-=x=-=x=-=x=-=x=-
Wrap-up
It was an indecisive day as investors await inflation data and key earnings reports from big finance this week. For inflation, it seems investors are fearing the worst. That could be a good thing if the data is not quite as frightful as feared.
Last week, the Nasdaq climbed +3.12% while the S&P 500 and Dow Jones Industrial average set new all-time highs. So it should not come as a huge surprise that the market takes a breather, especially as more economic data is on its way. In fact, we may see a little more pullback or sideways action before the Nasdaq marches toward new all-time highs for itself.
Stay healthy and trade safe!
Nasdaq Composite Index CFD

Market Week in Review - 4/5/2021 - 4/9/2021The Market Week in Review is my weekend homework where I look over what happened in the previous week and what might come in the next week. It helps me evaluate my observations, recognize new data points, and create a plan for possible scenarios in the future.
I do occasionally have some errors or typos and will correct them in my blog or in the comments on TradingView. I do not have an editor and do this in my free time.
If you find this helpful, please let me know in the comments. I am also more than happy to add new perspectives and data points if you have ideas.
The structure is the following:
A recap of the daily updates that I do here on TradingView.
The Meaning of Life, a view on the past week
What's coming in the next week
The Bullish View, The Bearish View
Key index levels to watch out for
Wrap-up
If you have been following my daily updates, you can skip down to the “The Meaning of Life”. If not, then this first part is a great play-by-play recap for the week. Click the daily charts for more detail on sectors, indexes and market leaders each day.
-=x=-=x=-=x=-=x=-=x=-=x=-=x=-
Monday, April 5, 2021
Facts: +1.67%, Volume lower, Closing range: 94% (w/Gap), Body: +80%
Good: Three positive days in a row, above 13,700 confirmed with a quick retest
Bad: Lowering volume
Highs/Lows: Higher high, higher low
Candle: Gap up, mostly green body with a slightly longer upper wick
Advance/Decline: About the same number of advancing as declining stocks.
Indexes: SPX (+1.44%), DJI (+1.13%), RUT (+0.49%), VIX (+3.35%)
Sectors: Consumer Discretionary (XLY +2.27%) and Communications (XLC +2.11%) were top. Energy (XLE -2.39%) was the only declining sector.
Expectation: Higher
The markets set new records on Monday led by gains from the largest public companies in Consumer Discretionary, Communications and Technology. The S&P 500 and Dow Jones Industrial marked new all-time highs with a bullish session that began the day with opening gap ups.
The Nasdaq closed the day with a +1.67% gain on lower volume. The closing range of 94% includes the morning gap-up that led to an 80% green body. A minor fade in the afternoon created a slightly longer upper wick than the lower wick but the higher high and higher low continue a strong uptrend from last week's pivot. There were about the same number of gaining stocks as declining stocks.
-=x=-=x=-=x=-=x=-=x=-=x=-=x=-
Tuesday, April 6, 2021
Facts: -0.05%, Volume lower, Closing range: 24%, Body: +16%
Good: Higher high, higher low, held support around 13,700
Bad: Long upper shadow from afternoon selling
Highs/Lows: Higher high, higher low
Candle: Long upper shadow above a thin green body
Advance/Decline: About three declining for every two advancing stocks.
Indexes: SPX (-0.10%), DJI (-0.29%), RUT (-0.25%), VIX (+1.17%)
Sectors: Utilities (XLU +0.53%) and Consumer Discretionary (XLY +0.43%) were top. Health Services (XLV -0.38%) and Technology (XLK -0.43%)
Expectation: Sideways or Higher
There was caution in the market on Tuesday after several days of record setting gains. Investors are monitoring the progress of infrastructure plans and the potential for new taxes. At the same time, the pandemic keeps popping up new fears as Canada declares a very serious third wave.
The Nasdaq closed with a small -0.05% loss, after climbing 0.5% in the morning. The closing range of 24% is above a thin 16% body signaling indecision. The long upper wick was formed from a morning rally that sold off in the afternoon. Still, the index seemed to have support around the 13,700 area, testing the area twice and settling just below the line at the close. There were 3 declining stocks for every 2 advancing stocks.
-=x=-=x=-=x=-=x=-=x=-=x=-=x=-
Wednesday, April 7, 2021
Facts: -0.07%, Volume lower, Closing range: 44%, Body: +17%
Good: Stayed near 13,700 support, lower volume, not a distribution day
Bad: Indecisive candle, no signal on direction
Highs/Lows: Lower high, lower low
Candle: Long upper shadow above a thin green body
Advance/Decline: About three declining for every two advancing stocks.
Indexes: SPX (+0.15%), DJI (+0.05%), RUT (-1.60%), VIX (-5.30%)
Sectors: Communications (XLC +0.77%) and Technology (XLK +0.53%) were top. Industrials (XLI -0.46%) and Materials (XLB -1.72%) were bottom.
Expectation: Sideways
It was a choppy side-ways session today for most of the market. The small caps suffered compared to the larger caps while mid-cap growth stocks had mixed results. Overall, investor sentiment remained cautious without many big reactions to economic news.
The Nasdaq closed with a -0.07% decline, another indecisive day without a clear signal on direction. The 17% body is in the lower half of the candle as the index attempted to find a rally twice but reversed quickly back to the 13,700 area. The closing range of 44% is better than the previous day, but the lower higher and lower low show the bears put up a good fight. There were nearly four declining stocks for every advancing stock.
-=x=-=x=-=x=-=x=-=x=-=x=-=x=-
Thursday, April 8, 2021
Facts: +1.03%, Volume higher, Closing range: 99%, Body: +45%
Good: Gains all-day with few pullbacks, high closing range, higher volume
Bad: Nothing
Highs/Lows: Higher high, higher low
Candle: Longer lower wick under a green body, no upper wick
Advance/Decline: Three advancing for every two declining stocks
Indexes: SPX (+0.42%), DJI (+0.17%), RUT (+0.88%), VIX (-1.22%)
Sectors: Technology (XLK +1.44%) and Consumer Discretionary (XLY +0.47%) were top. Real Estate (XLRE -0.49%) and Energy (XLE -1.30%) were bottom.
Expectation: Higher
Investors shook off early nervousness over higher jobless claims and bulls led the markets rally throughout the day. Treasury yields, the US Dollar and commodity prices all supported Technology as the leading sector of the day, carrying the Nasdaq to the leading index of the day.
The Nasdaq closed with a +1.03% gain on higher volume. The 99% closing range resulted from a 45% green body at the top of the candle which opened with a gap above yesterday's close. The lower wick was formed in the morning, but the index quickly erased the dip with gains into the afternoon that ended with a rally at close. There were three advancing stocks for every declining stock.
-=x=-=x=-=x=-=x=-=x=-=x=-=x=-
Friday, April 9, 2021
Facts: +0.51%, Volume lower, Closing range: 97%, Body: +72%
Good: Never revisited morning low, bullish buying rest of the day
Bad: Nothing
Highs/Lows: Higher high, lower low
Candle: Bullish outside day candle with short lower wick, almost no upper wick
Advance/Decline: Two declining stocks for every advancing stocks
Indexes: SPX (+0.42%), DJI (+0.17%), RUT (+0.88%), VIX (-1.22%)
Sectors: Health (XLV +1.10%) and Industrials (XLI +0.97%) were top. Consumer Staples (XLP -0.17%) and Energy (XLE -0.66%) were bottom.
Expectation: Higher
The morning producer price index numbers are a great sign for the economy as demand increases in manufactured goods indicates consumer demand. It's not a great sign if you are worried about inflation. The markets opened with a dip on the news, but quickly recovered as the dollar pulled back from the morning reaction to the news.
The Nasdaq closed the day with a rally to gain +0.51% with a closing range of 97%. Volume was lower but buyers were present throughout the day, leading to a 72% green body over a small lower wick from the morning dip. The higher high and lower low, with a high closing range, create a bullish outside candle.
-=x=-=x=-=x=-=x=-=x=-=x=-=x=-
The Meaning of Life (View on the Week)
The story of the week was the strength of big tech as the four largest mega-caps broke out of bases and drove indexes and their respective sectors higher. The week also saw a breakout of growth stocks relative to value stocks after a few months of rotation. It's still yet to be determined if the trends will stick, but the charts show a positive trend.
Although it was Apple with the big weekly gain, Alphabet, Microsoft and Tesla all helped kick-off the momentum on Monday. Microsoft continued gains from the previous week's big announcement deal with the US Army. Tesla announced record production and deliveries for the first quarter over the holiday weekend.
The gap-up on Monday took the index well past a declining resistance line. The big gain warranted a pause as the index tested the 13,700 resistance area. The next two days were mostly sideways choppy action. Investors showed caution in the market, signaled by the rise of Utilities from the bottom to the top of the sector chart during Tuesday's session. The caution continued into Wednesday even as mega-caps continued to advance.
Then a surprise consumer credit number arrived late on Wednesday. Instead of a $5B expected number for February, consumer credit rose to $27.58 signaling that consumers were not only confident (from the previous weeks data), but were spending money.
That was enough to continue the rally and the Nasdaq opened with another gap up on Thursday despite disappointing jobless claims in the morning. On top of the economic data, the USD dollar continued to weaken while the treasury yield curve was flattening and commodity prices showed high demand. It was bullish for the economy and the right context to see big tech and growth stocks soar.
Friday ended the week with an outside day. Prices dipped in the morning as inflation worries crept back into investors' minds after the produce price index data was higher than expected. Those worries subsided and the index continued its rally into the close for the week.
The Nasdaq advanced +3.12% for the week. The closing range is 99% for a second week in a row. Volume was lower.
The lowering volume trend is largely due to the absence of the retail investor. That is confirmed by VandaTrack, which tracks retail investors and shows they are taking a step back from the market. That's bad news if you want to play your hand in the next YOLO meme stock trade. But it's good news if you want to see fewer swings in the value of your portfolio.
The higher high and higher low is a great signal of the uptrend. The index closed just above 13,900 and is working toward the round number resistance of 14,000 before it moves toward a new all-time high.
The S&P 500 (SPX) and Dow Jones Industrial (DJI) both set new all-time highs, making +2.71% and +1.95% advances for the week. The Russell 2000 (RUT) retreated -0.46% for the week.
The Russell 2000 was outperforming since August but has been consolidating since hitting an all-time high in March. Certainly, small-caps and the index will benefit from market rallies, but the question will be at what level of relative performance to the rest of the market. This is something to watch over the coming weeks.
The VIX volatility index closed well with the pre-pandemic price range with another -3.69% decline. The absence of retail investors seems to have helped reduce some of the volatility in the market as well.
Growth broke out this week relative to value stocks. The dip in relative performance hit a low on March 8 and chopped back and forth before making a big move this week.
The S&P 500 was dominated by three growth sectors for the week.
Technology ( XLK ) finished the week as the top sector, taking the top spot on Thursday and Friday as big tech companies solidified breakouts from their recent consolidations.
Likewise, Consumer Discretionary ( XLY ) and Communication Services ( XLC ) finished in second and third place largely thanks for mega-caps that are overweight in the lists.
Energy ( XLE ) was at the bottom of the list with over a 4% decline. Some of that may be attributed to mixed outlook from analysts on supply and demand for oil . But Energy also tends to suffer when a large amount of investment rotates into the three big growth sectors.
Only Energy declined for the week. The other sectors had gains, albeit underperformed the broader S&P 500 index .
The 30y treasury bond yield gained slightly while the 10y note yield declined. The US 2y note yield also declined. Most importantly, the yield curve continues its trend of flattening, helping improve investor confidence in growth companies impacted by interest rates.
Both the High Yield Corporate Bond (HYG) and Investment Grade Bond (LQD) prices advanced for the week. The spread between corporate bonds and treasury bonds still has some tightening to get back to pre-pandemic levels, but the trend is heading in the right direction.
The US Dollar (DXY) retreated -0.89% this week giving a boost to big multi-national companies that can benefit from a weakened US Dollar.
The recovery of economic activity is accelerating and that can be seen clearly in demand for commodities.
Silver (SILVER) and Gold (GOLD) both advanced for the week.
Crude Oil Futures (CRUDEOIL1!) declined for the week as investors balance the increased output with expected recovery in demand.
Timber (WOOD) advanced for another week.
Copper (COPPER1!) and Aluminum (ALI1!) both advanced for the week.
-=x=-=x=-=x=-=x=-=x=-=x=-=x=-
The Big Four Mega-caps
It was a great week for the big four mega-caps. They all drove the indexes and their respective sectors higher.
Apple (AAPL) gained + 8.13%, Microsoft (MSFT) gained +5.57%, Amazon (AMZN) gained +6.68%, and Alphabet (GOOGL) gained +6.62%. All four now show the 10 week moving average line above the 40 week moving average line, confirming their uptrends.
As an added signal behind the strength of these breakout moves in the mega-caps, note at the volume is higher for all of them and at the bottom, the thick blue bars show a strong outperformance of the Nasdaq.
-=x=-=x=-=x=-=x=-=x=-=x=-=x=-
The Four Recovery Stocks
I picked four recovery stocks to track against the indexes and other indicators in this weekly report. Carnival Cruise Lines (CCL) gained over 9% after providing a cautiously optimistic outlook for this year during their earnings announcement. Delta Airlines (DAL) and Marriott (MAR) both held onto gains for the week, despite their red candles. Exxon Mobil (XOM) declined for the week, pulled down by downgrade of Chevron and sell-off of Energy stocks.
-=x=-=x=-=x=-=x=-=x=-=x=-=x=-
Investor Sentiment
The put/call ratio (PCCE) closed the week 0.588. A contrarian indicator, when the put/call ratio is below 0.7, it signals overly bullish sentiment and could mean an overbought market.
The CNN Fear & Greed index remained in the same area, on the side of greed, for most of the week.
The NAAIM exposure index rose to 89.85, showing money managers are increasing position sizes again.
-=x=-=x=-=x=-=x=-=x=-=x=-=x=-
The Week Ahead
There will be Treasury auctions for 10y and 3y notes on Monday afternoon. The performance of those auctions could impact investor sentiment in the bond market and send yields in either direction.
Consumer Price Index data for March will be released on Tuesday. The data compliments the produce price index data released this past week. The produce price index data is leading indicator to consumer price index data, both providing an outlook on inflation.
Economic news for Wednesday includes Export/Import Price index data before markets open. Crude Oil Inventory data will be released after the market opens.
Thursday has several economic data releases. Initial Jobless Claims data before the market opens will hopefully recover a bit from last week's negative surprise. Retail Sales data for March should show an improvement over the February numbers that were brought down by weather events. The Manufacturing Index data and Industrial Production data will also be leading indicators on the recovery of economic activity.
Building Permits and Housing Starts data will be released on Friday morning. We will also get an update on Consumer Expectations and Consumer Sentiment.
This quarters earning season will pick up next week, dominated by earnings reports in the Financial sector.
Monday and Tuesday do not have any notable reports for the daily update.
On Wednesday, JP Morgan (JPM), Wells Fargo (WFC), Goldman Sachs (GS) will release earnings reports. In addition, retail stocks Bed, Bath and Beyond (BBBY) and Lovesac (LOVE) will release earnings.
On Thursday, the Financial sector earnings reports will include Bank of America (BAC), Citigroup (C), Charles Schwab (SCHW) and BlackRock (BLK). Taiwan Semiconductor (TSM), UnitedHealth (UNH), Delta Airlines (DAL) will also be closely watch earnings reports for the day.
Friday's reports include Honeywell (HON) and Morgan Stanley (MS).
-=x=-=x=-=x=-=x=-=x=-=x=-=x=-
The Bullish Side
A lot of the bullish side is a continuation of the signals we saw at the end of the previous week. The mega-caps continued breakout moves on higher volume this week which has led the indexes higher and restored confidence in big tech and growth stocks.
The volatility in the market continues to drop to pre-pandemic levels as retail investors spent new stimulus checks on something other than meme stocks. The US Dollar and Treasury Yields have also stopped their climbs that was causing investors to worry about interest rates impacting growth companies while the US Dollar impacts the bottom line of multi-nationals.
The growth sectors of Technology, Communications and Consumer Discretionary are leading the market higher. These sectors focused on innovation, have been responsible for many of the big rallies over the past decade.
The pop in consumer credit came as a positive surprise this past week. Consumer sentiment numbers this week could add to the positive outlook on spending as consumers unleash record-setting savings and new stimulus checks into the economy.
-=x=-=x=-=x=-=x=-=x=-=x=-=x=-
The Bearish Side
Investors are not worry-free. Biden's infrastructure plans and proposal for higher corporate taxes are having analysts and investors calculating the impact to sectors and valuations of US companies. The progress of these proposals in congress will keep investors on their toes for the coming weeks.
Inflation also continues to be a top worry, stoked by Friday's produce price index data. The inflation outlook could get worse as consumer price index data is released this week. The Fed's assurance to not change monetary policy to control inflation only helps calm the worries to a certain degree.
Energy being at the bottom of the sector list is another sign of the uncertainty. Analysts are watching closely as the pandemic hits third-waves in many countries which could cause lower than hoped demand for travel and leisure, and likewise lower demand for oil. While OPEC is cautiously increasing supply, a sharp pull back in demand will cause the sector further losses.
-=x=-=x=-=x=-=x=-=x=-=x=-=x=-
Key Nasdaq Levels to Watch
The Nasdaq cleared key areas of resistance this past week, leaving just a few key levels in between Friday's close and a new all-time high.
On the positive side, the levels are:
13,905.41 is the high of this week. Make a new high for next week to continue the uptrend.
14,000 will be the next area of resistance. Round numbers tend to be areas of resistance as they become triggers for alerts and buy/sell rules.
The all-time high is at 14,175.12. That might be a stretch to get there this week, but keep it in our sites.
On the downside, there are a few key levels:
The low of this past week is 13,582.76.
The moving average lines are all very close together. The 10d MA is at 13,479.31.
The 50d moving average is at 13,452.07.
The 21d exponential moving average is at 13,439.48. Look for the index to stay above these averages and for the 21d EMA to cross above the 50d MA.
The lower line of the channel from the March 2020 bottom is around 13,128 for next week.
The low of this past week is 12,922.57. Stay above that price to give us a higher low for this week.
-=x=-=x=-=x=-=x=-=x=-=x=-=x=-
Wrap-up
The signals looked good coming into this week and continue to show positive signs for next week. There are certainly a few things we'd like to see to remain confident.
For the Nasdaq, clear the 14,000 line and set a new all-time high, joining the other major indexes. That will require big tech and growth stocks to continue to rally.
The Russell 2000 is not participating in the rally thus far. Having it break out of the symmetrical triangle and begin moving along with the other indexes will be a positive sign of broad support in the market.
There's a lot of be positive about, but don't forget things can always change quickly.
Good luck, stay healthy and trade safe!

Amazon (AMZN), DJI, IXIC, SPX, XAUUSD, USOIL - April 8Hello?
Dear traders, nice to meet you.
By "following" you can always get new information quickly.
Please also ask for the "Like" clock.
Have a nice day.
----------------------------------
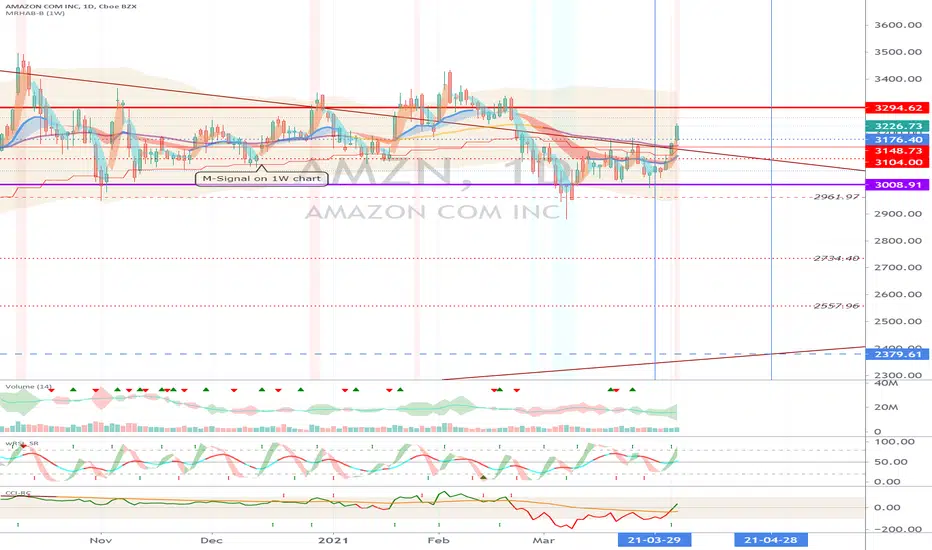
You should watch for any movement that deviates from the box section 3008.91-3294.62.
If the CCI line rises by more than 100 points on the CCI-RC indicator, volatility may occur, so careful trading is necessary.
----------------------------
(DJI 1D chart)
It started with the gap (33430.2-33445.0) rising and ended at 0.05%.
-----------------------------
(IXIC 1D chart)
It started with the gap (13698.4-13675.3) falling and closed at -0.07%.
----------------------------
(SPX 1D chart)
It started with an increase in the gap (4073.9-4074.3) and closed at 0.15%.
-----------------------------
(XAUUSD 1D chart)
We need to see if we can get support at 1727.175 and climb along the uptrend line.
---------------------------------------
(USOIL 1D chart)
You should watch for any movement that deviates from the 55.26-60.25 segment.
-------------------------------------------------- -------------------------------------------
** All indicators are lagging indicators.
So, it's important to be aware that the indicator moves accordingly with the movement of price and volume.
Just for the sake of convenience, we are talking upside down for interpretation of the indicators.
** The wRSI_SR indicator is an indicator created by adding settings and options from the existing Stochastic RSI indicator.
Therefore, the interpretation is the same as the conventional stochastic RSI indicator. (K, D line -> R, S line)
** The OBV indicator was re-created by applying a formula to the DepthHouse Trading indicator, an indicator published by oh92. (Thank you for this.)
** Check support, resistance, and abbreviation points.
** Support or resistance is based on the closing price of the 1D chart.
** All explanations are for reference only and do not guarantee profit or loss on investment.
Explanation of abbreviations displayed on the chart
R: A point or section of resistance that requires a response to preserve profits
S-L: Stop Loss point or section
S: A point or segment that can be bought for profit generation as a support point or segment
(Short-term Stop Loss can be said to be a point where profits and losses can be preserved or additionally entered through installment transactions. It is a short-term investment perspective.)
GAP refers to the difference in prices that occurred when the stock market, CME, and BAKKT exchanges were closed because they are not trading 24 hours a day.
G1: Closing price when closed
G2: Cigar at the time of opening
(Example) Gap (G1-G2)

Daily Market Update for 4/9Trend lines drawn from the 3/5 low (25d), 4/5 (5d) and today 4/9 (1d).
Ideas always welcome in the comments. Errors will be amended as comments on TradingView or corrected inline in my blog.
-=x=-=x=-=x=-=x=-=x=-=x=-=x=-
Friday, April 9, 2021
Facts: +0.51%, Volume lower, Closing range: 97%, Body: +72%
Good: Never revisited morning low, bullish buying rest of the day
Bad: Nothing
Highs/Lows: Higher high, lower low
Candle: Bullish outside day candle with short lower wick, almost no upper wick
Advance/Decline: Two declining stocks for every advancing stocks
Indexes: SPX (+0.42%), DJI (+0.17%), RUT (+0.88%), VIX (-1.22%)
Sectors: Health (XLV +1.10%) and Industrials (XLI +0.97%) were top. Consumer Staples (XLP -0.17%) and Energy (XLE -0.66%) were bottom.
Expectation: Higher
-=x=-=x=-=x=-=x=-=x=-=x=-=x=-
Market Overview
The morning producer price index numbers are a great sign for the economy as demand increases in manufactured goods indicates consumer demand. It's not a great sign if you are worried about inflation. The markets opened with a dip on the news, but quickly recovered as the dollar pulled back from the morning reaction to the news.
The Nasdaq closed the day with a rally to gain +0.51% with a closing range of 97%. Volume was lower but buyers were present throughout the day, leading to a 72% green body over a small lower wick from the morning dip. The higher high and lower low, with a high closing range, create a bullish outside candle.
The day was dominated by industrials and mega-caps as the Dow Jones Industrial average (DJI) closed at a new all-time high with a +0.89% gain. The S&P 500 (SPX) also set a record close after a +0.77% gain. The Russell 2000 (RUT) did not do as well but still was able to squeak out a gain of +0.04%.
The VIX volatility index declined -1.53%, continuing to move lower into its pre-pandemic trading range.
Health (XLV +1.10%) and Industrials (XLI +0.97%) were top. Consumer Staples (XLP -0.17%) and Energy (XLE -0.66%) were bottom. The sectors don't hold any big surprises except Energy which rose to the top of the list just after market open and quickly sank to the bottom by mid-day as the outlook for demand vs supply was mixed among investors.
-=x=-=x=-=x=-=x=-=x=-=x=-=x=-
Economic Indicators
The US Dollar (DXY) rose +0.12% but was well off intraday highs driven by the inflation outlook.
The US 30y treasury bond and 10y and 2y note yields all advanced.
Both High Yield Corporate Bond (HYG) and Investment Grade Corporate Bond (LQD) prices both declined slightly.
Silver (SILVER) and Gold (GOLD) both declined. Crude Oil (CRUDEOIL1!) declined just slightly. Timber (WOOD) advanced. Copper (COPPER1!) and Aluminum (ALI1!) declined. Nothing alarming in the commodities. Oil was choppy intraday as analysts tried to figure out the supply and demand outlook.
-=x=-=x=-=x=-=x=-=x=-=x=-=x=-
Investor Sentiment
The put/call ratio ended the day at 0.588. The put/call ratio (PCCE) is a contrarian indicator that shows overly bullish or overly bearish investor behavior. The 0.7 level is considered normal. As it approaches 0.60 (overly bullish) and below, watch for a possible pullback in the market.
The CNN Fear & Greed index is remained about the same, on the greed side.
-=x=-=x=-=x=-=x=-=x=-=x=-=x=-
Market Leaders
The big four mega-caps continue to rise. Apple (AAPL) gained +2.02% and Amazon (AMZN) gained +2.21%. Both are moving toward their 21d EMA crossing above the 50d MA to solidify the uptrend. Microsoft (MSFT) and Alphabet (GOOGL) already met that milestone and gained +1.03% and 0.90% for the day.
United Health (UNH) topped the mega-cap list helping the Health services sector lead for the day. Salesforce.com (CRM), Amazon (AMZN) and Apple (AAPL) round out the top performing mega-caps. As the bottom of the list were Alibaba (BABA), Comcast (CMCSA), Johnson & Johnson (JNJ) and Tesla (TSLA).
Moderna (MRNA) topped the growth stock list that is about half-and-half gainers and losers. UP Fintech (TIGR), Chewy (CHWY) and Palantir (PLTR) also were at the top of the list. Peloton (PTON), Beyond Meat (BYND), Snowflake (SNOW) and Zoom Video (ZM) were at the bottom of the list.
-=x=-=x=-=x=-=x=-=x=-=x=-=x=-
Looking ahead
Monday will kick-off next week with a 10-year Treasury Note Auction in the afternoon.
Earnings reports will start to pick up next week, but there are no notable earnings for the daily update on Monday or Tuesday.
-=x=-=x=-=x=-=x=-=x=-=x=-=x=-
Trends, Support and Resistance
The index is inching toward the 14,000 support/resistance area. A breakthrough of that line will be a confidence booster on the way to new all-time highs for the Nasdaq.
The five-day and one-day trend lines point to a +0.34% gain on Monday.
The trend line from the 3/5 low points to a -1.91% loss.
-=x=-=x=-=x=-=x=-=x=-=x=-=x=-
Wrap-up
The day was for the large/mega caps and industrials. Some mid-cap growth stocks also did well. The Russell 2000 and small-caps seemed to give back are consolidating in a bullish symmetric triangle. We can expect the index to eventually breakout and join the other indexes if the market continues upward.
I'm confident it will follow the market trend, but the question will be at what pace. The small cap index was on a tear from September to March, outperforming everything, but pulled back with the recent rotations. Will it pick back up the previous pace or will it underperform the other indexes.
Stay healthy and trade safe!

Daily Market Update for 4/8Trend lines drawn from the 3/5 low (24d), 4/1 (5d) and today 4/8 (1d).
Ideas always welcome in the comments. Errors will be amended as comments on TradingView or corrected inline in my blog.
-=x=-=x=-=x=-=x=-=x=-=x=-=x=-
Thursday, April 8, 2021
Facts: +1.03%, Volume higher, Closing range: 99%, Body: +45%
Good: Gains all-day with few pullbacks, high closing range, higher volume
Bad: Nothing
Highs/Lows: Higher high, higher low
Candle: Longer lower wick under a green body, no upper wick
Advance/Decline: Three advancing for every two declining stocks
Indexes: SPX (+0.42%), DJI (+0.17%), RUT (+0.88%), VIX (-1.22%)
Sectors: Technology (XLK +1.44%) and Consumer Discretionary (XLY +0.47%) were top. Real Estate (XLRE -0.49%) and Energy (XLE -1.30%) were bottom.
Expectation: Higher
-=x=-=x=-=x=-=x=-=x=-=x=-=x=-
Market Overview
Investors shook off early nervousness over higher jobless claims and bulls led the markets rally throughout the day. Treasury yields, the US Dollar and commodity prices all supported Technology as the leading sector of the day, carrying the Nasdaq to the leading index of the day.
The Nasdaq closed with a +1.03% gain on higher volume. The 99% closing range resulted from a 45% green body at the top of the candle which opened with a gap above yesterday's close. The lower wick was formed in the morning, but the index quickly erased the dip with gains into the afternoon that ended with a rally at close. There were three advancing stocks for every declining stock.
The Russell 2000 (RUT) rallied after a few days of declines and ended the day with a +0.88% gain. The S&P 500 advanced +0.42% and the Dow Jones Industrial average (DJI) closed with a +0.17% gain.
The VIX volatility index declined -1.22% and is now well within the pre-pandemic range of highs and lows.
Technology (XLK +1.44%) and Consumer Discretionary (XLY +0.47%) were top sectors for the day. Utilities (XLU -0.08%) opened with gains in the morning but faded to near the bottom of the list by the end of the day. Real Estate (XLRE -0.49%) and Energy (XLE -1.30%) were the worst performing sectors of the day.
-=x=-=x=-=x=-=x=-=x=-=x=-=x=-
Economic Indicators
The US Dollar (DXY) declined -0.38% continues to retreat from a pivot high at the end of March.
The US 30y treasury bond and 10y and 2y note yields all declined. The yield curve continued its trend of flattening.
Both High Yield Corporate Bond (HYG) and Investment Grade Corporate Bond (LQD) prices both advanced.
Silver (SILVER) and Gold (GOLD) both advanced. Crude Oil (CRUDEOIL1!) declined just slightly. Timber (WOOD) advanced. Copper (COPPER1!) advanced while Aluminum (ALI1!) declined. All are showing strong demand and bullish for the economic recovery.
-=x=-=x=-=x=-=x=-=x=-=x=-=x=-
Investor Sentiment
The put/call ratio ended the day at 0.592. The put/call ratio (PCCE) is a contrarian indicator that shows overly bullish or overly bearish investor behavior. The 0.7 level is considered normal. As it approaches 0.60 (overly bullish) and below, watch for a possible pullback in the market.
The CNN Fear & Greed index is remained about the same, on the greed side.
The NAAIM exposure index rose to 89.95 from 52.02 the previous week. The index, released on Wednesday evenings represents the amount of exposure in active investment managers portfolios.
-=x=-=x=-=x=-=x=-=x=-=x=-=x=-
Market Leaders
All four big mega-caps gained for another day. Apple (AAPL) and Microsoft (MSFT) climbed +1.92% and +1.34%, helping carry the indexes into close. Amazon (AMZN) and Alphabet (GOOGL) gained +0.61% and +0.51%, but closed in the lower half of the intraday range. We are still anticipating the crossover of the 21d EMA over the 50d MA for Apple and Amazon which will signal a confident uptrend. Microsoft and Alphabet have already met that milestone.
PayPal (PYPL +3.48%), Taiwan Semiconductor (TSM +2.95%), ASML Holding (ASML +2.13%), Tesla (TSLA +1.91%) were at the top of the mega-cap list. Big communications companies Verizon (VZ) and AT&T (T) joined Nike (NIKE) at the bottom of the list, all with over 2% declines.
Today was much better for growth stocks than the previous day, with the majority of growth in the daily update list having gains. UP Fintech (TIGR), GrowGeneration (GRWG), FUTU Holdings (FUTU) topped the list with over 10% gains each. Draft Kings (DKNG) and Dr Horton (DHI) were at the bottom of the list.
-=x=-=x=-=x=-=x=-=x=-=x=-=x=-
Looking ahead
On Friday, the producer price index data will be released that gives a view into inflation. Expect the US dollar and Treasury Yields to be impacted if the number is far off forecast.
There are no notable earnings reports for Thursday for the daily update.
-=x=-=x=-=x=-=x=-=x=-=x=-=x=-
Trends, Support and Resistance
The index is nearing the 14,000 support/resistance area. A breakthrough of that line will be a confidence booster on the way to new all-time highs for the Nasdaq.
The five-day trend line points to a +1.16% gain on Friday. The one-day trend line points to a small gain of +0.16%.
The trend line from the 3/5 low points to a -1.85% loss.
-=x=-=x=-=x=-=x=-=x=-=x=-=x=-
Wrap-up
Everything lined up nicely for big tech and growth stocks today. Yields dropped back as the yield curve continues to flatten. The US dollar weakened, benefiting big multinational companies. Commodities show high demand indicating economic activity picking back up.
Eyes will be on the produce price index data tomorrow before market opens. Higher prices would indicate more demand for products as a result of increased spending, but it may also make investors nervous about inflation. Still, Jerome Powell held firm today that inflation was unlikely, so investors will have to balance their worries with assurances from the Fed that changes in economic policy are still long off in the future. Don't fight the fed.
The resurgence of growth stocks continues to accelerate relative to value stocks. The gains were broad across the category today. Many of the charts for growth have a long way to go to get past overhead supply and reach new all-time highs. Value stocks have leveled off for the past few weeks, could be basing and may have some more growth of their own.
Stay healthy and trade safe!

Daily Market Update for 4/7Trend lines drawn from the 3/5 low (23d), 3/31 (5d) and today 4/7 (1d).
Ideas always welcome in the comments. Errors will be amended as comments on TradingView or corrected inline in my blog.
-=x=-=x=-=x=-=x=-=x=-=x=-=x=-
Wednesday, April 7, 2021
Facts: -0.07%, Volume lower, Closing range: 44%, Body: +17%
Good: Stayed near 13,700 support, lower volume, not a distribution day
Bad: Indecisive candle, no signal on direction
Highs/Lows: Lower high, lower low
Candle: Long upper shadow above a thin green body
Advance/Decline: About three declining for every two advancing stocks.
Indexes: SPX (+0.15%), DJI (+0.05%), RUT (-1.60%), VIX (-5.30%)
Sectors: Communications (XLC +0.77%) and Technology (XLK +0.53%) were top. Industrials (XLI -0.46%) and Materials (XLB -1.72%) were bottom.
Expectation: Sideways
-=x=-=x=-=x=-=x=-=x=-=x=-=x=-
Market Overview
It was a choppy side-ways session today for most of the market. The small caps suffered compared to the larger caps while mid-cap growth stocks had mixed results. Overall, investor sentiment remained cautious without many big reactions to economic news.
The Nasdaq closed with a -0.07% decline, another indecisive day without a clear signal on direction. The 17% body is in the lower half of the candle as the index attempted to find a rally twice but reversed quickly back to the 13,700 area. The closing range of 44% is better than the previous day, but the lower higher and lower low show the bears put up a good fight. There were nearly four declining stocks for every advancing stock.
The S&P 500 (SPX) closed the day with a +0.15% gain while the Dow Jones Industrial average (DJI) gained +0.05%. Both indexes were helped by mega-caps. The small caps didn’t fare so well. The Russell 2000 (RUT) fell -1.60% in a bearish day for the sector.
The VIX volatility index declined +5.30% and closed at its lowest point since before the pandemic.
Communications (XLC +0.77%) and Technology (XLK +0.53%) led the sector list. Industrials (XLI -0.46%) and Materials (XLB -1.72%) were at the bottom. Utilities (XLU -0.12%) retreated from the top of the list yesterday, signaling a bit more confidence among investors despite the subdued results in the indexes.
-=x=-=x=-=x=-=x=-=x=-=x=-=x=-
Economic Indicators
The US Dollar (DXY) declined -0.29% but did not seem to be impacted by the morning change in sentiment.
The US 30y treasury bond and 10y note yields both advanced for the day while 2y note yield declined. The yield curve steepened, but is still in a flattening trend since the beginning of April.
Both High Yield Corporate Bond (HYG) and Investment Grade Corporate Bond (LQD) prices declined slightly for the day.
Silver (SILVER) and Gold (GOLD) both declined. Crude Oil (CRUDEOIL1!) gained for a second day. Timber (WOOD) advanced. Copper (COPPER1!) advanced while Aluminum (ALI1!) declined. All are still showing strong demand.
-=x=-=x=-=x=-=x=-=x=-=x=-=x=-
Investor Sentiment
The put/call ratio ended the day at 0.589. The put/call ratio (PCCE) is a contrarian indicator that shows overly bullish or overly bearish investor behavior. The 0.7 level is considered normal. As it approaches 0.60 (overly bullish) and below, watch for a possible pullback in the market.
The CNN Fear & Greed index is remained about the same, on the greed side.
-=x=-=x=-=x=-=x=-=x=-=x=-=x=-
Market Leaders
All four big mega-caps gained for the day and all four closed above the key moving average lines now that Apple (AAPL) finally closed above the 50d MA. The next milestone for these four will be to get the 21d EMA above the 50d MA showing a lasting trend after the dips in March. Microsoft (MSFT) and Alphabet (GOOGL) are already there. Apple (AAPL) and Amazon (AMZN) still have the 21d EMA below the 50d MA but are starting to close the gap.
Facebook (FB), Nvidia (NVDA), Amazon (AMZN) and JP Morgan Chase (JPM) are an interestingly diverse set of mega-caps to top the list for the day, representing four difference sectors. At the bottom of the list is Tesla (TSLA), Alibaba (BABA), Taiwan Semiconductor (TSM) and Walt Disney (DIS).
It was a challenging day for growth stocks as the majority of the daily update list had declines. SNAP (SNAP), Square (SQ), Twitter (TWTR) and PayPal (PYPL) topped the list, echoing the sector leaders. At the bottom of the list were yesterday's growth stock leaders including UP Fintech (TIGR) and Ehang Holdings (EH). Enphase (ENPH) and Solar Edge (SEDG) were also near the bottom despite getting a boost the previous day.
-=x=-=x=-=x=-=x=-=x=-=x=-=x=-
Looking ahead
Thursday brings the weekly Job Claims in the morning. At noon, Fed Chair Jerome Powell is scheduled to speak which will be watched closely and balanced against the FOMC Meeting Minutes from last month that were released today.
There are no notable earnings reports for Thursday for the daily update.
-=x=-=x=-=x=-=x=-=x=-=x=-=x=-
Trends, Support and Resistance
The index still has support in the 13,600-13,700 area and stayed above it after two tests today.
The five-day trend line points to a +1.89% gain on Wednesday. The one-day trend line is nearly flat and points to a sideways move tomorrow.
The trend line from the 3/5 low points to a -1.40% loss, which is just above the 50d MA.
-=x=-=x=-=x=-=x=-=x=-=x=-=x=-
Wrap-up
Indecision. Investors eyes were on the FOMC Meeting Minutes but sentiment remained unchanged after they were released. It sent the same message we've been hearing from the Fed, including a strong commitment to economic recovery while pushing off any policy changes until substantial progress is made.
In a surprise at the end of the day, consumer credit for February was much higher than expected showing economic stimulus starting to work toward getting consumers spending again.
It seems that growth stocks are beginning to gain ground again compared to value stocks. Since the beginning of March, this chart that compares Growth to Value has pivoted from a sharp decline that started in August.
It has not been an easy rotation. There is still a lot of back and forth with growth stocks, and new winners are being sought out. The churn is likely caused by the mass exit of retail investors from the market. Those investors were heavily leaning on growth stocks in 2020 and the beginning of 2021, but volume has dropped significantly as lock downs end and consumers find other things to spend money on.
Keep an eye out for new opportunities as the 2021 winners begin to emerge.
Stay healthy and trade safe!

Daily Market Update for 4/6Trend lines drawn from the 3/5 low (22d), 3/30 (5d) and today 4/6 (1d).
Ideas always welcome in the comments. Errors will be amended as comments on TradingView or corrected inline in my blog.
-=x=-=x=-=x=-=x=-=x=-=x=-=x=-
Tuesday, April 6, 2021
Facts: -0.05%, Volume lower, Closing range: 24%, Body: +16%
Good: Higher high, higher low, held support around 13,700
Bad: Long upper shadow from afternoon selling
Highs/Lows: Higher high, higher low
Candle: Long upper shadow above a thin green body
Advance/Decline: About three declining for every two advancing stocks.
Indexes: SPX (-0.10%), DJI (-0.29%), RUT (-0.25%), VIX (+1.17%)
Sectors: Utilities (XLU +0.53%) and Consumer Discretionary (XLY +0.43%) were top. Health Services (XLV -0.38%) and Technology (XLK -0.43%)
Expectation: Sideways or Higher
-=x=-=x=-=x=-=x=-=x=-=x=-=x=-
Market Overview
There was caution in the market on Tuesday after several days of record setting gains. Investors are monitoring the progress of infrastructure plans and the potential for new taxes. At the same time, the pandemic keeps popping up new fears as Canada declares a very serious third wave.
The Nasdaq closed with a small -0.05% loss, after climbing 0.5% in the morning. The closing range of 24% is above a thin 16% body signaling indecision. The long upper wick was formed from a morning rally that sold off in the afternoon. Still, the index seemed to have support around the 13,700 area, testing the area twice and settling just below the line at the close. There were 3 declining stocks for every 2 advancing stocks.
The S&P 500 closed the day with a -0.10% after setting another all-time high in the morning. The Dow Jones Industrial average (DJI) and Russell 2000 (RUT) both delivered inside days (lower high, higher low) with -0.29% and -0.25% declines.
The VIX volatility index advanced +1.17%.
The sectors show a clear shift in investor sentiment about an hour after open. Energy was leading the sector list in the morning before a downgrade of Chevron by Goldman Sachs. The downgrade doesn't explain it all as Exxon Mobil and oil prices also came down from morning highs.
The other signal of investor nervousness was the shift of Utilities (XLU) from the bottom sector in the morning to the top sector at close. The only other sector that seemed to react to the change in sentiment was Financials (XLF) likely as investors bought up treasuries and brought long term yields down.
Utilities (XLU) and Consumer Discretionary (XLY) ended the day at the top sector list. Health Services (XLV) and Technology (XLK) ended the day at the bottom.
-=x=-=x=-=x=-=x=-=x=-=x=-=x=-
Economic Indicators
The US Dollar (DXY) declined -0.29% but did not seem to be impacted by the morning change in sentiment.
The US 30y treasury bond and 10y note yields both declined for the day while 2y note yields rose. The yield curve continues to flatten.
High Yield Corporate Bond (HYG) and Investment Grade Corporate Bond (LQD) prices advanced and continue in an uptrend.
Silver (SILVER) and Gold (GOLD) both advanced. Crude Oil (CRUDEOIL1!) ended the day with gains, despite pulling back from morning highs. Timber (WOOD) advanced. Copper (COPPER1!) declined while Aluminum (ALI1!) advanced. All are still showing strong demand.
-=x=-=x=-=x=-=x=-=x=-=x=-=x=-
Investor Sentiment
The put/call ratio ended the day at 0.523. The put/call ratio (PCCE) is a contrarian indicator that shows overly bullish or overly bearish investor behavior. The 0.7 level is considered normal. As it approaches 0.60 (overly bullish) and below, watch for a possible pullback in the market.
The CNN Fear & Greed index is remained about the same, on the greed side.
-=x=-=x=-=x=-=x=-=x=-=x=-=x=-
Market Leaders
Among the big four mega-caps, only Apple (AAPL) ended the day with gains. However the declines across the other three were not enough to invalidate breakouts. With the big gains over the previous three sessions, there should be no surprise for prices to pause here. Microsoft (MSFT), Amazon (AMZN) and Alphabet (GOOGL) are all trading above both key moving average lines (the 21d EMA and 50d MA). Apple hit resistance at the 50d MA and closed below the line.
Alibaba (BABA), Nike (NIKE) and AT&T (T) were some of the top mega-cap gainers for the day. At the bottom were Intel (INTC), United Health (UNH), Taiwan Semiconductor (TSM) and ASML Holding (ASML).
Most of the growth stocks in the daily update list had gains for the day. Top winners were ROKU (ROKU), UP Fintech (TIGR), Ehang Holdings (EH) and DataDog (DDOG). Investors still seem a bit uncertain which of these growth names will benefit with the economic recovery as they still chop back and forth regularly. For example Zynga (ZNGA) was near the top of the list yesterday, and at the bottom of the list today. DataDog at the bottom of the list yesterday and near the top today.
-=x=-=x=-=x=-=x=-=x=-=x=-=x=-
Looking ahead
There will be a few key updates on Wednesday morning. First employment data for March will be updated. Purchasing Managers Index data will indicate how much purchasing activity is happening in order to meet manufacturing demands. Pending Home Sales and Crude Oil Inventories will be released after market open.
There are no notable earnings reports for Wednesday for the daily update.
-=x=-=x=-=x=-=x=-=x=-=x=-=x=-
Trends, Support and Resistance
The index still has support in the 13,600-13,700 area and stayed above it after two tests today.
The five-day trend line points to a +2.10% gain on Wednesday. The one-day trend line is nearly flat and points to a sideways move tomorrow.
The trend line from the 3/5 low points to a -1.90% loss, which is just above the 50d MA.
-=x=-=x=-=x=-=x=-=x=-=x=-=x=-
Wrap-up
Investors showed some nervousness today mid-morning, changing momentum in the market for several sectors. Despite the switch in sentiment, key areas of support held and we could view the day's result as a pause during a fairly aggressive uptrend the past few days.
Still, the candle itself has that appearance of a shooting star that signals the end of an uptrend. So it could be things need to move sideways a bit here or even pull back once more before proceeding. With the overall economic situation continuing to approve, more upside seems in the future, but only the market can tell us when it will happen.
Stay healthy and trade safe!

Daily Market Update for 4/5Trend lines drawn from the 3/5 low (21d), 3/29 (5d) and today 4/5 (1d).
Ideas always welcome in the comments. Errors will be amended as comments on TradingView or corrected inline in my blog.
-=x=-=x=-=x=-=x=-=x=-=x=-=x=-
Monday, April 5, 2021
Facts: +1.67%, Volume lower, Closing range: 94% (w/Gap), Body: +80%
Good: Three positive days in a row, above 13,700 confirmed with a quick retest
Bad: Lowering volume
Highs/Lows: Higher high, higher low
Candle: Gap up, mostly green body with a slightly longer upper wick
Advance/Decline: About the same number of advancing as declining stocks.
Indexes: SPX (+1.44%), DJI (+1.13%), RUT (+0.49%), VIX (+3.35%)
Sectors: Consumer Discretionary (XLY +2.27%) and Communications (XLC +2.11%) were top. Energy (XLE -2.39%) was the only declining sector.
Expectation: Higher
-=x=-=x=-=x=-=x=-=x=-=x=-=x=-
Market Overview
The markets set new records on Monday led by gains from the largest public companies in Consumer Discretionary, Communications and Technology. The S&P 500 and Dow Jones Industrial marked new all-time highs with a bullish session that began the day with opening gap ups.
The Nasdaq closed the day with a +1.67% gain on lower volume. The closing range of 94% includes the morning gap-up that led to an 80% green body. A minor fade in the afternoon created a slightly longer upper wick than the lower wick but the higher high and higher low continue a strong uptrend from last week's pivot. There were about the same number of gaining stocks as declining stocks.
The S&P 500 (SPX) gained +1.44% for the day. The Dow Jones Industrial average (DJI) gained +1.13%. Small caps also had gains, but not quite as strong as the large and mega-caps. The Russell 2000 (RUT) gains +0.49%.
The VIX volatility index advanced +3.35%.
Consumer Discretionary (XLY +2.27%) , Communications (XLC +2.11%) and Technology (XLK +2.07%) are all worth mentioning as the top sectors. They were the three to outperform the SPX which means they were also responsible for much of the gains in the broader index. All three were led higher by at least one of the top ten mega-caps. Energy (XLE -2.39%) was the only losing sector of the day due to a drop in crude oil prices.
-=x=-=x=-=x=-=x=-=x=-=x=-=x=-
Economic Indicators
The US Dollar (DXY) declined -0.47% adding support to large multi-nationals.
The US 30y treasury bond and 10y note yields rose slightly for the day, but seem under control. 2y notes yields rose a bit more and narrowed the spread between short and long term.
High Yield Corporate Bond (HYG) prices rose while Investment Grade Corporate Bond (LQD) prices declined. Both are in an uptrend.
Silver (SILVER) and Gold (GOLD) both declined slightly but seem to have support. Crude Oil (CRUDEOIL1!) futures declined as OPEC decided to increase production but then the pandemic seems to be worsening in Europe. Timber (WOOD) advanced. Copper (COPPER1!) advanced while Aluminum (ALI1!) remained flat. The soaring commodity prices show recovering demand in the economy, but could also be sign of coming inflation.
-=x=-=x=-=x=-=x=-=x=-=x=-=x=-
Investor Sentiment
The put/call ratio dropped to 0.501. The put/call ratio (PCCE) is a contrarian indicator that shows overly bullish or overly bearish investor behavior. The 0.7 level is considered normal. As it approaches 0.60 (overly bullish) and below, watch for a possible pullback in the market.
The CNN Fear & Greed index is moved more toward the greed side.
-=x=-=x=-=x=-=x=-=x=-=x=-=x=-
Market Leaders
The biggest four mega-caps produced some eye-popping charts today. Microsoft (MSFT) and Alphabet (GOOGL) broke out into new all-time highs with +2.77% and +4.19% gains. Both are trading above their 21d EMA and 50d MA lines. Amazon (AMAZN) gained +2.08% and moved back above the 50d MA, and trades above both lines as well. Apple (AAPL) gained a respectable +2.36%, but still has some work to do to get above the 50d MA.
Tesla (TSLA) found its way to the top of the mega-cap list after announcing record production and deliveries for the last quarter. Intel (INTC), Oracle (ORCL), Facebook (FB) and Alphabet all have gains of over 3% helping their respective sectors lead for the day. At the bottom of the list is Chevron (CVX) and Exxon Mobile (XOM).
The growth stock list is a bit harder to decipher. Results are mixed and overall lean toward losses. Outside of Tesla and Facebook topping the list, Pinterest (PINS), Dr Horton (DHI) and Zynga (ZNGA) had leading gains for the day. However, a good number of growth stocks had more than 2% losses for the day with Enphase (ENPH), Etsy (ETSY) , Solar Edge (SEDG) and DataDog (DDOG) leading the declines with more than 4% losses.
As the market turns toward a new rally, expect investors to be figuring out who the new winners and losers will be in the economic recovery.
-=x=-=x=-=x=-=x=-=x=-=x=-=x=-
Looking ahead
On Tuesday, the CB Consumer Confidence numbers will be released just after market open. The API Weekly Crude Oil Stock will be updated after market close.
There are no notable earnings reports for Tuesday except maybe PAYX that could confirm a positive outlook for the labor market.
-=x=-=x=-=x=-=x=-=x=-=x=-=x=-
Trends, Support and Resistance
The index moved above the 13,600-13,700 support area and stayed above despite a quick retest.
If the one-day trend continues, we can expect a +1.64% gain for Tuesday. The five-day trend line points to a +0.57% gain.
The trend line from the 3/5 low points to a -2.62% loss, which is below the 50d MA and just above the 21d EMA. There are some gaps to fill in the last few session opens, so it would not be a big surprise to revisit these areas. However, there is support at the 13,700 line and the 50d MA which could help reverse any dips.
-=x=-=x=-=x=-=x=-=x=-=x=-=x=-
Wrap-up
Big tech showed up again last Wednesday afternoon but faded into close. It can back with a vengeance on Thursday and now is proving they are here to stay. Having Microsoft and Alphabet clear new all-time highs is a positive. There's no overhead supply for them to contend with for further gains.
On the other hand, there are plenty of other mega-caps and growth stocks alike that need to claw their way back to all-time highs. The overhead supply, investors holding since prior to the dips, will cause some resistance as the sell on the way back up.
The final characteristic from today is in deciphering investor sentiment for growth stocks. Some of the stocks that seemed poised to recover quickly pulled back again today despite the broader gains. Investors must be deciding which companies are the most likely to benefit from the recovering economy and new infrastructure proposals being debated in congress.
Stay healthy and trade safe!

Amazon (AMZN), DJI, IXIC, SPX, XAUUSD, USOIL - April 6Hello?
Dear traders, nice to meet you.
By "following" you can always get new information quickly.
Please also ask for the "Like" clock.
Have a nice day.
----------------------------------
You should watch for any movement that deviates from the box section 3008.91-3294.62.
If it goes down, we need to make sure we get support at 3176.40.
------------------------------
(DJI 1D chart)
The market closed at 1.13% as the gap (33153.2-33222.4) rose.
-----------------------------
(IXIC 1D chart)
It started with the gap (13480.1-13594.9) rising and closed at 1.67%.
----------------------------
(SPX 1D chart)
It started with an increase in the gap (4019.9-4034.4) and closed at 1.44%.
---------------------------
(XAUUSD 1D chart)
We need to see if we can get support at 1727.175 and move above the uptrend line.
--------------------------------------
(USOIL 1D chart)
You should watch for any movement that deviates from the 55.26-60.25 segment.
-------------------------------------------------- -------------------------------------------
** All indicators are lagging indicators.
So, it's important to be aware that the indicator moves accordingly with the movement of price and volume.
Just for the sake of convenience, we are talking upside down for interpretation of the indicators.
** The wRSI_SR indicator is an indicator created by adding settings and options from the existing Stochastic RSI indicator.
Therefore, the interpretation is the same as the conventional stochastic RSI indicator. (K, D line -> R, S line)
** The OBV indicator was re-created by applying a formula to the DepthHouse Trading indicator, an indicator that oh92 disclosed. (Thank you for this.)
** Check support, resistance, and abbreviation points.
** Support or resistance is based on the closing price of the 1D chart.
** All explanations are for reference only and do not guarantee profit or loss on investment.
Explanation of abbreviations displayed on the chart
R: A point or section of resistance that requires a response to preserve profits
S-L: Stop Loss point or section
S: A point or segment that can be bought for profit generation as a support point or segment
(Short-term Stop Loss can be said to be a point where profits and losses can be preserved or additionally entered through installment transactions. It is a short-term investment perspective.)
GAP refers to the difference in prices that occurred when the stock market, CME, and BAKKT exchanges were closed because they do not trade 24 hours a day.
G1: Closing price when closed
G2: Cigar at the time of opening
(Example) Gap (G1-G2)
NQ1! Chart Update (Log) - 04.02.21You ever feel like you're in the matrix?
Just a chart with some lines.

Market Week In Review - 3/29/2021 - 4/1/2021The Market Week in Review is my weekend homework where I look over what happened in the previous week and what might come in the next week. It helps me evaluate my observations, recognize new data points, and create a plan for possible scenarios in the future.
I do occasionally have some errors or typos and will correct them in my blog or in the comments on TradingView. I do not have an editor and do this in my free time.
If you find this helpful, please let me know in the comments. I am also more than happy to add new perspectives and data points if you have ideas.
The structure is the following:
A recap of the daily updates that I do here on TradingView.
The Meaning of Life, a view on the past week
What's coming in the next week
The Bullish View, The Bearish View
Key index levels to watch out for
Wrap-up
If you have been following my daily updates, you can skip down to the “The Meaning of Life”. If not, then this first part is a great play-by-play recap for the week. Click the daily charts for more detail on sectors, indexes and market leaders each day.
-=x=-=x=-=x=-=x=-=x=-=x=-=x=-
Monday, March 29, 2021
Facts: -0.6%, Volume lower, Closing range: 52%, Body: -25%
Good: Inside day on lower volume with a slightly longer lower wick
Bad: Lower high with two intraday dips
Highs/Lows: Lower high, higher low
Candle: Red body in the middle of candle with a longer lower wick
Advance/Decline: 5 declining stocks for every advancing stock
Indexes: SPX (-0.09%), DJI (+0.30%), RUT (-2.83%), VIX (+9.97%)
Sectors: Utilities (XLU +1.07%) and Communications (XLC +1.02%) were top. Financials (XLF -0.32%) and Energy (XLE -1.19%) were bottom.
Expectation: Sideways or Higher
It was a choppy day to start the week. The intraday movement has the look of a spiral that indicates indecision in the market. That's not unexpected considering that investors had a few things to be nervous about including the re-opening of the Suez Canal and the large forced fire-sale from Archegos continuing into this week. It's also no surprise seeing the impact to the Energy and Financials sectors.
The Nasdaq closed with a -0.6% loss on lower volume for the day. The inside day has a lower high and higher low. The closing range is 0.52% which is above the 0.40% that we want to see, and the longer lower wick indicates an upward trend intraday. So despite the red body and decline for the day, there are some positives to the candle. On the other hand, there were five declining stocks for every advancing stock on the Nasdaq.
-=x=-=x=-=x=-=x=-=x=-=x=-=x=-
Tuesday, March 30, 2021
Facts: -0.11%, Volume lower, Closing range: 80%, Body: +24%
Good: Closing range of 80%, recovered from morning dip below 13,000
Bad: Lower high, lower low, trending down
Highs/Lows: Lower high, lower low
Candle: Thin green body in the upper half of the candle, longer lower wick
Advance/Decline: A bit more than one advancing stock for every declining stock
Indexes: SPX (-0.32%), DJI (-0.31%), RUT (+1.72%), VIX (-5.45%)
Sectors: Consumer Discretionary (XLY +0.98%) and Financials (XLF +0.70%) were top. Technology (XLK -0.95%) and Consumer Staples (XLP -1.07%).
Expectation: Sideways or Higher
The bond market continued to show its influence on equities today, seemingly in a battle with strong consumer confidence numbers. A pre-market spike in long-term bond yields drove the Financials sector to a gap up at open. However, the yields began to taper off even before stronger than expected consumer confidence numbers were released after market open. The strong numbers sent the Consumer Discretionary sector to the top to finish the day.
The Nasdaq never quite recovered from the morning yield scare, but did end the day in the upper range of the candle. The index closed with a -0.11% loss for the day on lower volume. The closing range of 80% is good indicator for intraday bullishness, but the 24% body and lower high means the index still has much to prove. There were 1.2 advancing stocks for every declining stock.
-=x=-=x=-=x=-=x=-=x=-=x=-=x=-
Wednesday, March 31, 2021
Facts: +1.54%, Volume higher, Closing range: 62%, Body: +60%
Good: Higher high, lower low, back above the 21d EMA
Bad: Fade at the end of the day created long upper wick
Highs/Lows: Higher high, higher low
Candle: Thick green body with n lower wick, long upper wick
Advance/Decline: More advancing stocks than declining stocks
Indexes: SPX (+0.36%), DJI (-0.26%), RUT (+1.13%), VIX (-1.07%)
Sectors: Technology (XLK +1.59%) and Consumer Discretionary (XLY +0.78%) were top. Energy (XLE -0.69%) and Financials (XLF -0.76%) were bottom.
Expectation: Sideways or Higher
The breakout that wasn't. News from Microsoft drove a mid-afternoon buying frenzy that was visible in the Microsoft intraday chart and big enough to show up in both the Nasdaq and S&P 500 charts. However, the breakout quickly faded and took the indexes with it to close away from intraday highs. Still there were good gains in the market thanks to a bullish morning on positive economic outlook with Biden's announced infrastructure plans.
The Nasdaq closed with a +1.54% gain on higher volume, and gave us the gain with higher confidence we were waiting for. The closing range of 62% is above a 60% body with no lower wick. There is a long upper wick from the dip at the end of the day. There were 1.32 advancing stocks for every declining stock.
-=x=-=x=-=x=-=x=-=x=-=x=-=x=-
Thursday, April 1, 2021
Facts: +1.76%, Volume lower, Closing range: 96% (w/ Gap), Body: +79%
Good: Rally above and stayed above 50d MA
Bad: Flat after initial rally
Highs/Lows: Higher high, higher low
Candle: Gap up, Mostly green body with barely visible upper and lower wicks.
Advance/Decline: Two advancing stocks for every declining stock
Indexes: SPX (+1.18%), DJI (+0.52%), RUT (+1.50%), VIX (-10.67%)
Sectors: Energy (XLE +2.55%) and Technology (XLK +2.01%) were top. Health (XLV -0.30%) and Consumer Staples (XLP -0.48%) were bottom.
Expectation: Sideways or Higher
Hello April and Q2! The Nasdaq leapt into the new month and quarter with a gap up and rise above the 50d moving average while the S&P 5000 closed over 4000 for the first time in history. Solid breakouts from big tech and a breadth of gains across indexes and sectors helped put strength behind the moves.
The Nasdaq closed with a +1.76% gain on lower volume. The 96% closing range includes the gap and represents a quick rise in the morning that leveled off but never gave back the gains. The 79% body includes a few tests of the 50d MA in intraday trading, but support held. There were two advancing stocks for every declining stock.
-=x=-=x=-=x=-=x=-=x=-=x=-=x=-
The Meaning of Life (View on the Week)
This week marked the end of the first quarter of 2021, a quarter of volatility driven by the retail frenzy around meme stocks, a steepening yield curve caused by inflation fears and the landing of over a trillion dollars of support to the economy.
The last few days of the quarter also had its dramas. All eyes were on the ship stuck in the Suez Canal to open the week. Investors were also shocked by a $20b fire sale of positions from Archegos family fund at the end of the previous week and beginning of this week. That nervousness brought the index down on Monday and Tuesday to test the lower line of the channel from the March 2020 bottom.
On Wednesday, Biden released his plan to boost the economic recovery through a massive multi-trillion dollar infrastructure investment. That gave the whole market a kick start for the day. Buyers came in and got the index back above the kay moving average lines with a rally on Wednesday to pass the 21d EMA and gap-up on Thursday to pass the 50d MA. The gains Thursday were shared broadly across the market with the S&P 500 (SPX) hitting the milestone of closing above 4000 for the first time.
Microsoft made its market influence known this week. On Wednesday, it released news around 3pm that the US Army had agreed to a large purchase of a customized Hololens, an augmented reality device. The news not only sent the Microsoft price soaring, but because of its oversized market cap, the move was visible in both the Nasdaq and S&P 500. The huge move, that happened within 5 minutes, sold-off for the remaining hour and brought the indexes back down.
Even with the sell-off before close on Wednesday, the message was received that big tech was back and ready to continue growth even as investors were looking to value stocks. Thursday all of the tech mega-caps had gains. Both Microsoft and Alphabet had breakouts from bases. The Nasdaq appeared to be back in the game.
The Nasdaq advanced +2.60% for the week. The closing range is 99% as the index closed near its high on Friday.
Volume was lower, but it's important to note that Nasdaq and US market volume is on a decline from higher-than-average volume in 2020 and early 2021. Comparing volume to the broader US stock market volume, Nasdaq comparatively was higher than the previous week.
We've got a higher high and a higher low, after the index tested the lower line of the channel from the March 2020 bottom. The index has resistance around 13,600 and we'll watch that closely as the higher lows squeeze into an ascending triangle.
The S&P 500 has the focus this week since it closed above 4000 after advancing +1.15%. The Russell 2000 (RUT) is attempting to regain its advance with a +1.46% gain this week. The Dow Jones Industrial average (DJI) advanced +0.52%
The VIX volatility index closed at its lowest point since before the pandemic with a -8.11% decline.
Communications ( XLC ) did not top the sector list for a single day, but it's steady gains throughout the week put it at the top of the weekly chart.
Utilities ( XLU ) started the week on top. Investors were nervous on Monday about the lasting impact of the Suez Canal blockage and whether a $20b fire sale of Archegos investments would grow or even expand to other firms. Utilities popped back into the story late on Wednesday when a sudden pop and sell-off in big tech occurred in the final hour.
Financials ( XLF ) was also impacted by the Archegos drama on Monday. By Tuesday, the damage was contained and higher treasury bond yields provided a life to the sector, making it a top performer for the day.
Technology ( XLK ) got a boost on Wednesday when Microsoft announced news of an augmented reality deal with the US Army. That spike sold off quickly, but the buyers came back in on Thursday, bringing the Technology sector up to second place for the week.
Energy ( XLE ) spent most of the week at the bottom of the list. Higher-then-expected demand for oil and gas and a generally positive outlook for economic growth brought the sector gains on Thursday that lifted it from the bottom.
Consumer Staples ( XLP ) ended the week as the worst performing sector. The rotation out of staples could continue as investors see consumers return to normal spending habits in a strengthening economic cycle .
The 30y treasury bond yield dropped for a second week while the 10y note yield remained about the same. The US 2y note yield advanced, helping the yield curve flatten a bit for the week.
High Yield Corporate Bond (HYG) prices declined for the week while Investment Grade Bond (LQD) advanced. The Investment Grade bond prices have been increased for three weeks. The spread between high yield bonds and short term treasury bonds is continuing to tighten.
The US Dollar (DXY) remained about flat at a -0.02% decline. The pause in climbing certainly helps with big multinationals, especially big tech, which are impacted by currency fluctuations.
Silver (SILVER) declined and Gold (GOLD) advanced for the week.
Crude Oil Futures (CRUDEOIL1!) advanced despite fluctuating the past few weeks over the Suez Canal drama.
Timber (WOOD) advanced.
Copper (COPPER1!) and Aluminum (ALI1!) both declined for the week.
All the commodities showed bullish moves on Friday while the entire market rallied.
-=x=-=x=-=x=-=x=-=x=-=x=-=x=-
The Big Four Mega-caps
Alphabet (GOOGL) led the Communications sector with a +5.18% gain for the week, breaking out of a base forming since mid-February. Microsoft (MSFT) also made a breakout move with a +2.48% gain for the week. Watch these two closely next week even if they are not in your portfolio. Having these breakouts stick is an important indicator for the market.
Apple (APPL) and Amazon (AMZN) both had gains of +1.48% and +3.57% respectively. They still have some work to do. Apple needs to rise above the 10w moving average line. Amazon needs to stay above both lines to keep the 10w above the 40w and show an upward trend.
-=x=-=x=-=x=-=x=-=x=-=x=-=x=-
The Four Recovery Stocks
I picked four recovery stocks to track against the indexes and other indicators in this weekly report. All of them except Exxon Mobil (XOM) had gains for the week. That's positive that investors are no longer taking from either growth or value to invest in the other. Carnival Cruise Lines (CCL) had the biggest gain with a +3.07% advance. Delta Airlines (DAL) gained +2.45% and Marriott (MAR) gained +0.99%.
-=x=-=x=-=x=-=x=-=x=-=x=-=x=-
Investor Sentiment
The put/call ratio (PCCE) spent most of the past two weeks above 0.600 but ended this week at 0.538 as investors became more bullish. A contrarian indicator, when the put/call ratio is below 0.7, it signals overly bullish sentiment and could mean an overbought market.
The CNN Fear & Greed index has also been hovering around neutral but moved back toward greed at the end of the week.
The NAAIM exposure index moved down to 52.02. Money managers were reducing positions in the market as of Wednesday when the survey is taken.
-=x=-=x=-=x=-=x=-=x=-=x=-=x=-
The Week Ahead
Monday will kick-off the week with Purchasing Managers data for March that is a leading indicator for economic activity. That data will be complemented by Factor Orders data just after market open.
The EIA Short-Term Energy Outlook will be released Tuesday morning. After the market opens, the JOLT Job Openings report for February will be released. Crude Oil Stock data will be released after market close.
Wednesday kicks- off with Export, Imports and Trade Balance data. Crude Oil Inventories will be released after market open. In the afternoon, the FOMC meeting minutes from the meeting a few weeks ago will be released.
Thursday brings the weekly Job Claims in the morning. At noon, Fed Chair Jerome Powell is scheduled to speak.
On Friday, the producer price index data will be released that gives a view into inflation. Expect the US dollar and Treasury Yields to be impacted.
There are no relevant earnings reports for the daily update next week.
-=x=-=x=-=x=-=x=-=x=-=x=-=x=-
The Bullish Side
A lot of things look great about the market at the end of this week. Thursday ended the week with gains across all major indexes. Those gains held right into the closing bell despite the three day weekend which typically moves investors into a cautious mode.
The VIX volatility index dropped to its lowest level in over a year. It closed back within the range of 2019 and early 2020 before the pandemic.
Both the Energy and Technology sectors led on Friday. Growth stocks and value stocks ended the week with gains instead of rotating between the two. Yields moving up or down seemed to have less impact on tech mega-caps and growth stocks.
The mega-caps also ended the week with solid moves upward. Alphabet and Microsoft broke out of bases which will help carry the Nasdaq to further gains. Tesla reported strong quarterly production and delivery numbers over the weekend which should help it break out on Monday.
Volume was lower for the week, but weekly volume has been elevated from the beginning of the year. As rotations subside and volatility gets under control, we should expect trading volume to get lower as investors stop chasing from one sector to the next.
The US Dollar and Treasury Yields appear to be leveling off from recent increases. That should help bring back in cautious investors who feared the dollar would rise sharply and eat into valuations of large multinationals. With the yield curve starting to flatten, there will be less worries about soaring interest rates impacting growth stocks.
-=x=-=x=-=x=-=x=-=x=-=x=-=x=-
The Bearish Side
President Biden's infrastructure package was a bit surprising for some. The package did include traditional infrastructure spend on roads, airports and the power grid. But it also included a large portion focused on new energy, broadband internet and payments to unions that will be disrupted by some of the changes.
The result is that some of the expected investment for the Industrial and Materials sectors is not there. Those sectors barely budged after the infrastructure plans were released.
The proposal also comes with a looming tax raise for corporations that is expected to cut into profits as much as 7%. If those tax proposals pass through congress, you can certainly expect the market to reprice the impacted stocks.
Although recent economic data has shown inflation under control, there is more and more buzz on the street that prices are going up at the supermarket and at the pump. Some of the traditional leading indicators of inflation may be a little slow to show the sudden surge that's expected in consumer spending. Higher numbers for the producer price indexes could bring back those fears of inflation that were impacting the markets in March.
-=x=-=x=-=x=-=x=-=x=-=x=-=x=-
Key Nasdaq Levels to Watch
The Nasdaq stayed in a channel drawn from the March 2020 bottom and broke out of the symmetrical triangle we had drawn on the chart last week. Now as resistance is met at the 13,600 level, the higher lows should squeeze the index and eventually cause a breakout above that level. That's what we will watch for this week.
On the positive side, the level we still want to reach is still 13,620.71:
The index closed the week very close to its high of 13,487.08. Set a new high for next week to keep the uptrend going.
The next line is 13,620.71 which is the high from three weeks ago. But it is also past the area of resistance that the index was rejected on 1/26, 3/2, and 3/16.
14,000 will be the next area of resistance.
The all-time high is at 14,175.12. That might be a stretch to get there this week, but keep it in our sites.
On the downside, there are several levels to watch:
The 50d moving average is at 13,427.76.
The 21d exponential moving average is at 13,234.87. Both moving average lanes are key support lines.
The lower line of the channel from the March 2020 bottom is around 13,005 for next week.
13,000 has been an area of support on 1/29, 2/23, 3/3. The index moved below that support area again this week, but was able to rise back above it and rally.
The low of this past week is 12,922.57. Stay above that price to give us a higher low for this week.
-=x=-=x=-=x=-=x=-=x=-=x=-=x=-
Wrap-up
There were a lot of positive signs by the time this short week of trading closed. But the indexes and indicators here are only one input to the investors outlook.
Look at your portfolio or watch lists and see how stocks are acting. Are they breaking out of bases and are the break outs sticking? Or are breakouts failing with prices falling back into the base?
How your focus stocks perform will be the final indicator of whether to increase exposure.
Good luck, stay healthy and trade safe!

Daily Market Update for 4/01Trend lines drawn from the 3/5 low (20d), 3/26 (5d) and today 4/1 (1d).
Ideas always welcome in the comments. Errors will be amended as comments on TradingView or corrected inline in my blog.
-=x=-=x=-=x=-=x=-=x=-=x=-=x=-
Thursday, April 1, 2021
Facts: +1.76%, Volume lower, Closing range: 96% (w/ Gap), Body: +79%
Good: Rally above and stayed above 50d MA
Bad: Flat after initial rally
Highs/Lows: Higher high, higher low
Candle: Gap up, Mostly green body with barely visible upper and lower wicks.
Advance/Decline: Two advancing stocks for every declining stock
Indexes: SPX (+1.18%), DJI (+0.52%), RUT (+1.50%), VIX (-10.67%)
Sectors: Energy (XLE +2.55%) and Technology (XLK +2.01%) were top. Health (XLV -0.30%) and Consumer Staples (XLP -0.48%) were bottom.
Expectation: Sideways or Higher
-=x=-=x=-=x=-=x=-=x=-=x=-=x=-
Market Overview
Hello April and Q2! The Nasdaq leapt into the new month and quarter with a gap up and rise above the 50d moving average while the S&P 5000 closed over 4000 for the first time in history. Solid breakouts from big tech and a breadth of gains across indexes and sectors helped put strength behind the moves.
The Nasdaq closed with a +1.76% gain on lower volume. The 96% closing range includes the gap and represents a quick rise in the morning that leveled off but never gave back the gains. The 79% body includes a few tests of the 50d MA in intraday trading, but support held. There were two advancing stocks for every declining stock.
The S&P 500 (SPX) set a milestone, advancing +1.18%, to close above 4000 for the first time ever. The Russell 2000 (RUT) put in its third day of gains with a +1.50% advance. The Dow Joins Industrial (DJI) average climbed +0.52%.
The VIX volatility index declined -10.67% to close at its lowest point since before the pandemic.
Energy (XLE +2.55%) topped the sector list as crude oil prices spiked on better than expected inventory data for Crude and Gasoline, demonstrating high demand. Technology (XLK +2.01%) also topped the sector list, boosted by big tech gains from Microsoft and Apple and generally great performance across the entire sector. Health (XLV -0.30%) and Consumer Staples (XLP -0.48%) were at the bottom of the list. Utilities (XLU -0.09%) was also at the bottom of the list, not participating in the gains.
-=x=-=x=-=x=-=x=-=x=-=x=-=x=-
Economic Indicators
The US Dollar (DXY) declined -0.02% and has leveled off from recent gains, helping alleviate some risk for large multi-nationals.
The US 30y treasury bond and 10y note yields both dropped while the 2y note yield rose, helping bring back down the steep yield curve.
High Yield Corporate Bond (HYG) prices pulled back from recent gains while Investment Grade Corporate Bond (LQD) prices continued to advance.
Silver (SILVER) and Gold (GOLD) both continued to advance. Crude Oil (CRUDEOIL1!) advanced. Timber (WOOD) advanced. Copper (COPPER1!) and Aluminum (ALI1!) advanced. All of this shows a bullish outlook on the economy.
-=x=-=x=-=x=-=x=-=x=-=x=-=x=-
Investor Sentiment
The put/call ratio dropped to 0.538. The put/call ratio (PCCE) is a contrarian indicator that shows overly bullish or overly bearish investor behavior. The 0.7 level is considered normal. As it approaches 0.60 (overly bullish) and below, watch for a possible pullback in the market.
The CNN Fear & Greed index is moving back toward Greed, but not at an extreme level.
-=x=-=x=-=x=-=x=-=x=-=x=-=x=-
Market Leaders
All of biggest four mega-caps had gains for the day, gains that had a lot more strength than the previous day. Alphabet (GOOGL) had the largest gain of the four with a +3.26% advance and a record-setting close. Microsoft (MSFT) couldn't quite reach all-time highs but advanced +2.79% in a clear breakout from a base. Amazon (AMZN) had a +2.16% gain but stopped short of its 50d MA line. Apple (AAPL) advanced +0.70%, closing just above its 21d EMA but well below its 50d MA.
Semiconductors and Communication stocks topped the mega-cap list. Taiwan Semiconductor (TSM) Nvidia (NVDA), Netflix (NFLX) and Alphabet were the top four gainers. Most mega-caps advanced for the day. UnitedHealth (UNH), Toyota Motor ™ and Alibaba (BABA) were at the bottom of the list, all declining more than 1%.
Growth Stocks also had a good day. Topping the daily update list were MongoDB (MDB), Pinterest (PINS), DataDog (DDOG) and Fastly (FSLY). All four of these sold off heavily in February and March and are trying to regain ground. At the bottom of the list were Chewy (CHWY), Ehang Holdings (EH) and FUTU Holdings (FUTU).
-=x=-=x=-=x=-=x=-=x=-=x=-=x=-
Looking ahead
Markets are closed on Good Friday, but employment data will be released. At the time of this writing, the data is already released and showed great recovery in the labor market.
Monday will kick-off the week with Purchasing Managers data for March that is a leading indicator for economic activity. That data will be complemented by Factor Orders data just after market open.
There are no notable earnings reports for the daily update next week except maybe PAYX on Tuesday that could confirm a positive outlook for the labor market.
-=x=-=x=-=x=-=x=-=x=-=x=-=x=-
Trends, Support and Resistance
The index moved above the 50d moving average in the morning and stayed above the line.
The five-day trend line points to a +0.47% gain for Monday. The one-day trend line points sideways to a minor -0.05% decline and stays above the 50d MA line.
The trend line from the 3/5 low points to a -1.67% loss, which below the 50d MA and just above the 21d EMA.
-=x=-=x=-=x=-=x=-=x=-=x=-=x=-
Wrap-up
The expectation was higher for today. Thankfully the market didn't pull an April Fools.
Thursday was the kind of day we want to see as a new month and new quarter starts. Gains across all the indexes and most of the sectors. Volatility at its lowest in over a year. Energy and Technology leading the sector list. Solid moves from the large mega-caps. Commodity prices advanced on expected demand. The US Dollar is strengthening but not out of control. The yield curve is starting to show some control.
The only thing missing was volume. It was lower than the previous day. However, that may also be a positive sign as volume has been running high since the beginning of December and peaked in February. Maybe, just maybe, some of the frenzy of retail investing as subsided and volume is coming back down to normal levels. Maybe, just maybe, lower volume means continued lower volatility as well.
That looks good, but things can change quickly, so always trade with a stop loss. :)
Stay healthy and trade safe!

Amazon (AMZN), DJI, IXIC, SPX, XAUUSD, USOIL - April 1Hello?
Dear traders, nice to meet you.
By "following" you can always get new information quickly.
Please also ask for the "Like" clock.
Have a nice day.
----------------------------------
You should watch for any movement that deviates from the box section 3008.91-3294.62.
In particular, we have to see if we can get off the downtrend line.
If you go down from 2961.97, you can touch 2379.61, so you need a Stop Loss to preserve profit or loss.
The next volatility period is around April 28th.
------------------------------------
(DJI 1D chart)
It started with the gap (33067.0-33116.0) rising and closed at -0.26%.
------------------------------------
(IXIC 1D chart)
It started with the gap (13045.4-13122.6) rising and ended at 1.54%.
------------------------------------
(SPX 1D chart)
It started with the gap (3958.6-3967.3) rising and closed at 0.36%.
-------------------------------------
(XAUUSD 1D chart)
We have to see if we can get support at 1703.120 and climb above 1727.175.
If it falls, you can touch the 1659.369 point, so you need to trade carefully.
----------------------------------------
(USOIL 1D chart)
We have to see if we can ascend above the 60.25 point.
If it falls, you can touch the 55.26 point, so you need to trade carefully.
-------------------------------------------------- -------------------------------------------
** All indicators are lagging indicators.
So, you need to be aware that the indicator moves accordingly with the movement of price and volume.
Just for convenience, we are talking upside down for interpretation of the indicators.
** The wRSI_SR indicator is an indicator created by adding settings and options from the existing Stochastic RSI indicator.
Hence, the interpretation is the same as the traditional Stochastic RSI indicator. (K, D line -> R, S line)
** The OBV indicator was re-created by applying a formula to the DepthHouse Trading indicator, an indicator that oh92 disclosed. (Thank you for this.)
** Check support, resistance, and abbreviation points.
** Support or resistance is based on the closing price of the 1D chart.
** All explanations are for reference only and do not guarantee profit or loss on investment.
Explanation of abbreviations displayed on the chart
R: A point or section of resistance that requires a response to preserve profits
S-L: Stop Loss point or section
S: A point or segment that can be bought for profit generation as a support point or segment
(Short-term Stop Loss can be said to be a point where profits and losses can be preserved or additionally entered through installment transactions. It is a short-term investment perspective.
GAP refers to the difference in prices that occurred when the stock market, CME, and BAKKT exchanges were closed because they do not trade 24 hours a day.
G1: Closing price when closed
G2: Cigar at the time of opening
(Example) Gap (G1-G2)

Daily Market Update for 3/31Trend lines drawn from the 3/5 low (19d), 3/25 (5d) and today 3/31 (1d).
Ideas always welcome in the comments. Errors will be amended as comments on TradingView or corrected inline in my blog.
-=x=-=x=-=x=-=x=-=x=-=x=-=x=-
Wednesday, March 31, 2021
Facts: +1.54%, Volume higher, Closing range: 62%, Body: +60%
Good: Higher high, lower low, back above the 21d EMA
Bad: Fade at the end of the day created long upper wick
Highs/Lows: Higher high, higher low
Candle: Thick green body with n lower wick, long upper wick
Advance/Decline: More advancing stocks than declining stocks
Indexes: SPX (+0.36%), DJI (-0.26%), RUT (+1.13%), VIX (-1.07%)
Sectors: Technology (XLK +1.59%) and Consumer Discretionary (XLY +0.78%) were top. Energy (XLE -0.69%) and Financials (XLF -0.76%) were bottom.
Expectation: Sideways or Higher
-=x=-=x=-=x=-=x=-=x=-=x=-=x=-
Market Overview
The breakout that wasn't. News from Microsoft drove a mid-afternoon buying frenzy that was visible in the Microsoft intraday chart and big enough to show up in both the Nasdaq and S&P 500 charts. However, the breakout quickly faded and took the indexes with it to close away from intraday highs. Still there were good gains in the market thanks to a bullish morning on positive economic outlook with Biden's announced infrastructure plans.
The Nasdaq closed with a +1.54% gain on higher volume, and gave us the gain with higher confidence we were waiting for. The closing range of 62% is above a 60% body with no lower wick. There is a long upper wick from the dip at the end of the day. There were 1.32 advancing stocks for every declining stock.
The Russell 2000 (RUT) added to the previous day's gains with a +1.13% advance. The S&P 500 (SPX) also advanced, gaining +0.36%. The Dow Jones Industrial average (DJI) was weighed down by Financial and Energy stocks and declined -0.26%.
The VIX volatility index declined -1.07%.
Technology (XLK +1.59%) and Consumer Discretionary (XLY +0.78%) were top sectors for the day. Energy (XLE -0.69%) and Financials (XLF -0.76%) were at the bottom. Interestingly, Materials (XLB -0.49%) and Industrials (XLI -0.32%) declined for the day despite Biden's infrastructure plans. It could be a case of sell the news. Another note is that Utilities (XLU +0.74%) climbed in the last hour from fifth place to third place just behind Consumer Discretionary.
-=x=-=x=-=x=-=x=-=x=-=x=-=x=-
Economic Indicators
The US Dollar (DXY) climbed -0.07%.
The US 30y treasury bond and 10y and 2y notes yields all gained for the day with the yield curve steepening. The increase in yields was not a surprise given the news on infrastructure investments, so there was less of a negative reaction from the equities market.
High Yield Corporate Bonds (HYG) and Investment Grade Corporate Bond (LQD) prices both advanced.
Silver (SILVER) and Gold (GOLD) both reversed from two days of declines and advanced today. Crude Oil (CRUDEOIL1!) declined. Timber (WOOD) declined. Copper (COPPER1!) advanced and Aluminum (ALI1!) declined.
-=x=-=x=-=x=-=x=-=x=-=x=-=x=-
Investor Sentiment
The put/call ratio dropped to 0.639. The put/call ratio (PCCE) is a contrarian indicator that shows overly bullish or overly bearish investor behavior. The 0.7 level is considered normal. As it approaches 0.60 (overly bullish) and below, watch for a possible pullback in the market.
The CNN Fear & Greed index is moved back to Neutral. The stock market components of the index are still in the Fear and Extreme Fear categories. Those include price strength, price breadth and Put/Call ratio.
-=x=-=x=-=x=-=x=-=x=-=x=-=x=-
Market Leaders
All of biggest four mega-caps had gains for the day, but all closed well below intraday highs. Alphabet (GOOGL) and Microsoft (MSFT) closed above the 21d EMA and 50d MA lines. Amazon (AMZN) closed above the 21d EMA. Apple (AAPL) rallied above the 21d EMA but was unable to hold above the line. The higher volume is a positive, but the pull back from the breakout attempt shows some weakness.
Tesla (TSLA), Nvidia (NVDA), Taiwan Semiconductor (TSM) and ASML Holding (ASML) were the top mega-caps of the day. Energy and Financial stocks were at the bottom, including Bank of America (BAC), Exxon Mobil (XOM), and JP Morgan (JPM). Communications companies AT&T (T) and Comcast Corp (CMCSA) were also at the bottom of the list.
Growth stocks popped again today. Leading the list were Chinese fintech companies Up Fintech (TIGR) and FUTU Holdings (FUTU) with +20.94% and 15.20% gains. GrowGeneration (GRWG) and Moderna (MRNA) also had gains of over 10%. 18 of the growth stocks in the daily update list gained over 5%. It's not meant to be an exhaustive list, but the point remains, there were a lot of big gainers today in growth stocks.
-=x=-=x=-=x=-=x=-=x=-=x=-=x=-
Looking ahead
On Thursday, an OPEC meeting is scheduled which will impact outlook for oil supply/demand. Initial Jobless Claims data will be released. Additional Manufacturing data for March will indicate how the sector is recovering.
Also keep in mind to characteristics for tomorrow. It's the beginning of a new quarter and a historically positive month for markets. It's also the last day of trading this week heading into a three-day weekend.
CarMax (KMX) reports on Thursday.
-=x=-=x=-=x=-=x=-=x=-=x=-=x=-
Trends, Support and Resistance
The index moved above the 21d EMA in the morning and stayed above that line, despite the dip before close.
If the one-day trend line continues, we can expect a +1.02% gain for Thursday, and ending just under the 50d MA.
The five-day trend line points to a +0.42% gain.
The trend line from the 3/5 low points to a -0.36% loss, which is just below the 21d EMA.
-=x=-=x=-=x=-=x=-=x=-=x=-=x=-
Wrap-up
It was positive to see a good gain on higher volume today. The longer upper wick is reminiscent of the candle on 3/22 where I called an expectation of Higher for the next day. But the index dropped 3% over the next two days. So that gives me some caution in the expectation of Sideways or Higher for tomorrow.
There are some differences in the underlying characteristics of the 3/22 candle. The breadth in gains was not there for 3/22, with two declining stocks for every advancing stock. Today, we have more advancing stocks than declining stocks. The advances on 3/22 happened as treasury yields declined and investors seemed to be in and out of tech stocks based on the movement in yields. Today's rally in tech stocks happened despite higher yields.
The creation of the longer upper wick was the same, a sell-off into close after an intraday high. The catalyst this time has a few possibilities. Perhaps Yellen's announcement of more scrutiny on hedge funds stirred the market. But the impact of Microsoft's huge afternoon rally and then pullback can also be felt in the indexes. The timing of the rally and sell-off coincides with the rise in the Utilities sector, a sector that investors run to when their nervous.
So I'm bullish with caution for tomorrow. Let's look forward to a great first day of April. And market, don't make a fool out of me.
Stay healthy and trade safe!


Daily Market Update for 3/30Trend lines drawn from the 3/5 low (17d), 3/24 (5d) and today 3/30 (1d).
Ideas always welcome in the comments. Errors will be amended as comments on TradingView or corrected inline in my blog.
-=x=-=x=-=x=-=x=-=x=-=x=-=x=-
Tuesday, March 30, 2021
Facts: -0.11%, Volume lower, Closing range: 80%, Body: +24%
Good: Closing range of 80%, recovered from morning dip below 13,000
Bad: Lower high, lower low, trending down
Highs/Lows: Lower high, lower low
Candle: Thin green body in the upper half of the candle, longer lower wick
Advance/Decline: A bit more than one advancing stock for every declining stock
Indexes: SPX (-0.32%), DJI (-0.31%), RUT (+1.72%), VIX (-5.45%)
Sectors: Consumer Discretionary (XLY +0.98%) and Financials (XLF +0.70%) were top. Technology (XLK -0.95%) and Consumer Staples (XLP -1.07%).
Expectation: Sideways or Higher
-=x=-=x=-=x=-=x=-=x=-=x=-=x=-
Market Overview
The bond market continued to show its influence on equities today, seemingly in a battle with strong consumer confidence numbers. A pre-market spike in long-term bond yields drove the Financials sector to a gap up at open. However, the yields began to taper off even before stronger than expected consumer confidence numbers were released after market open. The strong numbers sent the Consumer Discretionary sector to the top to finish the day.
The Nasdaq never quite recovered from the morning yield scare, but did end the day in the upper range of the candle. The index closed with a -0.11% loss for the day on lower volume. The closing range of 80% is good indicator for intraday bullishness, but the 24% body and lower high means the index still has much to prove. There were 1.2 advancing stocks for every declining stock.
The Russell 2000 (RUT) finally had a day to shine with a +1.72% gain. The S&P 500 (SPX) and Dow Jones Industrial average (DJI) had nearly similar declines with -0.32% and -0.32% respectively.
The VIX volatility index declined -5.45%.
Consumer Discretionary (XLY +0.98%) topped the sector list, despite starting the day in the negative. The Consumer Confidence numbers were way better than expected and is a leading indicator of consumer spending. Whereas spending on staples typically remains steady during economic downturns, discretionary spending dips and then picks up once the outlook becomes better. Financials (XLF +0.70%) was the second best sector of the day, helped by the morning spike in long term treasury yields that drive interest rates, and revenues for banks. The strength in Industrials (XLI +0.44%) should also be noted as the infrastructure plans from Biden are expected to boost the sector.
All other sectors declined for the day (XLC was even). Technology (XLK -0.95%) and Consumer Staples (-1.07%) were the bottom two sectors.
-=x=-=x=-=x=-=x=-=x=-=x=-=x=-
Economic Indicators
The US Dollar (DXY) climbed +0.38%, likely impacting big tech valuations.
The US 30y treasury bond and 10y note declined for the day, after a pre-market spike that sent investors scrambling. The 2y note was flat for the day.
High Yield Corporate Bonds (HYG) prices declined while Investment Grade Corporate Bond (LQD) prices advanced.
Silver (SILVER) and Gold (GOLD) declined for a second day. Crude Oil (CRUDEOIL1!) declined. Timber (WOOD) advanced. Copper (COPPER1!) and Aluminum (ALI1!) declined.
-=x=-=x=-=x=-=x=-=x=-=x=-=x=-
Investor Sentiment
The put/call ratio dropped to 0.616. The put/call ratio (PCCE) is a contrarian indicator that shows overly bullish or overly bearish investor behavior. The 0.7 level is considered normal. As it approaches 0.60 (overly bullish) and below, watch for a possible pullback in the market.
The CNN Fear & Greed index is moved back toward Neutral, but still on the Fear side.
-=x=-=x=-=x=-=x=-=x=-=x=-=x=-
Market Leaders
Alphabet (GOOGL) was the only big four mega-cap to escape losses, but it only had a +0.03% gain. Microsoft (MSFT) had a -1.44% loss as it's 21d EMA moves under the 50d MA, signaling a bearish outlook for the chart. Apple (AAPL) and Amazon (AMZN) had losses of -1.23% and -0.66% and both continue to trade underneath both key moving average lines. Alphabet is the only of the big four that has the 21d EMA above the 50d MA.
Baidu (BIDU), Tesla (TSLA), Bank of America (BAC) and JP Morgan (JPM) were the top four mega-caps and only mega-caps to gain more than 1% for the day. Abbot Laboratories (ABT) and Proctor & Gamble (PG) were at the bottom of the list.
Growth stocks generally had a good day. Ehang Holdings (EH), Lemonade (LMND), GrowGeneration (GRWG) and RH (RH) topped the daily update list with greater than 6% gains.
-=x=-=x=-=x=-=x=-=x=-=x=-=x=-
Looking ahead
There will be a few key updates on Wednesday morning. Employment data for March will be updated. Purchasing Managers Index data will indicate how much purchasing activity is happening in order to meet manufacturing demands. Pending Home Sales and Crude Oil Inventories will be released after market open.
President Biden is expected to reveal the details of his infrastructure plan which is expected to be $3 trillion. That could be great for economic recovery, but will have mixed impacts on the market. We could see yields spike again as inflation fears creep back into investors' minds. On the other hand, we are also likely to see some sectors such as Materials and Industrials benefit.
Walgreens (WBA) and Riot Blockchain (RIOT) report on Wednesday.
-=x=-=x=-=x=-=x=-=x=-=x=-=x=-
Trends, Support and Resistance
The index dipped below 13,000 support again, but was able to regain the line.
The trend line from the 3/5 low points to a +1.06% gain for Wednesday, which is back above the 21d EMA.
The one-day trend line does point upward and would result in a +0.60% gain.
The five-day trend line points to a -0.46% loss.
-=x=-=x=-=x=-=x=-=x=-=x=-=x=-
Wrap-up
The Nasdaq continues to creep along without any high volume big moves in either direction the last few days. The index did touch the lower line of a channel drawn from the March 2020 bottom. I noted that level in the weekly update. It was tested, but closed inside the channel.
Tomorrow is the last day of the month and last day of the quarter. Let's hope for positive end for the month to spring the market into April.
Stay healthy and trade safe!

RSI looking weak but daily super trend is greenIXIC RSI is looing a bit week but could be approaching over sold here as the Supertrend issued a buy signal on the daily Monday. This would put my initial target at about 13700 in the coming weeks.

Amazon (AMZN), DJI, IXIC, SPX, XAUUSD, USOIL - March 30Hello?
Dear traders, nice to meet you.
By "following" you can always get new information quickly.
Please also ask for the "Like" clock.
Have a nice day.
----------------------------------
You should watch for any movement that deviates from 3008.91-3148.73.
In particular, we have to watch for movements that deviate from the downtrend line.
If you fall in the 2961.97-3008.91 section, you can touch the 2379.61 point, so you need to trade carefully.
Therefore, Stop Loss is required to preserve profit and loss.
It remains to be seen if volatility around March 29 could break above the downtrend line.
---------------------------------
(DJI 1D chart)
It started with the gap (33072.9-33087.6) rising and ended at 0.30%.
-----------------------------------
(IXIC 1D chart)
It started with a drop in the gap (13138.7-13104.0) and closed at -0.60%.
------------------------------------
(SPX 1D chart)
It started with the gap (3974.5-3696.3) falling and closed at -0.09%.
-------------------------------------
(XAUUSD 1D chart)
You should watch for any movement that deviates from 1703.120-1727.175.
The fall from 1703.120 point, 1659.369 point can be touched, so careful trading is necessary.
------------------------------------
(USOIL 1D chart)
You should watch for any movement that deviates from 60.25-66.26.
It remains to be seen if it can move below the 55.26 point and turn into a downtrend.
-------------------------------------------------- -------------------------------------------
** All indicators are lagging indicators.
So, it's important to be aware that the indicator moves accordingly with the movement of price and volume.
Just for the sake of convenience, we are talking upside down for interpretation of the indicators.
** The wRSI_SR indicator is an indicator created by adding settings and options from the existing Stochastic RSI indicator.
Therefore, the interpretation is the same as the conventional stochastic RSI indicator. (K, D line -> R, S line)
** The OBV indicator was re-created by applying a formula to the DepthHouse Trading indicator, an indicator that oh92 disclosed. (Thank you for this.)
** Check support, resistance, and abbreviation points.
** Support or resistance is based on the closing price of the 1D chart.
** All explanations are for reference only and do not guarantee profit or loss on investment.
Explanation of abbreviations displayed on the chart
R: A point or section of resistance that requires a response to preserve profits
S-L: Stop Loss point or section
S: A point or segment that can be bought for profit generation as a support point or segment
(Short-term Stop Loss can be said to be a point where profits and losses can be preserved or additionally entered through installment transactions. It is a short-term investment perspective.
GAP refers to the difference in prices that occurred when the stock market, CME, and BAKKT exchanges were closed because they do not trade 24 hours a day.
G1: Closing price when closed
G2: Cigar at the time of opening
(Example) Gap (G1-G2)

Daily Market Update for 3/29Trend lines drawn from the 3/5 low (17d), 3/23 (5d) and today 3/29 (1d).
Ideas always welcome in the comments. Errors will be amended as comments on TradingView or corrected inline in my blog.
-=x=-=x=-=x=-=x=-=x=-=x=-=x=-
Monday, March 29, 2021
Facts: -0.6%, Volume lower, Closing range: 52%, Body: -25%
Good: Inside day on lower volume with a slightly longer lower wick
Bad: Lower high with two intraday dips
Highs/Lows: Lower high, higher low
Candle: Red body in the middle of candle with a longer lower wick
Advance/Decline: 5 declining stocks for every advancing stock
Indexes: SPX (-0.09%), DJI (+0.30%), RUT (-2.83%), VIX (+9.97%)
Sectors: Utilities (XLU +1.07%) and Communications (XLC +1.02%) were top. Financials (XLF -0.32%) and Energy (XLE -1.19%) were bottom.
Expectation: Sideways or Higher
-=x=-=x=-=x=-=x=-=x=-=x=-=x=-
Market Overview
It was a choppy day to start the week. The intraday movement has the look of a spiral that indicates indecision in the market. That's not unexpected considering that investors had a few things to be nervous about including the re-opening of the Suez Canal and the large forced fire-sale from Archegos continuing into this week. It's also no surprise seeing the impact to the Energy and Financials sectors.
The Nasdaq closed with a -0.6% loss on lower volume for the day. The inside day has a lower high and higher low. The closing range is 0.52% which is above the 0.40% that we want to see, and the longer lower wick indicates an upward trend intraday. So despite the red body and decline for the day, there are some positives to the candle. On the other hand, there were five declining stocks for every advancing stock on the Nasdaq.
The Dow Jones Industrial average (DJI) rose +0.30% to end the day with a record setting close. The S&P 500 (SPX) lost -0.09% after closing at a record high last week. The Russell 2000 (RUT) took another beating with a -2.83% loss for the day.
The VIX volatility index rose +9.97%.
Utilities (XLU +1.07%) was the top sector as investors remained defensive throughout the day. Communications (XLC +1.02%) was the second best sector, likely a rebound from last weeks losses. Financials (XLF -0.32%) and Energy (XLE -1.19%) were at the bottom. Big banks are expected to get hit with losses as well as possible regulatory scrutiny on the Archegos situation. The Suez Canal crisis ending is good for shipping but eliminates the potential for crude oil price hikes that would have benefited Energy.
-=x=-=x=-=x=-=x=-=x=-=x=-=x=-
Economic Indicators
The US Dollar (DXY) advanced +0.19% as it continues to strengthen.
The US Treasury yield curve steepened again. US 30y treasury bond and 10y note yields rose for the day while 2y note yields declined.
High Yield Corporate Bonds (HYG) prices rose while Investment Grade Corporate Bond (LQD) prices declined.
Silver (SILVER) and Gold (GOLD) declined. Crude Oil (CRUDEOIL1!) advanced. Timber (WOOD) declined. Copper (COPPER1!) and Aluminum (ALI1!) declined.
-=x=-=x=-=x=-=x=-=x=-=x=-=x=-
Investor Sentiment
The put/call ratio dropped slightly to 0.711. The put/call ratio (PCCE) is a contrarian indicator that shows overly bullish or overly bearish investor behavior. The 0.7 level is considered normal. As it approaches 0.60 (overly bullish) and below, watch for a possible pullback in the market.
The CNN Fear & Greed index is moved back to fear.
-=x=-=x=-=x=-=x=-=x=-=x=-=x=-
Market Leaders
Microsoft (MSFT) was the only big four mega-cap to decline for the day, but remains above the important 21d EMA and 50d MA lines. Alphabet (GOOGL) advanced +1.04% and closed back above both lines after trading below the 21d EMA all of last week. It's also important to note the intraday dip and support at the 50d MA for Alphabet. Amazon (AMZN) and Apple (AAPL) advanced, but met resistance at their 21d EMA lines.
Facebook (FB), Proctor & Gamble (PG), Coca-Cola (KO) and Oracle (ORCL) were the top four mega-caps for the day. About 50% of mega-caps ended the day with gains. Tesla (TSLA), JP Morgan (JPM), Taiwan Semiconductor (TSM) and PayPal (PYPL) were at the bottom of the list with more than -1% declines.
Among Growth stocks, FUTU Holdings (FUTU) had a big day with a +14.67% gain. Twitter (TWTR) joined Facebook (FB) with about the same gain of +2.7%. Most of the growth stocks in the daily update list declined for the day. Gaming stocks Penn National Gaming (PENN) and DraftKings (DKNG) were at the bottom of the list with -7.85% and --8.49% losses.
-=x=-=x=-=x=-=x=-=x=-=x=-=x=-
Looking ahead
On Tuesday, the CB Consumer Confidence numbers will be released just after market open. The API Weekly Crude Oil Stock will be updated after market close.
Lululemon (LULU), Chewy (CHWY), Carnival Corp (CCL), and HyreCar (HYRE) will report earnings on Tuesday.
-=x=-=x=-=x=-=x=-=x=-=x=-=x=-
Trends, Support and Resistance
The index dipped below 13,000 support briefly, but was able to regain the line.
The trend line from the 3/5 low points to a +1.3% gain for Monday, which is back above the 21d EMA.
The one-day trend line does point upward and would result in a +0.30% gain.
The five-day trend line points to a -1.67% loss.
-=x=-=x=-=x=-=x=-=x=-=x=-=x=-
Wrap-up
While the opening of the Suez Canal is a relief, the ongoing impact on big banks of the forced Archegos fire sale has investors nervous. In addition, we have the end of a quarter, a continued rotation from growth to value, and overall an environment of mixed economic data. If you are waiting for the Nasdaq to breakout of its funk, it perhaps could happen in the next few days, but more likely will happen in April.
The expectation based on the candle is for sideways to higher tomorrow. Some positive news could give investors the boost they need to jump back into growth stocks. Otherwise, it will take some slow but sure gains over days to build the confidence.
Stay healthy and trade safe!

Market Week In Review - 3/22/2021 - 3/26/2021The Market Week in Review is my weekend homework where I look over what happened in the previous week and what might come in the next week. It helps me evaluate my observations, recognize new data points, and create a plan for possible scenarios in the future.
I do occasionally have some errors or typos and will correct them in my blog or in the comments on TradingView. I do not have an editor and do this in my free time.
If you find this helpful, please let me know in the comments. I am also more than happy to add new perspectives and data points if you have ideas.
The structure is the following:
A recap of the daily updates that I do here on TradingView.
The Meaning of Life, a view on the past week
What's coming in the next week
The Bullish View, The Bearish View
Key index levels to watch out for
Wrap-up
If you have been following my daily updates, you can skip down to the “The Meaning of Life”. If not, then this first part is a great play-by-play recap for the week. Click the daily charts for more detail on sectors, indexes and market leaders each day.
-=x=-=x=-=x=-=x=-=x=-=x=-=x=-
Monday, March 22, 2021
Facts: +1.23%, Volume lower, Closing range: 60% (w/gap), Body: 56%
Good: Zero lower wick, strong morning rally to above the 50d MA
Bad: Could not stay above 50d MA, losing support late in the session
Highs/Lows: Higher high, higher low
Candle: No lower wick, green body under a long upper wick.
Advance/Decline: Two declining stocks for every advancing stock
Indexes: SPX (+0.70%), DJI (+0.32%), RUT (-0.91%), VIX (-9.88%)
Sectors: Technology (XLK +1.75%) and Communication Services (XLC +0.66%) were top sectors. Financials (XLF -1.72%) and Energy (XLE -2.00%) were bottom
Expectation: Sideways or Higher
Technology stocks showed up big for the first day of the week. The sector outperformed for the day, carrying most of the major indexes to close with positive gains for the day. The advances were not broadly shared, with two declining stocks for every advancing stock.
The Nasdaq closed with a +1.23% gain on significantly lower volume. The candle has no lower wick as the opening price level was never revisited after the morning rally. The 56% body sits under a long upper wick that formed during a sell-off just before close. The closing range of 60% includes a gap up at open and is positive, but does represent the weakness at close.
-=x=-=x=-=x=-=x=-=x=-=x=-=x=-
Tuesday, March 23, 2021
Facts: +1.12%, Volume higher, Closing range: 12%, Body: -76%
Good: Nothing
Bad: Back below the 21d EMA with a thick red candle
Highs/Lows: Lower high, lower low
Candle: Mostly red body with tiny upper and lower wicks
Advance/Decline: Ten declining stocks for every advancing stock
Indexes: SPX (-0.76%), DJI (-0.94%), RUT (-3.58%), VIX (+7.54%)
Sectors: Utilities (XLU +1.52%) and Consumer Staples (+0.41%) were top. Industrials (XLI -1.75%) and Materials (XLB -2.08%) were bottom.
Expectation: Lower
The character of the market continues to swing in opposite directions. Expectation was for Sideways or Higher for today, and we got lower. If we were keeping score, you'd notice the expectations I'm setting on a daily basis are broken very consistently over the past few weeks. But it's a good time to remind the reader that the expectations are not predictions, but they are to set and expectation, get our attention when the expectation is broken, and learn what might have changed in the market. Here we go.
The Nasdaq closed with a -1.12% decline on higher volume. The candle has small upper and lower wicks, but is mostly red body. The closing range of 12% shows the day very much went to the bears. Few bulls came in to buy back the low prices. The selling was broad, across most sectors, segments and impacted all major indexes. There were 10 declining stocks for every advancing stock.
-=x=-=x=-=x=-=x=-=x=-=x=-=x=-
Wednesday, March 24, 2021
Facts: -2.01%, Volume higher, Closing range: 0%, Body: 99%
Good: Nothing, even more nothing than yesterday
Bad: No wicks, all red body, close below 13,000 support
Highs/Lows: Lower high, lower low
Candle: Marubozu Black candle, no visible upper or lower wick, all red body
Advance/Decline: Five declining stocks for every advancing stock
Indexes: SPX (-0.55%), DJI (-0.01%), RUT (-2.35%), VIX (+4.43%)
Sectors: Energy (XLE +2.51%) and Industrials (XLI +0.73%) were top. Consumer Discretionary (XLY -1.48%) and Communications (XLC -2.52%) were bottom.
Expectation: Lower
In the endless rotations, the four cyclical sectors moved from the bottom to the top of the sector list in another session of selling for big tech, consumer discretionary and growth stocks.
The Nasdaq closed down -2.01% on higher volume. The 0% closing range comes after an all-day bearish move that formed a 99% red body candle. The tiny upper wick is barely visible and there is no lower wick. There were five declining stocks for every advancing stock.
-=x=-=x=-=x=-=x=-=x=-=x=-=x=-
Thursday, March 25, 2021
Facts: +0.19%, Volume lower, Closing range: 85%, Body: +60%
Good: Closed near to intraday highs
Bad: Lower low hit in the morning, resistance at 13,000 near close
Highs/Lows: Lower high, lower low
Candle: Mostly green body with a slightly longer lower wick from morning dip
Advance/Decline: Three advancing stocks for every two declining stocks
Indexes: SPX (+0.52%), DJI (+0.62%), RUT (+2.29%), VIX (-6.56%)
Sectors: Financials (XLF +1.68%) and Industrials (XLI +1.60%) were top. Technology (XLK -0.06%) and Communications (XLC -0.49%) were bottom.
Expectation: Lower
Economic news seemed to weigh on the market after open, but investors shook off the weight later in the day to find gains across the major indexes. A short pullback to absorb the reaction from a weak 7y note auction was overcome to close near market intraday highs.
The Nasdaq closed with a +0.19% gain. The candle gave us a lower high and lower low, but overall is bullish look despite a morning dip and afternoon pullback. The closing range is 85% and a thick green body covering 60% of the candle. The lower volume, and lower high mean the trend is still downward.
-=x=-=x=-=x=-=x=-=x=-=x=-=x=-
Friday, March 26, 2021
Facts: +1.24%, Volume higher, Closing range: 96%, Body: +53%
Good: Rally in afternoon to close near intraday high
Bad: Nothing
Highs/Lows: Higher high, higher low
Candle: Thick green body with a long lower wick, very small upper wick
Advance/Decline: More than one advancing stock for every declining stock
Indexes: SPX (+1.66%), DJI (+1.39%), RUT (+1.76%), VIX (-4.80%)
Sectors: Technology (XLK +2.54%) and Materials (XLB +2.48%) were top. Utilities (XLU +0.33%) and Communications (XLC -1.09%) were bottom.
Expectation: Higher
A late afternoon rally in the market closed the week with a positive day for all the major indexes. It's not clear what caused the sudden late afternoon rally. It could just be expiring options activity, or it could be investors outlook of the economy improving. Morning economic data was mixed, but the personal income numbers and consumer sentiment showed the possibility of an upcoming rise in spending. Data from UK and Germany was also positive on their economies.
The Nasdaq closed the day with a +1.24% gain on higher volume. The closing range of 96% with a 53% green body over a long lower wick was enough to get a higher high on top of a higher low. The higher high and higher low with more volume than the previous day is a great indicator of strength. There were more advancing stocks than declining stocks.
-=x=-=x=-=x=-=x=-=x=-=x=-=x=-
The Meaning of Life (View on the Week)
The week started with supply chain issues as a semiconductor plant in Japan was on fire. The week also ended with supply chain issues as a container ship remained stuck in the Suez Canal, blocking a major shipping route. The blockage caused oil prices to spike and more pressure on an already stressed supply chain.
Technology opened the week with huge gains from major leaders. But the gains were limited to big tech and all were on lower volume with no real breakouts. In the broader Nasdaq, there were two losers for every winner. On the surface, the chart looked ok, but the longer upper wick should have been another warning sign.
The bears were back on Tuesday and the selling was broad. New lockdowns across Europe and data issues with vaccine trials complicated the pandemic recovery and investors reacted. Utilities and Consumer Staples were at the top of the sector list while the cyclical sectors moved to the bottom. Pandemic stocks got a new life with Netflix, Peloton and Zoom topping the charts again. Global investors fled the US dollar and US treasuries as a safe haven, but equities suffered with 10 declining stocks for every advancing stock on the Nasdaq.
Wednesday brought another rotation. Cyclical sectors moved from the bottom of the sector list to the top of the sector list. Energy started to climb while a container ship blocking the Suez Canal, threatening oil and supply chain shortages. The US Dollar continued to rise. There were still five declining stocks for every advancing stock.
The Nasdaq crossed below a key level of 12,985.05 and looked very bearish with a Marubozu Black candle (no upper or lower wick, just red body). For Thursday, the index needed to hold above 12,783.40 which was the bottom line of the channel from the March 2020 bottom.
The index did hold, but not before testing that channel line. The Thursday candle is bullish. However, the lower high and lower low meant the downtrend continues. On the positive side, there were more advancing stocks than declining stocks. The US dollar gained again and the impact of a stronger dollar started to show up in the mega-caps list. Companies at the top of the gains list were ones that could benefit from a stronger dollar. Companies at the bottom of the list would have some negative impact by a strong dollar.
Friday opened with a mix of economic news and the continued stress of the Suez Canal blockage. The rally in the final hour saved the day to close the index higher. The reason for the rally was unclear, but may have been from positive economic news in Europe or it could have been market maker activity to cover for expiring options. The volume was higher, but still not as high as average volume since the beginning of the year. To put more confidence in a rally, I'd like to see consistent buying throughout the day with higher than average volume.
The Nasdaq declined -0.58% for the week on lower volume. The closing range of 53% is better than the previous week, but we have a lower high and a lower low.
The Nasdaq gave us a lower high and a lower low this week. A symmetrical triangle is forming which is usually followed by a move in the direction of the previous trend.
I focus on the Nasdaq because it holds many of the growth stocks that I tend to have in my portfolio. But I always keep an eye on the other major indexes in this report. The S&P 500 (SPX) had an all-time high close for the week and advanced +1.57%. The Dow Jones Industrial average (DJI) closed with a +1.36% gain.
Small caps and the Russell 2000 (RUT) struggled for a second week. It dipped more than 8% at one point but climbed back to close with a 62% closing range and end the week with a -2.89% loss.
The VIX volatility index closed the week at its lowest since March of 2020, declining -9.98% for the week.
There were several changes of winners and losers during a week that ended with the S&P 500 at a record close.
Technology ( XLK ) led for the first two days of the week. It held the lead on Tuesday, but was sold off heavily on Wednesday and Thursday, but then ended the week with a huge gain on Friday, putting it in third place.
Utilities ( XLU ) topped the list on Tuesday as investors became defensive. Utilities didn't take the top weekly spot on until Thursday when investors became more cautious again.
Consumer Staples ( XLP ) remained steady throughout the volatile week and ended the week at the top.
After last week's rout, Energy ( XLE ) seemed to find a bottom on Tuesday. After a big gain on Wednesday, the sector opened back near the bottom on Thursday, but quickly recovered . By the end of Friday, it was able to end the week with a gain.
Communication Services ( XLC ) and Consumer Discretionary ( XLY ) were the only two sectors to decline for the week. Communication Services ended the week at the bottom with more than a 4% decline. Although Technology sector fared well, there is still evidence of rotation from growth to value.
Longer term treasury yields pulled back from recent gains. The US 30y bond and US 10y note yields both dropped relative to the 2y note. There was a brief scare with a disappointing 7y note auction on Thursday, but bonds did not sell off heavily like after the previous lackluster auctions.
The yield curve still remains steep but has stopped steepening for the past few weeks.
High Yields Corporate Bonds (HYG) and Investment Grade (LQD) corporate bond prices both advanced for the week. The spread between corporate bonds and short term treasury bonds tightened.
The US Dollar (DXY) advanced +0.89% and is now having some impact on multinationals valuations.
Silver (SILVER) and Gold (GOLD) both declined for the week.
Crude Oil Futures (CRUDEOIL1!) remained about even for the week, despite a choppy up and down week.
Timber (WOOD) advanced. Copper (COPPER1!) declined while Aluminum (ALI1!) advanced. The continuing growth in aluminum prices is a signal of the high demand created by the recovering economy and manufacturing companies trying to keep up with expected demand.
-=x=-=x=-=x=-=x=-=x=-=x=-=x=-
The Big Four Mega-caps
Apple (AAPL) and Microsoft (MSFT) were able to end the week with gains while Amazon (AMZN) and Alphabet (GOOGL) declined for the week. Microsoft and Alphabet closed above their 10w moving average lines. Apple is below the 10w but above the 40w moving average. Amazon remains below both moving average lines. Relative to the Nasdaq, Microsoft and Alphabet have been outperforming while Apple and Amazon have been underperforming.
-=x=-=x=-=x=-=x=-=x=-=x=-=x=-
The Four Recovery Stocks
I picked four recovery stocks to track against the indexes and other indicators in this weekly report. Exxon Mobil was the only one to end the week with gains as oil prices are expected to rise with the continued blockage of the Suez Canal. The others sold off sharply early in the week as the pandemic seemed to pop back into investors' worries. They all recovered later in the week, but not enough to end the week with gains. All of the four recovery stocks are trading above both key moving average lines.
-=x=-=x=-=x=-=x=-=x=-=x=-=x=-
Investor Sentiment
The put/call ratio (PCCE) ended the week at 0.753. A contrarian indicator, when the put/call ratio is below 0.7, it signals overly bullish sentiment and could mean an overbought market.
The CNN Fear & Greed index is near to the neutral territory.
The NAAIM exposure index moved down to 57.52. Money managers were reducing positions in the market as of Wednesday when the survey is taken.
-=x=-=x=-=x=-=x=-=x=-=x=-=x=-
The Week Ahead
Next week will only have four days of trading. Markets will be closed for Good Friday.
A few short term bill auctions are scheduled for Monday. Otherwise there is not much economic news for the start of the week. Investors will be watching for an update to the situation with the Suez Canal.
On Tuesday, the CB Consumer Confidence numbers will be released just after market open. The API Weekly Crude Oil Stock will be updated after market close.
There will be a few key updates on Wednesday morning. First employment data for March will be updated. Purchasing Managers Index data will indicate how much purchasing activity is happening in order to meet manufacturing demands. Pending Home Sales and Crude Oil Inventories will be released after market open.
On Thursday, an OPEC meeting is scheduled which will impact outlook for oil supply/demand. Initial Jobless Claims data will be released. Additional Manufacturing data for March will indicate how the sector is recovering.
The markets will be closed on Good Friday, but there will still be some economic data released. Hourly Earnings, Nonfarm Payrolls and the Unemployment Rate will all show how strong the labor market is recovering.
There are no daily update earnings reports for Monday.
Lululemon (LULU), Chewy (CHWY), Carnival Corp (CCL), and HyreCar (HYRE) will report earnings on Tuesday.
Walgreens (WBA) and Riot Blockchain (RIOT) report on Wednesday.
CarMax (KMX) reports on Thursday.
No earnings reports for Good Friday.
Be sure to check your portfolio for upcoming earnings reports.
-=x=-=x=-=x=-=x=-=x=-=x=-=x=-
The Bullish Side
Looking broadly across the market, the S&P 500 closed at an all-time high. The Dow Jones Industrial average is near all-time highs. Despite the performance for the Nasdaq, broadly the markets are performing well. Investors continue to rotate into value stocks, away from growth stocks, but that was a necessary rebalancing. Soon the rebalance will be over and stocks can broadly advance together.
Global investors are seeing safety and value in the US Dollar again, which helps to strengthen the bond market as well. That should keep yields and the yield curve under control at least for a while. The Fed will continue to buy up bonds to control the yield curve while not worrying up inflation.
Rising consumer sentiment means record savings and new stimulus checks could be poured into the economy soon.
-=x=-=x=-=x=-=x=-=x=-=x=-=x=-
The Bearish Side
The supply chain is strained from two big events this week and the higher spending expected in coming months could put more upward pressure on prices. Inflation could scare investors and cause more negative reactions in the bond and equity markets.
The rising US Dollar is a signal of strength in the economy, but also could have impacts on multinationals that will cause further rotation and volatility. Add that rotation on top of the continuing rotation from growth stocks to value stocks.
There is some discussion in the news of large margin calls linked to Archegos happening last week that may continue into next week. If so, there could be more downward pressure on the indexes.
-=x=-=x=-=x=-=x=-=x=-=x=-=x=-
Key Nasdaq Levels to Watch
The Nasdaq stayed in a channel drawn from the March 2020 bottom and is forming a symmetrical triangle that should breakout this week or next. It could breakout to the upside or downside.
On the positive side, the level we still want to reach is 13,620.71, but there's a few levels to pass before that happens:
The 21d EMA is at 13,239.15. We need to get above that line and stay above it.
The 50d MA is at 13,426.43. The 50d started to trend lower this week, and we need it to trend higher.
After the 50d MA, this past weeks high of 13,455.64 is the next goal. We need a higher high for next week.
The next line is 13,620.71 which is the high from two weeks ago. But it is also past the area of resistance that the index was rejected on 1/26, 3/2, and 3/16.
14,000 will be the next area of resistance.
The all-time high is at 14,175.12. That might be a stretch to get there this week, but keep it in our sites.
On the downside, the index must stay above 12,985.05 which was a previous neck line on a head and shoulders:
13,000 has been an area of support on 1/29, 2/23, 3/3. The index broke below that support area this week, but was able to rise back above it before the end of the week.
12,985.05 is just below that support area and a key level that would mark bearishness. The index also breached that line this past week.
The lower line of the channel from the March 2020 bottom is around 12,924 for next week.
The low of this past week is 12,786.81. Stay above that price to give us a higher low for this week.
The next support area is 12,500-12,550.
12,397.05 is the current bottom of the recent correction on the Nasdaq. Let's not make a new bottom.
-=x=-=x=-=x=-=x=-=x=-=x=-=x=-
Wrap-up
It may not seem like it looking at growth stocks or small caps, but there was plenty of optimism in the market this past week. The optimism though was focused on the economic recovery and what sectors stocks will benefit the most over the coming months.
Global investors are recognizing the strength of the US economic recovery and buying up the US dollar.
As the balance of growth and value stocks starts to even out, we can expect some of that global investment to start to move into the 2020 winners again. Still there is no guarantee that what did well last year, will do well again this year. Find what is holding up well relative to their industry sectors and the indexes.
Good luck, stay healthy and trade safe!

Daily Market Update for 3/26Trend lines drawn from the 3/5 low (16d), 3/22 (5d) and today 3/26 (1d).
Ideas always welcome in the comments. Errors will be amended as comments on TradingView or corrected inline in my blog.
-=x=-=x=-=x=-=x=-=x=-=x=-=x=-
Friday, March 26, 2021
Facts: +1.24%, Volume higher, Closing range: 96%, Body: +53%
Good: Rally in afternoon to close near intraday high
Bad: Nothing
Highs/Lows: Higher high, higher low
Candle: Thick green body with a long lower wick, very small upper wick
Advance/Decline: More than one advancing stock for every declining stock
Indexes: SPX (+1.66%), DJI (+1.39%), RUT (+1.76%), VIX (-4.80%)
Sectors: Technology (XLK +2.54%) and Materials (XLB +2.48%) were top. Utilities (XLU +0.33%) and Communications (XLC -1.09%) were bottom.
Expectation: Higher
-=x=-=x=-=x=-=x=-=x=-=x=-=x=-
Market Overview
A late afternoon rally in the market closed the week with a positive day for all the major indexes. It's not clear what caused the sudden late afternoon rally. It could just be expiring options activity, or it could be investors outlook of the economy improving. Morning economic data was mixed, but the personal income numbers and consumer sentiment showed the possibility of an upcoming rise in spending. Data from UK and Germany was also positive on their economies.
The Nasdaq closed the day with a +1.24% gain on higher volume. The closing range of 96% with a 53% green body over a long lower wick was enough to get a higher high on top of a higher low. The higher high and higher low with more volume than the previous day is a great indicator of strength. There were more advancing stocks than declining stocks.
The S&P 500 (SPX) rallied +1.66% to its all-time highest close. The Dow Jones Industrial (DJI) was nearing all-time highs when it closed the day with a +1.39% gain. The Russell 2000 (RUT) had its second day of gains, advancing 1.76%.
The VIX volatility index declined -4.80%.
The top sectors were Technology (XLK +2.54%) and Materials (XLB +2.48%). Communications (XLC -1.09%) was the only sector to have losses for the day.
-=x=-=x=-=x=-=x=-=x=-=x=-=x=-
Economic Indicators
The US Dollar (DXY) declined -0.05%.
The US 30y treasury bond and 10y and 2y note yields all rose for the day.
High Yield Corporate Bonds (HYG) prices rose while Investment Grade Corporate Bond (LQD) prices declined.
Silver (SILVER) declined slightly while Gold (GOLD) advanced. Crude Oil (CRUDEOIL1!) advanced, as the price becomes more volatile due to the Suez Canal blockage. Timber (WOOD) advanced. Copper (COPPER1!) and Aluminum (ALI1!) advanced.
-=x=-=x=-=x=-=x=-=x=-=x=-=x=-
Investor Sentiment
The put/call ratio stayed nearly even at 0.753. The put/call ratio (PCCE) is a contrarian indicator that shows overly bullish or overly bearish investor behavior. The 0.7 level is considered normal. As it approaches 0.60 (overly bullish) and below, watch for a possible pullback in the market.
The CNN Fear & Greed index is moved back to neutral.
The NAAIM Exposure index is back down to 57.52.
-=x=-=x=-=x=-=x=-=x=-=x=-=x=-
Market Leaders
Of the four largest mega-caps, only Alphabet (GOOGL) declined for the day, losing -0.38% and closing below its 21d EMA. Apple (AAPL) and Amazon (AMZN) both advanced but remain below their 21d EMA and 50d MA lines. Microsoft (MSFT) took back both its 21d EMA and 50d MA as it advanced +1.78% for the day.
ASML Holding (ASML), Taiwan Semiconductor (TSM), Intel (INTC) and Cisco (CSCO) were the top mega-cap gainers for the day, all advancing more than 4%. Tesla (TSLA), Comcast (CMCSA), Walt Disney (DIS) and Alphabet were at the bottom of the list.
Growth stocks had some winners and some losers. RH (RH) was at the top of the list with a +9.28% gain. ServiceNow (NOW), Dr Horton (DHI), JD.Com (JD) all had more than 4% gains. Still some growth stocks like GrowGeneration (GRWG), DraftKings (DKNG) did not rally on the day. UP Fintech (TIGR) dropped -11.93% after releasing earnings before market open.
-=x=-=x=-=x=-=x=-=x=-=x=-=x=-
Looking ahead
Next week will be a four-day trading week with markets closed on Good Friday.
There is not much economic news scheduled for Monday.
There are also no notable earnings reports for the Daily Update.
-=x=-=x=-=x=-=x=-=x=-=x=-=x=-
Trends, Support and Resistance
The index rallied back above the 13,000 support area in the last hour of trading.
The trend line from the 3/5 low points to a +0.65% gain for Monday, which is back above the 21d EMA.
The one-day trend line points to a -2.11% loss. The final hour rally was not enough to move the trend line built up the rest of the day.
The five-day trend line points to a -2.91% loss.
-=x=-=x=-=x=-=x=-=x=-=x=-=x=-
Wrap-up
The rally late on Friday was a welcome site. It may have been options related or it may have been investors finally absorbing the positive economic news from US, UK and Germany. Either way, I want to see a follow through on Monday with higher volume.
Stay healthy and trade safe!

Daily Market Update for 3/25Trend lines drawn from the 3/5 low (14d), 3/19 (5d) and today 3/25 (1d).
Ideas always welcome in the comments. Errors will be amended as comments on TradingView or corrected inline in my blog.
-=x=-=x=-=x=-=x=-=x=-=x=-=x=-
Thursday, March 25, 2021
Facts: +0.19%, Volume lower, Closing range: 85%, Body: +60%
Good: Closed near to intraday highs
Bad: Lower low hit in the morning, resistance at 13,000 near close
Highs/Lows: Lower high, lower low
Candle: Mostly green body with a slightly longer lower wick from morning dip
Advance/Decline: Three advancing stocks for every two declining stocks
Indexes: SPX (+0.52%), DJI (+0.62%), RUT (+2.29%), VIX (-6.56%)
Sectors: Financials (XLF +1.68%) and Industrials (XLI +1.60%) were top. Technology (XLK -0.06%) and Communications (XLC -0.49%) were bottom.
Expectation: Lower
-=x=-=x=-=x=-=x=-=x=-=x=-=x=-
Market Overview
Economic news seemed to weigh on the market after open, but investors shook off the weight later in the day to find gains across the major indexes. A short pullback to absorb the reaction from a weak 7y note auction was overcome to close near market intraday highs.
The Nasdaq closed with a +0.19% gain. The 0% closing range comes after an all-day bearish move that formed a 99% red body candle. The tiny upper wick is barely visible and there is no lower wick. There were five declining stocks for every advancing stock.
The Russell 2000 (RUT) rebounded to the top of the index list with a +2.29% gain for the day. The S&P 500 (SPX) gained +0.52% and the Dow Jones Industrial average (DJI) gained +0.62%.
The VIX volatility index declined -6.56%.
The top three sectors were Financials (XLF +1.68%), Industrials (XLI +1.60%) and Materials (XLB +1.45%). The bottom two sectors were Technology (XLK -0.06%) and Communications (XLC -0.49%) which were the only two to end the day with losses.
-=x=-=x=-=x=-=x=-=x=-=x=-=x=-
Economic Indicators
The US Dollar (DXY) continues to climb with a +0.35% gain. The strengthening dollar may be weighing on big tech and other multinationals.
The US 30y treasury bond and 10y note yields rose for the day while the 2y treasury note yield declined. The rising yields were triggered by a weak auction for 7y notes.
High Yield Corporate Bonds (HYG) prices rose while Investment Grade Corporate Bond (LQD) prices declined.
Silver (SILVER) and Gold (GOLD) declined just slightly. Crude Oil (CRUDEOIL1!) declined, despite the possibility of delays caused by the Suez Canal blockage. Timber (WOOD) advanced. Copper (COPPER1!) and Aluminum (ALI1!) declined.
-=x=-=x=-=x=-=x=-=x=-=x=-=x=-
Investor Sentiment
The put/call ratio rose to 0.755. The put/call ratio (PCCE) is a contrarian indicator that shows overly bullish or overly bearish investor behavior. The 0.7 level is considered normal. As it approaches 0.60 (overly bullish) and below, watch for a possible pullback in the market.
The CNN Fear & Greed index is moved farther into the fear side.
-=x=-=x=-=x=-=x=-=x=-=x=-=x=-
Market Leaders
Amazon (AMZN) and Microsoft (MSFT) declined with both trading below the 21d EMA and 50d MA. Apple (AAPL) advanced but remained below the 21d EMA and 50d MA. Alphabet (GOOGL) ended the day even with yesterday's close, bouncing in between tests of the 21d EMA and 50d MA and closing under the 21d EMA.
Bank of America (BAC), Cisco Systems (CSCO), Tesla (TSLA) and Home Depot (HD) were the top mega-caps. The top of the mega-cap list is focused on companies that are not impacted or maybe even benefit from a strengthening dollar. For example, companies relying on imports which become cheaper or companies that have most revenues sourced domestically. On the other hand, companies like Microsoft (MSFT), Nike (NKE) and Netflix (NFLX) have more dependency on foreign revenues and a stronger dollar can impact the value of repatriated revenues.
The growth stock list is mixed with winners and losers. SUMO Logic (SUMO) was at the top with a +6.22% gain. Most of the growth stocks at the top of the list are upside reversals from recent sell-offs so bases have not yet been formed. DataDog (DDOG) continues to drop with a -3.69% loss.
-=x=-=x=-=x=-=x=-=x=-=x=-=x=-
Looking ahead
Watch for further impacts to the US Dollar from tomorrow's economic data. There are plenty of data points to be released. More insights into consumer sentiment and behaviors will be released tomorrow. Consumer price index data for February as well as consumer sentiment and consumer expectations for March will drive outlooks for inflation and the US dollar.
On Friday, Up Fintech (TIGER) will release their earnings update.
-=x=-=x=-=x=-=x=-=x=-=x=-=x=-
Trends, Support and Resistance
The index dipped below the 13,000 area and tried to regain the support but fell short before close.
The trend line from the 3/5 low points to a +2.74% gain for Friday, which is back above the 21d EMA.
The one-day trend line points to a +0.71% gain to rise just above the 13,000 support area.
The five-day trend line points to a -0.51% loss.
-=x=-=x=-=x=-=x=-=x=-=x=-=x=-
Wrap-up
The indexes absorbed mixed news coming into the open of the market today. Jobless Claims were lower than expected which is a positive for the labor market. However, Core PCE Prices and GDP Sales data was weaker than expected. The 7-year auction mid-day was a concern as yields began to rise, but the index resumed the climb when it seemed bond selling was under control.
The strengthening dollar is now getting some attention and you'll see that show up in valuations of companies that impacting positively or negatively by a stronger dollar.
I have the expectation set for Sideways or Lower tomorrow. The Nasdaq did have a green day, but it's still a down trend with the lower high and lower low. Volume also needs to be higher on green days for more confidence.
Stay healthy and trade safe!

How the value of the Dollar and Gold impact marketsThis is a little different than what I usually do. Very straight forward line charts of the IXIC, DJI, and SPY. Showing how the changes in the value of the Dollar over Gold, impact the market. I know this isn’t the only influencing factor, as each market has its own levers, but this simple deviation of the two can weigh heavily on the markets.
