Amazon (AMZN), DJI, IXIC, SPX, GOLD - November 14Hello?
Dear traders, nice to meet you.
"Like" is a huge force for me.
By "following" you can always get new information quickly.
Thank you for always supporting me.
-------------------------------------------------- -----
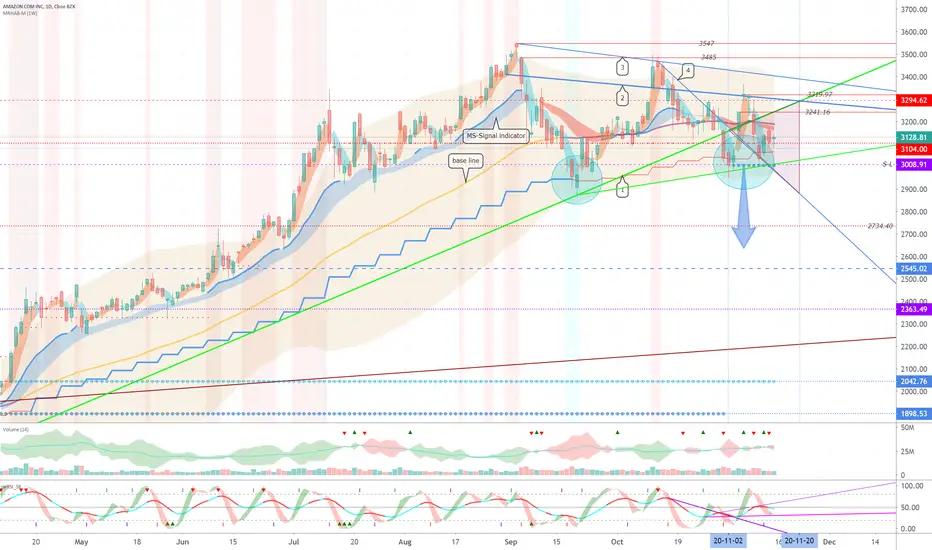
It started with the gap (3110.28-3122.0) rising and closed at 0.60%.
We have to see if we can get support and climb at 3104.0.
-----------------------------
(DJI 1D chart)
It started with the gap (29080.2-29203.9) rising and closed at 1.37%.
We have to see if we can break above the 29467.9 point and continue the high altitude march.
-----------------------------
(IXIC 1D chart)
It started with the gap (11709.6-11794.9) rising and closed at 1.02%.
We need to see if it can rise along the uptrend line (2).
-------------------------------
(SPX 1D chart)
It started with the gap (3537.0-3552.6) rising and closed at 1.36%.
It remains to be seen if the uptrend can continue within the uptrend line (3)-(4), the uptrend channel.
------------------------------
(BARRICK GOLD CORPORATION (GOLD) 1D chart)
It started with the gap (25.91-26.30) rising and closed at -0.08%.
We need to see if we can get support at 25.75 and break above the downtrend line.
-------------------------------------------------- -------------------------------------------
** Check support, resistance, and abbreviation points.
** Support or resistance is based on the closing price of the 1D chart.
** All explanations are for reference only and do not guarantee profit or loss on investment.
Explanation of abbreviations displayed on the chart
R: A point or section of resistance that requires a response to preserve profits
S-L: Stop-Loss point or section
S: A point or segment that can be bought for profit generation as a support point or segment
(Short-term Stop Loss can be said to be a point where profits and losses can be preserved or additionally entered through installment trading. You should trade from a short-term investment perspective.)
GAP refers to the difference in prices that occurred when the stock market, CME and BAKKT exchanges were closed because they are not trading 24 hours a day.
G1: Closed price
G2: Market price at the time of opening
Nasdaq Composite Index CFD
Market Week In Review - 11/9/2020 - 11/13/2020The Market Week in Review is my weekend homework where I look over what happened in the previous week and what might come in the next week. It helps me evaluate my observations, recognize new data points, and create a plan for possible scenarios in the future.
I am making some changes to the chart presentation and renaming the series to reflect the other data points I'm including. Still based out of the Nasdaq composite.
I do occasionally have some errors or typos and will correct them in my blog or in the comments on TradingView. I do not have an editor and do this in my free time.
If you find this helpful, please let me know in the comments. I am also more than happy to add new perspectives and data points if you have ideas.
The structure is the following:
A recap of the daily updates that I do here on TradingView.
The Meaning of Life, a larger view on the past week
What's coming in the next week
Key index levels to watch out for
Wrap-up
If you have been following my daily updates, you can skip down to the “The Meaning of Life”. If not, then this first part is a great play-by-play recap for the week. Click the original charts for more detail each day.
-=x=-=x=-=x=-=x=-=x=-=x=-=x=-=x=-=x=-=x=-=x=-=x=-=x=-=x=-=x=-=x=-=x=-=x=-=x=-=x=-=x=-=x=-=x=-=x=-
Monday, November 9, 2020
Oh life, it’s bigger
It’s bigger than you know
Facts: -1.53%% lower, Volume higher, Closing range: 3%, Body: 82%
Good: Nothing
Bad: Negative expectation breaker, not much pause on the way down
Highs/Lows: Higher high, lower low, bearish engulfing candle
Candle: Tiny top wick from morning, sell-off rest of day
Advance/Decline: 2.00, two advancing stocks for each declining stock
Sectors: Energy (+14.28%) and Financials (XLF +9.21%) were top. Technology (XLK -0.72%) and Communications (XLC -0.85%).
Expectation: Sideways or Lower
The market turned itself upside down again with a negative expectation breaker following the news of an effective Coronavirus vaccine from Pfizer (PFE +7.69%) and BioNTech (BNTX +13.91%). Investors quickly exited stocks that have grown during the pandemic and rushed into companies that have been weighted down such as travel and energy companies. The Nasdaq started with gains in the morning, but quickly turned those gains into losses that never stopped into close. The index closed down -1.53% with a closing range of 3% and a thick red body of 82%. The candle is a bearish engulfing, with a higher high and a lower low than the previous day. However, advancing stocks outnumbered declining stocks at a 2 to 1 ratio. Who benefited from the day? Small caps, lots of them.
-=x=-=x=-=x=-=x=-=x=-=x=-=x=-=x=-=x=-=x=-=x=-=x=-=x=-=x=-=x=-=x=-=x=-=x=-=x=-=x=-=x=-=x=-=x=-=x=-
Tuesday, November 10, 2020
Change don't come at once
It's a wave building before it breaks
Facts: -1.37% lower, Volume lower, Closing range: 54%, Body: 28%
Good: Successful test of 21d EMA
Bad: Choppy back and forth day after dip at open
Highs/Lows: Lower high, lower low, continuation candle
Candle: Thin body, closes in middle of candle, with longer bottom wick
Advance/Decline: 1.49, three advancing stocks for every two declining stocks
Sectors: Energy (+3.24%), Consumer Staples (XLP +1.97%), Industrials (XLI +1.76%) were top. Technology (XLK -1.86%) was at the bottom.
Expectation: Sideways or Lower
The market on Tuesday continued its rotation from big Technology and Communications stocks into small-cap and energy stocks. Initiated by the news on Monday of a vaccine for Coronavirus and hopes the economy could recover sooner than expected. The Nasdaq, heavy on technology stocks, has taken the brunt of the sell-off of stocks that have done well thus far in 2020. The index finished down -1.37% on lower volume than Monday, but higher than average volume for recent weeks. The candle has the properties of a continuation candle with a small 28% red body and a 54% closing range. It leaves me wondering if the index will move sideways from here or have further losses.
-=x=-=x=-=x=-=x=-=x=-=x=-=x=-=x=-=x=-=x=-=x=-=x=-=x=-=x=-=x=-=x=-=x=-=x=-=x=-=x=-=x=-=x=-=x=-=x=-
Wednesday, November 11, 2020
Whatever it takes
'Cause I love the adrenaline in my veins
Facts: +2.01% higher, Volume lower, Closing range: 95%, Body: 84%
Good: Up the whole day, closed near highs
Bad: Lower volume
Highs/Lows: Higher high, higher low
Candle: Very tiny wicks, sold green body
Advance/Decline: 1.30, a ratio of about 4:3 advancing to declining stocks
Sectors: Technology (XLK +2.37%) far above the others. Energy (XLE -1.03%) and Materials (XLB -1.49%) at the bottom.
Expectation: Sideways
As rotations often go, the move earlier this week into Energy, Transportation and Leisure stocks was a bit too far and needed to swing back the other way. The Nasdaq benefited from that swing back to Technology stocks which are still in-play until the pandemic is truly behind us. The index is up +2.01% today and moved upward almost the entire day, ending the day with a 95% closing range and 85% green body. Volume was lower than the previous days and fell below the 50d average volume. The positive day was a pleasant surprise after the past two days, but I think we can expect more of the unexpected in coming days and weeks.
-=x=-=x=-=x=-=x=-=x=-=x=-=x=-=x=-=x=-=x=-=x=-=x=-=x=-=x=-=x=-=x=-=x=-=x=-=x=-=x=-=x=-=x=-=x=-=x=-
Thursday, November 12, 2020
You'll never find your gold on a sandy beach
Facts: -0.65% lower, Volume higher, Closing range: 24%, Body: 51%
Good: Higher high, Higher low
Bad: Could not hold days high, finished near the low on higher volume
Highs/Lows: Higher high, higher low
Candle: Larger upper wick, thick body.
Advance/Decline: 0.48, 2 declining stocks for every advancing stock
Sectors: Consumer Staples (XLP -0.27%) and Health (XLV -0.37%). Energy (XLE -3.23%) and Materials (XLB -2.11%) at the bottom.
Expectation: Sideways or Lower
The market started the day with some energy when Initial Jobless Claims came in less than expected showing some positive news against continued economic worries surrounded by the pandemic. However, quickly sold off led by the Energy sector after Crude Oil Inventories showed a surprise increase when a decrease was expected. Core CPI came in less than expected and could be a sign of continued economic weakness. The Nasdaq fell -0.65% on slightly higher volume than the previous day. Volume is still below average for recent weeks. The candle has a closing range of 24% with a 51% red body. The upper wick is slightly higher showing the bears won the day. The Nasdaq had two declining stocks for every advancing stock, a better result than the broader market.
-=x=-=x=-=x=-=x=-=x=-=x=-=x=-=x=-=x=-=x=-=x=-=x=-=x=-=x=-=x=-=x=-=x=-=x=-=x=-=x=-=x=-=x=-=x=-=x=-
Friday, November 13, 2020
I walk alone, I walk alone
Facts: +1.02% higher, Volume lower, Closing range: 85%, Body: 26%
Good: Closing range near intraday highs
Bad: Lower volume
Highs/Lows: Higher high, higher low
Candle: Long lower wick, thin body, nearly an inside day.
Advance/Decline: 2.89, almost 3 advancing stocks for every declining stock
Sectors: Energy (XLE +3.64%) and Real Estate (XLRE +2.29%) at the top. Utilities (XLU +0.99%) and Technology (XLK +0.85%) at the bottom.
Expectation: Sideways or Higher
The Nasdaq was left out of the all-time high close party where the other indexes celebrated today. It was still a good day, but the focus was on sectors other than Technology, which is heavily represented in the Nasdaq. Producer Price Index (PPI) data came in higher then expected while Core PPI (which excludes Energy and Food) came in lower than expected. Investors seemed to attribute that to the Energy sector, which was the top performing sector of the day.
The Nasdaq index rose +1.02% and ended the day with an 85% closing range and a 26% green body in the upper half of the day. Volume was lower than the prior day. The longer lower wick was formed from morning lows which were not revisited through the rest of the day. A short upper wick formed near close as investors exited positions heading into the weekend. There were three advancing stocks for every declining stock in the Nasdaq.
-=x=-=x=-=x=-=x=-=x=-=x=-=x=-=x=-=x=-=x=-=x=-=x=-=x=-=x=-=x=-=x=-=x=-=x=-=x=-=x=-=x=-=x=-=x=-=x=-
The Meaning of Life (View on the Week)
The week of rotations. If your week started the same as mine, it was early Monday morning, and I was putting in my typical orders to create new positions in my favorite growth stocks. The election seemed behind us and it was time for the post-election rally.
And then it happened. The good news that was bad news; bad news for my growth stocks. Pfizer and BioNTech announced data from trials showed a 90% effectiveness rate for their vaccine. I was looking at the Zoom video chart at the time the news came out and watched it plunge.
Investors quickly exited growth stocks that had benefited from the pandemic lockdowns. But not before making a new all-time high for the Nasdaq. That all-time high was short lived as the tech-heavy Nasdaq sold off to other sectors. Where did they go? Two places.
First, they went to stocks that have been held down the pandemic. Those included Transportation stocks such as airlines, Travel stocks such as hotels and Leisure stocks including Cruise lines and Movie theatres. AMC as an example, rose 51.41% on Monday. The other big winner of the day was Energy stocks that will benefit from these other sectors picking back up activity.
Second, investors moved to small caps who also will benefit from an economic recovery. The Russell 2000 index rose 6% for the week compared to the Nasdaq composite index that lost -0.55% for the week.
Not all technology growth stocks were left in the dust. The rotation eventually rolled back somewhat on Wednesday when investors bought back big names like Apple, Microsoft and Amazon. Along with the big names several growth stocks were bought back heavily, but nonetheless ended the week mostly with losses.
Energy (XLE +17.11% WoW) was the clear winner of the week. Straight out of the gait, Energy benefited from the news that an effective vaccine could be available soon. The Energy sector would benefit from the economic recovery of several of sectors including Transportation, Travel and Leisure.
Financials (XLF +8.29% WoW) followed in a distance second. Banks have a lot to benefit from an economic recovery including higher yields in bonds as investors move back into equities.
Those two sectors stood tall above the rest who all performed more closely to the S&P 500 performance.
Technology (XLK -0.31% WoW) was the only sector to end the week with losses. A clear metric of what we already knew - that investors rotated out of popular technology stocks that benefited from the pandemic lockdowns.
US Treasure Bond Yields were up for the week. The 30Y-10Y spread tightened, but the 10Y-2Y spread is back near highs not seen since 2018. That does not necessarily warrant concern by itself but is something to continue to watch. The yields are still too low to attract investors out of equities. However, higher yields will impact where investors focus in the market. The higher yields drive interest rates and may signal a move toward value stocks and away from growth stocks which tend to be heavier on debt to rapidly grow business.
The big four mega-caps did not escape the rotation madness. Apple and Google are up for the week while Microsoft is down. Amazon had the worst week among the big four, ending the week under it’s 21d EMA and 50d MA. Apple and Microsoft both found themselves below these key moving averages earlier in the week but closed back above them by Friday. Depending on their sector, the other mega-caps had mixed results for the week.
The put/call ratio spiked toward the bearish side on Wednesday, but quickly moved back below the 0.7 bullish threshold. The contrarian indicator can show when there is too much bullish sentiment or too much bearish sentiment in the market. The indicator is still above the areas the proceeded corrections earlier this year.
Gold and Silver ended the week flat. Crude Oil futures gained ground. The big story continues to be aluminum. Beer and soda companies are struggling to keep up with demand. Yes, we are all drinking too much during the pandemic.
-=x=-=x=-=x=-=x=-=x=-=x=-=x=-=x=-=x=-=x=-=x=-=x=-=x=-=x=-=x=-=x=-=x=-=x=-=x=-=x=-=x=-=x=-=x=-=x=-
The Week Ahead
Next week the story will be about Retail and Consumer Staples. Earnings from big companies like Tyson Foods, Walmart, TJX, Target, Ross, Lowe’s will give investors a clear view in how consumer spending is recovering. The indicators from this past week, including Consumer Price Index, Producer Price Index and Consumer Confidence were mixed so next week’s earnings will be watched closely.
Nvidia will also announce earnings next week, one of the only big tech to release next week.
There will be comments made by the Federal Open Market Committee throughout the week. These comments usually contain subtle hints to monetary policy changes that may be on the horizon.
Core Retail Sales data will be released on Tuesday. Construction and Real Estate data will be released on Wednesday along with the weekly Crude Oil updates.
-=x=-=x=-=x=-=x=-=x=-=x=-=x=-=x=-=x=-=x=-=x=-=x=-=x=-=x=-=x=-=x=-=x=-=x=-=x=-=x=-=x=-=x=-=x=-=x=-
Key Nasdaq Levels to Watch
There are several key levels in the Nasdaq to keep an eye out for and respond accordingly. First on the positive side:
11965.54 is the 10/12 pivot day high and currently putting resistance on the index. Passing this will be the first test for next week.
Passing 12108.87 is the new all-time high. The index was only there briefly on Monday before selling-off.
On the downside, there are several key levels to raise red flags, many similar to what we watched for last week:
Tuesday’s low of 11,424.61. Dropping this low would be a signal of significant weakness.
The low of Thursday, Nov 4 is at 11,394.21. There is another gap to fill below that line.
The 21d EMA is at 11533.87. The index successfully tested that line and closed above it this past week.
October Support is at 11,400.
September Support is at 11,300, and just below the 50d MA of 11,308.07.
The next area to watch is the July support area at 10,600. Approaching that area would be a significant pullback and put the market back into correction.
-=x=-=x=-=x=-=x=-=x=-=x=-=x=-=x=-=x=-=x=-=x=-=x=-=x=-=x=-=x=-=x=-=x=-=x=-=x=-=x=-=x=-=x=-=x=-=x=-
Wrap-up
That was a crazy week. Growth stock portfolios were ripped apart and watchlists shredded. This weekend will be a good time to pause and look at the big picture of what is going on in the market. What are the new trends to emerge as the market looks past the pandemic? What companies are likely to find strength coming out of the pandemic. The energy, travel and leisure companies may continue to recover or there may be more tough times ahead.
Even with the pandemic in a second wave and new lockdowns possible, the market still seems to be looking beyond that, anticipating an end. On the other hand, it is very real that we are not out of the woods. Economic indicators are mixed across the board. Retail and Consumer Staples earnings next week will be watched very closely for how these sectors are performing now and what their outlook is for the next quarter.
Watch closely the comments from FOMC executives and their confidence levels for economic recovery and any changes to monetary policy.
Good luck, stay healthy and trade safe!

Daily Market Update for 11/13Trend lines drawn from the 10/13 pivot day (25d), 10/30 bottom (11d), 11/9 (5d), and today 11/13 (1d).
I am making some changes to the chart presentation and renaming the series to reflect the other data points I'm including. Still based out of the Nasdaq composite.
I do occasionally have some errors or typos and will correct them in my blog or in the comments on TradingView. I do not have an editor and do this in my free time.
-=x=-=x=-=x=-=x=-=x=-=x=-=x=-=x=-=x=-=x=-=x=-=x=-=x=-=x=-=x=-=x=-=x=-=x=-=x=-=x=-=x=-=x=-=x=-=x=-
Friday, November 13, 2020
I walk alone, I walk alone
Facts: +1.02% higher, Volume lower, Closing range: 85%, Body: 26%
Good: Closing range near intraday highs
Bad: Lower volume
Highs/Lows: Higher high, higher low
Candle: Long lower wick, thin body, nearly an inside day.
Advance/Decline: 2.89, almost 3 advancing stocks for every declining stock
Sectors: Energy (XLE +3.64%) and Real Estate (XLRE +2.29%) at the top. Utilities (XLU +0.99%) and Technology (XLK +0.85%) at the bottom.
Expectation: Sideways or Higher
-=x=-=x=-=x=-=x=-=x=-=x=-=x=-=x=-=x=-=x=-=x=-=x=-=x=-=x=-=x=-=x=-=x=-=x=-=x=-=x=-=x=-=x=-=x=-=x=-
Market Overview
The Nasdaq was left out of the all-time high close party where the other indexes celebrated today. It was still a good day, but the focus was on sectors other than Technology, which is heavily represented in the Nasdaq. Producer Price Index (PPI) data came in higher then expected while Core PPI (which excludes Energy and Food) came in lower than expected. Investors seemed to attribute that to the Energy sector, which was the top performing sector of the day.
The Nasdaq index rose +1.02% and ended the day with an 85% closing range and a 26% green body in the upper half of the day. Volume was lower than the prior day. The longer lower wick was formed from morning lows which were not revisited through the rest of the day. A short upper wick formed near close as investors exited positions heading into the weekend. There were three advancing stocks for every declining stock in the Nasdaq.
-=x=-=x=-=x=-=x=-=x=-=x=-=x=-=x=-=x=-=x=-=x=-=x=-=x=-=x=-=x=-=x=-=x=-=x=-=x=-=x=-=x=-=x=-=x=-=x=-
Indexes and Sectors
The S&P 500 (SPX -1.36%), Dow Jones Industrial average (DHI -1.37%) and Russell 2000 (RUT +2.08%) all had all-time high closes. The S&P 500 and Dow Jones Industrial are still below the intraday all-time highs they set on Monday. The RUT closed near its intraday all-time high and is up almost 13% from a bottom on 10/30.
All sectors ended the day with gains. Energy (XLE +3.64%), Real Estate (XLRE +2.29) and Industrials (XLI +2.22%) are the biggest winners of the day. Health (XLV +1.26%), Utilities (XLU +0.99%) and Technology (XLK +0.85%) had gains but lagged the S&P 500.
The VIX volatility index decreased -8.88%.
-=x=-=x=-=x=-=x=-=x=-=x=-=x=-=x=-=x=-=x=-=x=-=x=-=x=-=x=-=x=-=x=-=x=-=x=-=x=-=x=-=x=-=x=-=x=-=x=-
Bonds, Greenback and Commodities
Treasury Bond yields increased slightly for the day. The 10Y-2Y spread also increased while the 30Y-10Y spread continues to tighten over the past week.
The US dollar (DXY -0.26%) weakened. The Produce Price Index is a bullish indicator for the greenback, but the Consumer Confidence data released from University of Michigan is a bearish signal for the currency.
Gold (GOLD +0.65%) and Silver (SILVER +1.49%) both increased. Timber (WOOD +2.76%) returned from losses yesterday to end the week at a high point.
Crude Oil futures (CRUDEOIL -3.71%) dropped but is still up over 18% since the end of October.
-=x=-=x=-=x=-=x=-=x=-=x=-=x=-=x=-=x=-=x=-=x=-=x=-=x=-=x=-=x=-=x=-=x=-=x=-=x=-=x=-=x=-=x=-=x=-=x=-
Market Leaders
All four big mega-caps had gains for the day. Only Google (GOOG +1.55%) outperformed the Nasdaq. Apple (AAPL +0.04%) closed nearly even for the day. Microsoft (MSFT +0.50%) and Amazon (AMZN +0.6%) did better but still underperformed the market at open and close and lagged the intraday movement.
Growth stocks continued the mix of gains and losses that have been the hallmark of this week. Fiverr (FVRR +4.97%), JD.COM (JD +6.60%), D.R. Horton (DHI +2.59%) were among stocks that had did well. Zoom (ZM -5.85%) and Peloton (PTON +7.29%) were among the stocks that continued to slide as the potential for a new vaccine could change the growth characteristics for these businesses that benefited from lockdowns.
Draft Kings (DKNG +3.85%) beat expectations and gave a great forecast. It gapped at open but dropped nearly 6% in intraday trading.
-=x=-=x=-=x=-=x=-=x=-=x=-=x=-=x=-=x=-=x=-=x=-=x=-=x=-=x=-=x=-=x=-=x=-=x=-=x=-=x=-=x=-=x=-=x=-=x=-
Looking ahead
Daly and Clarida, members of the Federal Open Market Committee, will speak on Monday about the economy which usually drops hints about monetary policy.
Tyson Foods (TSN +2.50%) will release earnings on Monday, kicking off a week or consumer and retail earnings releases for next week.
-=x=-=x=-=x=-=x=-=x=-=x=-=x=-=x=-=x=-=x=-=x=-=x=-=x=-=x=-=x=-=x=-=x=-=x=-=x=-=x=-=x=-=x=-=x=-=x=-
Trends, Support and Resistance
The trend line from the 10/30 bottom has consistently pointed to a new all-time high, as prices moved mostly sideways this week. That would be a +2.38% increase and welcome the index to the group of other indexes trading at all-time highs. Continuing today’s one-day trend line would result in a +0.29% gain.
The five-day trend line is still on a negative slope and pointing to a -1.15% loss for Monday. The longest trend line from the 10/12 pivot day is pointing to a -2.59% loss, right at the 21d EMA.
-=x=-=x=-=x=-=x=-=x=-=x=-=x=-=x=-=x=-=x=-=x=-=x=-=x=-=x=-=x=-=x=-=x=-=x=-=x=-=x=-=x=-=x=-=x=-=x=-
Wrap-up
Friday continued the week of rotations, causing a lot of damage to investors favorite watchlists. Its hard to find setups with good entry points when heavy rotations are occurring. Hopefully next week will bring some more resolution around issues impacting the market and give more indication of direction.
Take care!

Amazon (AMZN), DJI, IXIC, SPX, GOLD - November 13Hello?
Dear traders, nice to meet you.
"Like" is a huge force for me.
By "following" you can always get new information quickly.
Thank you for always supporting me.
-------------------------------------------------- -----
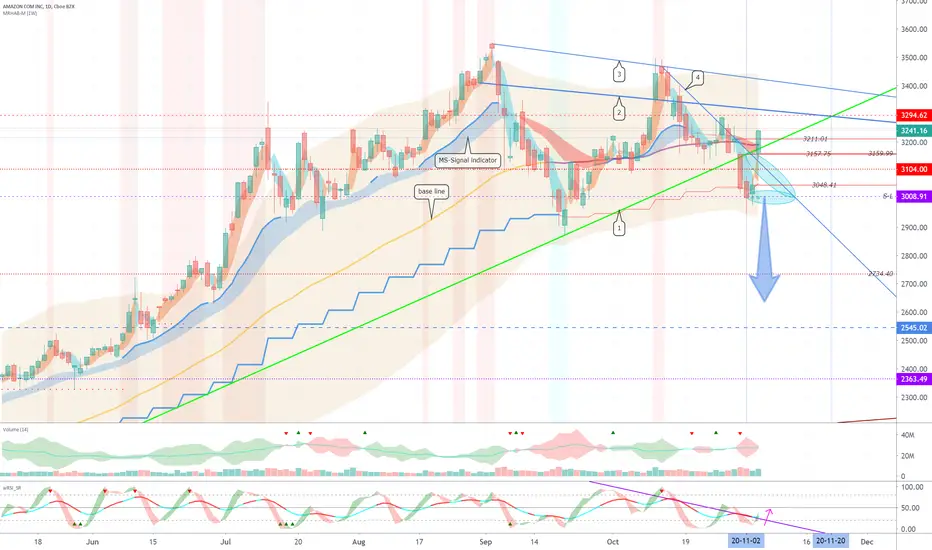
The gap (3050.0-3159.95) started higher and closed lower.
You need to make sure you get support at point 3104.0.
If it gains support and rises between 3008.91-3104.0, it is expected to rise along the uptrend line (1).
Therefore, I think the current position is an important position to determine the future flow.
---------------------------------------
(DJI 1D chart)
It started with a decline in the gap (29397.6-29231.9) and closed at -1.08%.
We have to see if we can get support and climb at 28989.7.
---------------------------------------
(IXIC 1D chart)
It started with the gap (11786.4-11802.5) rising and closed at -0.65%.
We need to see if it can rise along the uptrend line (2).
------------------------------------------
(SPX 1D chart)
It started with the gap (3572.7-3562.7) falling and closed at -1.0%.
-----------------------------------------
(GOLD 1D chart)
It started with the gap (25.79-26.02) rising and closed at 0.47%.
We must see if we can get support above the 25.75 point and break above the downtrend line.
-------------------------------------------------- -------------------------------------------
** Check support, resistance, and abbreviation points.
** Support or resistance is based on the closing price of the 1D chart.
** All explanations are for reference only and do not guarantee profit or loss on investment.
Explanation of abbreviations displayed on the chart
R: A point or section of resistance that requires a response to preserve profits
S-L: Stop-Loss point or section
S: A point or segment that can be bought for profit generation as a support point or segment
(Short-term Stop Loss can be said to be a point where profits and losses can be preserved or additionally entered through installment trading. You should trade from a short-term investment perspective.)
GAP refers to the difference in prices that occurred when the stock market, CME and BAKKT exchanges were closed because they are not trading 24 hours a day.
G1: Closed price
G2: Market price at the time of opening

Daily Market Update for 11/12Trend lines drawn from the 10/12 pivot day (24d), 10/30 bottom (10d), 11/6 (5d), and today 11/12 (1d).
I am making some changes to the chart presentation and renaming the series to reflect the other data points I'm including. Still based out of the Nasdaq composite.
I do occasionally have some errors or typos and will correct them in my blog or in the comments on TradingView. I do not have an editor and do this in my free time.
-=x=-=x=-=x=-=x=-=x=-=x=-=x=-=x=-=x=-=x=-=x=-=x=-=x=-=x=-=x=-=x=-=x=-=x=-=x=-=x=-=x=-=x=-=x=-=x=-
Thursday, November 12, 2020
You'll never find your gold on a sandy beach
Facts: -0.65% lower, Volume higher, Closing range: 24%, Body: 51%
Good: Higher high, Higher low
Bad: Could not hold days high, closed near the low on higher volume
Highs/Lows: Higher high, higher low
Candle: Larger upper wick, thick body.
Advance/Decline: 0.48, 2 declining stocks for every advancing stock
Sectors: Consumer Staples (XLP -0.27%) and Health (XLV -0.37%). Energy (XLE -3.23%) and Materials (XLB -2.11%) at the bottom.
Expectation: Sideways or Lower
-=x=-=x=-=x=-=x=-=x=-=x=-=x=-=x=-=x=-=x=-=x=-=x=-=x=-=x=-=x=-=x=-=x=-=x=-=x=-=x=-=x=-=x=-=x=-=x=-
Market Overview
The market started the day with some energy when Initial Jobless Claims came in less than expected showing some positive news against continued economic worries surrounded by the pandemic. However, quickly sold off led by the Energy sector after Crude Oil Inventories showed a surprise increase when a decrease was expected. Core CPI came in less than expected and could be a sign of continued economic weakness. The Nasdaq fell -0.65% on slightly higher volume than the previous day. Volume is still below average for recent weeks. The candle has a closing range of 24% with a 51% red body. The upper wick is slightly higher showing the bears won the day. The Nasdaq had two declining stocks for every advancing stock, a better result than the broader market.
-=x=-=x=-=x=-=x=-=x=-=x=-=x=-=x=-=x=-=x=-=x=-=x=-=x=-=x=-=x=-=x=-=x=-=x=-=x=-=x=-=x=-=x=-=x=-=x=-
Indexes and Sectors
The S&P 500 (SPX -1.00%), Dow Jones Industrial average (DHI -1.08%) and Russell 2000 (RUT -1.64%) also had losses on the day with the RUT seeing the biggest decline. The RUT confirms a hanging man candlestick the previous day, signaling a reversal for the index.
All sectors ended the day with losses. Communications (XLC -0.57%), Technology (XLK -0.89%) and Health (XLV -0.37%) led the morning gains before losing ground. Consumer Staples (XLP -0.27%) ended the day with the least damage. Energy (XLE -3.23%) and Materials (XLB -2.11%) were the worst two sectors for the second day in a row.
The VIX volatility index increased +8.10% reversing a recent downtrend.
-=x=-=x=-=x=-=x=-=x=-=x=-=x=-=x=-=x=-=x=-=x=-=x=-=x=-=x=-=x=-=x=-=x=-=x=-=x=-=x=-=x=-=x=-=x=-=x=-
Bonds, Greenback and Commodities
Treasury Bond yields declined for the day. The 10Y-2Y spread also decreased. The spread was is near its highest point since February of 2018.
The US dollar (DXY -0.09%) weakened slightly after several days of gains.
A decrease in the value of Gold (GOLD +0.61%) increased slightly while Silver (SILVER +0.10%) remained about the same. Timber (WOOD -2.32%) took a reversal off a high point.
Crude Oil futures (CRUDEOIL -0.03%) remained flat despite OPEC lowering demand estimates and inventories increasing more than expected. Crude Oil is up over 15% since the start of November.
-=x=-=x=-=x=-=x=-=x=-=x=-=x=-=x=-=x=-=x=-=x=-=x=-=x=-=x=-=x=-=x=-=x=-=x=-=x=-=x=-=x=-=x=-=x=-=x=-
Market Leaders
Except for Amazon (AMZN -0.86%), the big four mega-caps of Apple (AAPL -0.23%), Microsoft (MSFT -0.51%) and Google (GOOG -0.16%) outperformed the index despite having losses for the day. Amazon tested the 21d EMA but did not make it over and remains the only of the big four under the key moving average lines. Most other mega-caps had losses today.
Growth stocks saw a mix of gains and losses today. Elective Vehicle company NIO (NIO +12.12%) rose significantly. GrowGeneration (GRWG +16.05%) a provider of hydroponic and organic gardening supplies had a huge boost from earnings and election results that are viewed to be in support of the industry. WIX.com (WIX -5.45%) had a mixed reaction to earnings, selling off but staying within this past weeks trading range.
-=x=-=x=-=x=-=x=-=x=-=x=-=x=-=x=-=x=-=x=-=x=-=x=-=x=-=x=-=x=-=x=-=x=-=x=-=x=-=x=-=x=-=x=-=x=-=x=-
Looking ahead
Growth stock Draftkings (DKNG -0.94%) will announce earnings tomorrow.
Producer Price Index (PPI) will be release tomorrow prior to market open. This will give another view on inflation.
-=x=-=x=-=x=-=x=-=x=-=x=-=x=-=x=-=x=-=x=-=x=-=x=-=x=-=x=-=x=-=x=-=x=-=x=-=x=-=x=-=x=-=x=-=x=-=x=-
Trends, Support and Resistance
The trend from the 10/30 bottom still points to just above all time highs at a +3.12% gain from today’s close. That is the only trend line showing a positive gain for tomorrow. Add that to a bearish candlestick pattern for today and it seems unlikely without a news catalyst.
The five-day trend line is pointing to a -0.76% loss for tomorrow. The longest trend line from the 10/12 pivot day is meeting up with the one-day trend at a -1.95% loss. That would be just below the 21d EMA but above the October support area.
It is worth noting that the Nasdaq is forming an ascending triangle on the index daily chart. A pattern is just a pattern and does not necessarily predict anything. There is a lot that can disrupt expectations from the unfinalized election to the unknowns the pandemic and vaccine timing. If the pattern does play out, it is showing more consolidation before the market can move higher. If that is true, there is a good chance for the index to revisit the bottom of the ascending triangle. I added a line on the chart for the bottom of the triangle. The top is same as the all-time high line.
-=x=-=x=-=x=-=x=-=x=-=x=-=x=-=x=-=x=-=x=-=x=-=x=-=x=-=x=-=x=-=x=-=x=-=x=-=x=-=x=-=x=-=x=-=x=-=x=-
Wrap-up
It has been mostly a sideways move for the market since Monday’s rotation instigated by the positive news of a vaccine for Coronavirus, possibly bringing an end to the economic stress sooner than expected.
At the same time, the signals are mixed. Investors rotated back into covid-plays the past two days. Many economic indicators that were positives on Monday and Tuesday are softening or reversing now.
On the positive side, the four mega-caps held up well compared to the market today. Although it did have some impact, Investors did not overreact to the economic news of consumer prices and oil inventories.
Take care!

Amazon (AMZN), DJI, IXIC, SPX, GOLD - November 12Hello?
Dear traders, nice to meet you.
"Like" is a huge force for me.
By "following" you can always get new information quickly.
Thank you for always supporting me.
-------------------------------------------------- -----
The gap (3035.02-3061.78) started with an increase and ended higher.
It remains to be seen if it will rise above 3159.99 and fill the previous gap (3048.41-3159.99).
If it is supported at 3104.0 in the short-term downtrend, it is expected to rise towards the 3294.62 point.
If it falls from the 3008.91 point, it is the Stop Loss point.
Secondly, I touched the support line.
I think it's time to get support at 3104.0 to get further up.
--------------------------------------
(DJI 1D chart)
The gap (29420.9-29524.4) started and closed with a rise.
------------------------------------
(IXIC 1D chart)
The gap (11424.6-11656.6) started with an increase and ended higher.
------------------------------------
(SPX 1D chart)
The gap (3545.5-3563.2) started with a rise and ended higher.
----------------------------------
(GOLD 1D chart)
You need to make sure you can get support at 25.75.
If you move down the downtrend line, you need to see if you get support at 22.51-24.07.
It remains to be seen if the rebound could increase more than 26.55 points.
-------------------------------------------------- -------------------------------------------
** Check support, resistance, and abbreviation points.
** Support or resistance is based on the closing price of the 1D chart.
** All explanations are for reference only and do not guarantee profit or loss on investment.
Explanation of abbreviations displayed on the chart
R: A point or section of resistance that requires a response to preserve profit
S-L: Stop-Loss point or section
S: A point or segment that can be bought for profit generation as a support point or segment
(Short-term Stop Loss can be said to be a point where profits and losses can be preserved or additionally entered through installment trading. You should trade from a short-term investment perspective.)
GAP refers to the difference in prices that occurred when the stock market, CME and BAKKT exchanges were closed because they do not trade 24 hours a day.
G1: Closed price
G2: Market price at the time of opening

Daily Market Update for 11/11Trend lines drawn from the 10/12 pivot day (23d), 10/30 bottom (9d), 11/5 (5d), and today 11/11 (1d).
I am making some changes to the chart presentation and renaming the series to reflect the other data points I'm including. Still based out of the Nasdaq composite.
I do occasionally have some errors or typos and will correct them in my blog or check the comments on TradingView. I don’t have an editor and do this in my free time.
-=x=-=x=-=x=-=x=-=x=-=x=-=x=-=x=-=x=-=x=-=x=-=x=-=x=-=x=-=x=-=x=-=x=-=x=-=x=-=x=-=x=-=x=-=x=-=x=-
Wednesday, November 11, 2020
Whatever it takes
'Cause I love the adrenaline in my veins
Facts: +2.01% higher, Volume lower, Closing range: 95%, Body: 84%
Good: Up the whole day, closed near highs
Bad: Lower volume
Highs/Lows: Higher high, higher low
Candle: Very tiny wicks, sold green body
Advance/Decline: 1.30, a ratio of about 4:3 advancing to declining stocks
Sectors: Technology (XLK +2.37%) far above the others. Energy (XLE -1.03%) and Materials (XLB -1.49%) at the bottom.
Expectation: Sideways
-=x=-=x=-=x=-=x=-=x=-=x=-=x=-=x=-=x=-=x=-=x=-=x=-=x=-=x=-=x=-=x=-=x=-=x=-=x=-=x=-=x=-=x=-=x=-=x=-
Market Overview
As rotations often go, the move earlier this week into Energy, Transportation and Leisure stocks was a bit too far and needed to swing back the other way. The Nasdaq benefited from that swing back to Technology stocks which are still in-play until the pandemic is truly behind us. The index is up +2.01% today and moved upward almost the entire day, ending the day with a 95% closing range and 85% green body. Volume was lower than the previous days and fell below the 50d average volume. The positive day was a pleasant surprise after the past two days, but I think we can expect more of the unexpected in coming days and weeks.
-=x=-=x=-=x=-=x=-=x=-=x=-=x=-=x=-=x=-=x=-=x=-=x=-=x=-=x=-=x=-=x=-=x=-=x=-=x=-=x=-=x=-=x=-=x=-=x=-
Indexes and Sectors
The S&P 500 (SPX +0.77%) had a positive inside day ending with gains. An inside day is when the high and low is within the prior days high and low. The day fits within the past two days that have opened and closed within a 1% range in the index. The Dow Jones Industrial average (DJI -0.08%) had a small loss but is also within a tight open/close range for this week. The Russell 2000 (RUT -0.00%) ended the day flat but with a candle that looks like a top signal, to be confirmed later this week.
Technology (XLK +2.37%) clearly had everyone’s attention today as traders moved back into stocks that have done well during the pandemic. Communications (XLC +0.91%) followed with a far second and close to several other sectors ending positive on the day. Energy (XLE -1.03%) and Materials (XLB -1.49%) were the losing sectors of the day as investors took profits and rotated back to tech. Financials (XLF -0.41%) and Industrials (XLI -0.84%) were also down after gains earlier this week.
The VIX volatility index decreased -5.44% for the day and had the lowest close since early September.
-=x=-=x=-=x=-=x=-=x=-=x=-=x=-=x=-=x=-=x=-=x=-=x=-=x=-=x=-=x=-=x=-=x=-=x=-=x=-=x=-=x=-=x=-=x=-=x=-
Bonds, Forex and Commodities
Treasury Bond yields decreased for the day. The 10Y-2Y spread also decreased, but not so much to cause alarm. The spread, an indicator of investors’ confidence in the economy, is still at its highest point since February of 2018.
The US dollar (DXY +0.32%) strengthened, also signaling investors’ confidence in economic recovery.
A decrease in the value of Gold (GOLD -0.63%) is not unexpected when the value of the US dollar increases. Silver (SILVER +0.16%) remained about the same. Timber (WOOD +0.73%) is at its highest point since 2018.
Crude Oil futures (CRUDEOIL +1.90%) is up over 15% since the start of November and had increases today despite OPEC projecting weaker demand thru 2021. The worsening projection was not a surprise to investors.
-=x=-=x=-=x=-=x=-=x=-=x=-=x=-=x=-=x=-=x=-=x=-=x=-=x=-=x=-=x=-=x=-=x=-=x=-=x=-=x=-=x=-=x=-=x=-=x=-
Market Leaders
The big four mega-caps all reversed off losses yesterday to close with gains today. Apple (AAPL +3.04%), Microsoft (MSFT +2.63%) and Amazon (AMZN +3.37%) all outperformed the index from open to close. Google (GOOG +0.71%) continues to move sideways after several weeks of growth. Only Amazon remains below the key 21d EMA and 50d MA lines which can act as resistance as well as support. The rest of the mega-caps faired well, except for those who benefited from the rotation earlier in the week. Investors took profits from mega-cap stocks in Financials and Consumer Staples.
Many growth stocks had gains today, but any excitement needs to be tempered with the losses they incurred on Monday and Tuesday. Fiverr International (FVRR +17.66%) had a big gain but is still down -15% for the week. Nvidia (NVDA +5.07%) is up today but still down -8% for the week. Pinterest (PINS +6.97%) is also up for the day but remains down -8% for the week. That list can go on and on.
Datadog (DDOG -6.23%) is down after beating expectations but not impressing investors enough to stick with the stock. GrowGeneration (GRWG +7.77%) met earnings expectations and is up 7% in afterhours trading.
-=x=-=x=-=x=-=x=-=x=-=x=-=x=-=x=-=x=-=x=-=x=-=x=-=x=-=x=-=x=-=x=-=x=-=x=-=x=-=x=-=x=-=x=-=x=-=x=-
Looking ahead
Farfetch (FTCH +3.88%), Globant (GLOB -1.85%) and Wix.com (WIX +10.49%), Applied Materials (AMAT +2.55%) are among earnings releases for tomorrow.
On the economic news calendar, Consumer Price Index data, Initial Jobless Claims and Crude Oil Inventories will be announced tomorrow. Expect Consumer Price Index is projected to remain about the same. Initial Jobless Claims are expected to be lower from last week. Crude Oil Inventories are expected to be negative after a big surprise decrease last week.
-=x=-=x=-=x=-=x=-=x=-=x=-=x=-=x=-=x=-=x=-=x=-=x=-=x=-=x=-=x=-=x=-=x=-=x=-=x=-=x=-=x=-=x=-=x=-=x=-
Trends, Support and Resistance
The trend from the 10/30 bottom is pointing to a +3.12% increase for tomorrow, taking the index back to all-time highs. A more modest gain would be following today’s one-day trend line that would result in a +0.55% gain, a sideways move considering the trading range over the past week.
The five-day trend line is pointing to a -1.50% loss while the longer-term trend line from the 10/12 pivot day is pointing to a -2.95% loss. The latter would be just below the 21d EMA.
It is worth noting that the Nasdaq is forming an ascending triangle on the index daily chart. A pattern is just a pattern and does not necessarily predict anything. There is a lot that can disrupt expectations from the unfinalized election to the unknowns the pandemic and vaccine timing. However, if the pattern does play out, it’s showing consolidation before the market can move higher. If that is true, there is a good chance for the index to revisit the bottom of the ascending triangle. I added a line on the chart for the bottom of the triangle. The top is same as the all-time high line.
-=x=-=x=-=x=-=x=-=x=-=x=-=x=-=x=-=x=-=x=-=x=-=x=-=x=-=x=-=x=-=x=-=x=-=x=-=x=-=x=-=x=-=x=-=x=-=x=-
Wrap-up
Lots to absorb in the past two weeks. I know personally I would like to see a direction for the market, and I imagine most investors are in the same boat. If it wants to go up, great. If it wants to go down, also great. But the back and forth, stock rotations, news impacts can all be very tiring and demoralizing.
Keep your spirits up and know you are not alone. With a little luck, you have been turning a profit. If not, there will be future profits to be had.
Take care!

Amazon (AMZN), DJI, IXIC, SPX, GOLD - November 11Hello?
Dear traders, nice to meet you.
"Like" is a huge force for me.
By "following" you can always get new information quickly.
Thank you for always supporting me.
-------------------------------------------------- -----
The gap (3143.74-3095.02) started lower and closed lower.
You need to make sure you can get support at 3008.91.
If it falls from the 3008.91 point, there is a possibility that it falls below the 2734.40 point.
If you are supported at 3008.91, it is a possible entry point.
Therefore, careful trading is necessary.
------------------------------------------------
(DJI 1D chart)
The gap (29158.0-29254.2) started with a rise and ended higher.
You should check for any movement that deviates from the 28989.7-29467.9 section.
-------------------------------------------------- -
(IXIC 1D chart)
The gap (11713.8-11622.4) started lower and closed lower.
You should check for any movement that deviates from the 11458.1-11695.6 segment.
-------------------------------------------------
(SPX 1D chart)
It started and closed with the gap (3550.5-3543.3) falling.
You should check for any movement that deviates from the 3483.3-3580.8 section.
------------------------------------------------
(GOLD 1D chart)
We have to get support at 25.75 and see if we can get off the downtrend line.
It is said to fall from the 25.75 point, and is likely to touch the 24.07 point.
After falling from the 29.65 point, it fell below the middle level.
If it falls below the 19.15 point, it enters the low end, that is, the mid- to long-term investment zone.
Therefore, it is important to get support at the 24.07 point.
-------------------------------------------------- -------------------------------------------
** Check support, resistance, and abbreviation points.
** Support or resistance is based on the closing price of the 1D chart.
** All explanations are for reference only and do not guarantee profit or loss on investment.
Explanation of abbreviations displayed on the chart
R: A point or section of resistance that requires a response to preserve profits
S-L: Stop-Loss point or section
S: A point or segment that can be bought for profit generation as a support point or segment
(Short-term Stop Loss can be said to be a point where profits and losses can be preserved or additionally entered through installment trading. You should trade from a short-term investment perspective.)
GAP refers to the difference in prices that occurred when the stock market, CME and BAKKT exchanges were closed because they are not trading 24 hours a day.
G1: closing price when closed
G2: Market price at the time of opening


Nasdaq Composite sideways correction, rising to 13500 by Feb2021
Nasdaq Composite has just finished or about to finish the Wave 2 correction of the larger Wave (3) of the larger Wave 5. Some may identify the 2 Sep to 9 Nov 2020 correction as a triangle, but triangles usually appear in the later part of a larger wave, like the second half of wave 3 or wave 4 or in the case of diagonal triangle, wave 5. This is obviously the Wave 2 of the larger Wave (3), the bullish run from March 2020 is fairly young, still has huge space and time to grow, because Wave (3) are quite often extended and could never be the shortest wave. Therefore the 2 Sep to 9 Nov 2020 correction should be correctly typed as a WXY double three or WXYXZ triple three.
Double three and triple threes are the less well known types of Elliott Wave correction, but they appear more frequently in the 21st century than 40 or 100 years ago. Perhaps because people today are less patient and trade much faster than 1920s traders, there's often not enough time for the classical 5-wave Wave A and Wave C to develop, instead we get the sideways 3-3-3 WXY correction. There might be another retest of 10800 support within the next 2 weeks, forming the WXYXZ triple three correction.
The long term trend of Nasdaq Composite is extremely bullish, in Oct 2020 IXIC bounced up nicely from the 20-week simple moving average, confirming the uptrend is unharmed. I expect more positive news about Corona virus vaccine in November and December 2020, the Christmas season has a statistically 73% probability of being bullish starting from 1950. If we start counting from 1990, December has a staggering 77% probability of bull.
The top of the small scale Fibonacci channel converges with the 1.618 extension of the older large Fibonacci channel in Jan and Feb 2021, so the converging point of 13500 is a very valid target. As the Fed has promised to keep the interest rate close to zero for the foreseeable future in Aug 2020, the huge bull of American stocks especially tech stocks will continue. 16000 in latter 2021 seems reasonable, we will probably get 20000 in 2022 and 30000 in 2023 or 2024.

Amazon (AMZN), DJI, IXIC, SPX - November 10Hello?
Dear traders, nice to meet you.
"Like" is a huge force for me.
By "following" you can always get new information quickly.
Thank you for always supporting me.
--------------------------------------------------
The gap (3311.37-3231.03) started lower and closed lower.
If it falls, we need to see if we can get support at 3104.0.
You'll have to see if you can Sideways on the extension between the downtrend line (4) and the uptrend line (1).
If you are supported at 3008.91, this is the point you can enter.
If it falls from the 3008.91 point, I think there is a high probability that it will fall below the 2734.40 point.
As it is on a short-term uptrend, there is a possibility of a rebound.
At this time, if there is no evidence of support above the uptrend line (1), further entry is not recommended.
--------------------------------------------------
(DJI 1D chart)
The gap (28323.4-29467.9) started and closed with a rise.
A new high was created by touching the 29933.8 point.
We'll see if we can hold the index above the 28989.7 point.
--------------------------------------------------
(IXIC 1D chart)
The gap (11895.2-12046.7) started higher and closed lower.
Touching the 12108.1 point made a new high and closed lower.
We'll see if we can hold the index above the 11695.6 point.
--------------------------------------------------
(SPX 1D chart)
It started and closed with the gap (3509.4-3583.0) rising.
Touching the 3646.0 point made a new high and closed lower.
We will see if we can keep the index above the 3455.1 point.
--------------------------------------------------
-About the index chart-
The index has risen to its current position with successive gap increases.
We believe that careful trading is necessary as gaps may fall one after another to find a support base.
The points that the index should maintain were mentioned in the description of each index chart.
If the index holds above that point, I think there is a possibility that the uptrend will continue until we find a support zone for each stock.
--------------------------------------------------
(BARRICK GOLD CORPOTATION (GOLD) 1D chart)
It started with the gap (28.87-27.22) lower and closed lower.
We have to see if we can keep it above the 26.55 point.
If you fall from the 26.55 point, you are likely to touch below the 24.07 point.
We have to see if we can get support by climbing over the important point of 27.70.
If you are supported at the 27.70 point, this is where you can enter.
This is a big gap fall amid a short-term downtrend, so watch the flow carefully.
----------------------------------------------------------------------------------------------
** Check support, resistance, and abbreviation points.
** Support or resistance is based on the closing price of the 1D chart.
** All explanations are for reference only and do not guarantee profit or loss on investment.
Explanation of abbreviations displayed on the chart
R: A point or section of resistance that requires a response to preserve profits
S-L: Stop-Loss point or section
S: A point or segment that can be bought for profit generation as a support point or segment
(Short-term Stop Loss can be said to be a point where profits and losses can be preserved or additionally entered through installment trading. You should trade from a short-term investment perspective.)
GAP refers to the difference in prices that occurred when the stock market, CME and BAKKT exchanges were closed because they are not trading 24 hours a day.
G1: closing price when closed
G2: Market price at the time of opening

Daily Market Update for 11/9Trend lines drawn from the 10/12 pivot day (21d), 10/30 bottom (7d), 11/3 (5d), and today 11/9 (1d).
I am making some changes to the chart presentation and renaming the series to reflect the other data points I'm including. Still based out of the Nasdaq composite.
-=x=-=x=-=x=-=x=-=x=-=x=-=x=-=x=-=x=-=x=-=x=-=x=-=x=-=x=-=x=-=x=-=x=-=x=-=x=-=x=-=x=-=x=-=x=-=x=-
Monday, November 9, 2020
Oh life, it’s bigger
It’s bigger than you know
Facts: -1.53%% lower, Volume higher, Closing range: 3%, Body: 82%
Good: Nothing
Bad: Negative expectation breaker, not much pause on the way down
Highs/Lows: Higher high, lower low, bearish engulfing candle
Candle: Tiny top wick from morning, sell-off rest of day
Advance/Decline: 2.00, two advancing stocks for each declining stock
Sectors: Energy (+14.28%) and Financials (XLF +9.21%) were top. Technology (XLK -0.72%) and Communications (XLC -0.85%).
Expectation: Sideways or Lower
-=x=-=x=-=x=-=x=-=x=-=x=-=x=-=x=-=x=-=x=-=x=-=x=-=x=-=x=-=x=-=x=-=x=-=x=-=x=-=x=-=x=-=x=-=x=-=x=-
Market Overview
The market turned itself upside down again with a negative expectation breaker following the news of an effective Coronavirus vaccine from Pfizer (PFE +7.69%) and BioNTech (BNTX +13.91%). Investors quickly exited stocks that have grown during the pandemic and rushed into companies that have been weighted down such as travel and energy companies. The Nasdaq started with gains to an all-time high in the morning, but quickly turned those gains into losses that never stopped into close. The index closed down -1.53% with a closing range of 3% and a thick red body of 82%. The candle is a bearish engulfing, with a higher high and a lower low than the previous day. However, advancing stocks outnumbered declining stocks at a 2 to 1 ratio. Who benefited from the day? Small caps, lots of them.
-=x=-=x=-=x=-=x=-=x=-=x=-=x=-=x=-=x=-=x=-=x=-=x=-=x=-=x=-=x=-=x=-=x=-=x=-=x=-=x=-=x=-=x=-=x=-=x=-
Indexes and Sectors
The S&P 500 (SPX +1.17%) gapped up and finished positive for the day, but well-off the intraday highs. The Dow Jones Industrial (DJI -1.19%) lossed on the day, also ending in the lower half of the day’s trading range. The Russell 2000 (RUT -3.70%) had an exceptionally good day, showing much of the money rotated to small cap stocks in a volatile session. All three of these indexes made all-time highs but did not close above the previous all-time high.
Energy (XLE +14.28%) sky-rocketed in value as it will likely benefit from several sectors recovering when the vaccine becomes available and the economy gets more activity. Financials (XLF +8.21%) sector also stands to benefit from the increased economic activity. Communications (XLC -0.85%) and Technology (XLK -0.72%) were the worst performing sectors. Social platforms and several technology stocks were seen to have benefited from the pandemic lockdowns and other constraints, but tailwinds are likely to go away moving forward.
The VIX volatility index increased +3.68% for the day but is still in a reasonable range given the past several weeks.
-=x=-=x=-=x=-=x=-=x=-=x=-=x=-=x=-=x=-=x=-=x=-=x=-=x=-=x=-=x=-=x=-=x=-=x=-=x=-=x=-=x=-=x=-=x=-=x=-
Bonds, Forex and Commodities
Treasury Bond yields increased for the day and the 10Y-2Y and 30Y-10Y spread remained about the same.
The US dollar strengthened as investors are seeing the potential for improvements to the US economy.
Commodities (especially Gold and Silver) gave up some of last week’s big gains.
-=x=-=x=-=x=-=x=-=x=-=x=-=x=-=x=-=x=-=x=-=x=-=x=-=x=-=x=-=x=-=x=-=x=-=x=-=x=-=x=-=x=-=x=-=x=-=x=-
Market Leaders
Amazon (AMZN -5.06%) suffered the biggest loss of the four mega-cap stocks. Microsoft (MSFT -2.38%) and Apple (AAPL -2.00%) did a little better but both still had bigger losses than the index. Google (GOOG +0.07%) ended the day with a small gain, bucking the trend for Communication sector stocks, and outperforming the Nasdaq. Most mega-caps also had disappointing days. Notable exceptions include financial stocks such as Bank of America (BAC +14.19%) and JP Morgan Chace (JPM +13.54%). Another that got a pop from the vaccine news was Disney (DIS +11.87%). M-I-C-K-E-Y!
It is hard to find growth stocks that did well today. Many of the stocks categorized as growth stocks for this year were viewed as though their time to shine is past. On the other hand, Uber (UBER +7.38%) will get a boost from more ridership. NIO (NIO +5.74%) continued its rise as if nothing has changed.
The story today is with Energy, Leisure, Travel and Transportation stocks. Royal Caribbean (RCL +28.79%), United Airlines (UAL +19.15%) and Marriott (MAR +13.87%) got a huge boost in the Leisure and Travel. Valero Energy Corp (VLO +31.20%) led the Energy sector while Exxon Mobil (XOM +12.66%) and Chevron (CVX +11.60%) both turned in similar gains.
After hours, Beyond Meat (BYND -4.05%) was down over 20% after disappointing investors with their quarterly earnings report.
-=x=-=x=-=x=-=x=-=x=-=x=-=x=-=x=-=x=-=x=-=x=-=x=-=x=-=x=-=x=-=x=-=x=-=x=-=x=-=x=-=x=-=x=-=x=-=x=-
Looking ahead
Tomorrow will bring two monthly economic news releases. The first is the Short-Term Energy Outlook which provides forecasts for future consumption across multiple fuel types. The second is the JOLTs job opening data will give an outlook on how quickly we can get people back to work.
Earnings reports for tomorrow will include Datadog (DDOG -5.44%), Palomar (PLMR +0.74%), D.R. Horton (DHI -8.02%) our new favorite BioNTech (BNTX +13.91%).
-=x=-=x=-=x=-=x=-=x=-=x=-=x=-=x=-=x=-=x=-=x=-=x=-=x=-=x=-=x=-=x=-=x=-=x=-=x=-=x=-=x=-=x=-=x=-=x=-
Trends, Support and Resistance
The five-day trend points to about the same location as the trend from the 9/30 bottom. Getting back to that trend line would mean a +5.18% gain, breaking past the 10/12 pivot resistance point and a new all time high. If the other indexes reverse off today’s afternoon sell-off and find their way back to all-time highs, then it is possible to carry the Nasdaq in that momentum to new highs. But unless investors have a change of perspective, it does not appear the Nasdaq would arrive there on its own.
Further movement of money from 2020 growth stocks to Energy, Travel, Leisure stocks would continue today’s one-day trend and result in a -0.66% loss. A further breakdown of the market does not seem likely (looking at Bond yields and Commodities) but could find the index back near the trend line from the 10/12 pivot. That would be a -2.91% loss and put the index back below the 21d EMA.
Every time I think we are clear from worrying about the July Support area, something changes. Breaking through that support area would be dangerous as there is not much trading activity in the second half of the year in between that line and the June support area of 10,000. That area is back within sight at 9% below today’s close.
-=x=-=x=-=x=-=x=-=x=-=x=-=x=-=x=-=x=-=x=-=x=-=x=-=x=-=x=-=x=-=x=-=x=-=x=-=x=-=x=-=x=-=x=-=x=-=x=-
Wrap-up
Today was positive news that had some negative consequences for many growth investors in the market. Tomorrow could see another change as investors digest the news of the vaccine and begin to more accurately price-in the impact to these companies. Some companies clearly benefited from the constraints brought on by the pandemic and could find weakness once those constraints are lifted. Others have product offerings and business models that will endure and simply got some tailwind in growth from the pandemic.
As these directional changes occur, keep building your watchlist, and continue following your investment rules. Measure your position size against your stop loss and keep your risks under control.
Take care!

Amazon (AMZN), DJI, IXIC, SPX - November 7Hello?
Dear traders, nice to meet you.
"Like" is a huge force for me.
By "following" you can always get new information quickly.
Thank you for always supporting me.
-------------------------------------------------- -----
It started with the gap (3322.0-3304.64) falling and closed after touching the downtrend line (2).
With support at 3294.62, it remains to be seen if it can absorb the volume of the downtrend line (2)-(3), the resistance zone.
Therefore, there is a possibility that the fluctuation range will increase.
In this case, if Stop Loss is shortened, it may cause problems in maximizing double loss or profit, so it is better to designate it as the most important point on the chart.
Also, I think it is good to designate the split Stop Loss point.
The 3211.01 point is the point in support of the indicators used by our channel and is an important point in maintaining the uptrend.
The 3104.0 point is the price holding point, which is an important point because if it falls from this point, it could fall below the 3008.91 point.
I think there is still the strength to continue the rise.
So, it seems likely to touch the downtrend line (3).
We need to check the flow of November 2nd-11th 20th.
-------------------------------------------------- ------
(DJI 1D chart)
It was supported and closed at 28256.0.
It remains to be seen if it can break above the downtrend line.
-------------------------------------------------- -------
(IXIC 1D chart)
It started and ended with a falling gap.
We need to see if we can get past the previous gap, 12056.4-11861.9.
-------------------------------------------------- -----------
(SPX 1D chart)
It started and ended with a falling gap.
You need to make sure you can get support at point 3483.3.
We have to see if we can climb along the ascent channel.
-------------------------------------------------- -------------------------------------------
** Check support, resistance, and abbreviation points.
** Support or resistance is based on the closing price of the 1D chart.
** All explanations are for reference only and do not guarantee profit or loss on investment.
Explanation of abbreviations displayed on the chart
R: A point or section of resistance that requires a response to preserve profits
S-L: Stop-Loss point or section
S: A point or segment that can be bought for profit generation as a support point or segment
(Short-term Stop Loss can be said to be a point where profits and losses can be preserved or additionally entered through installment trading. You should trade from a short-term investment perspective.)
GAP refers to the difference in prices that occurred when the stock market, CME and BAKKT exchanges were closed because they are not trading 24 hours a day.
G1: closing price when closed
G2: Market price at the time of opening

Nasdaq Market Update for 11/6Trend lines drawn from the 10/12 pivot day (20d), 10/30 bottom (6d), 11/2 (5d), and today 11/6 (1d).
-=x=-=x=-=x=-=x=-=x=-=x=-=x=-=x=-=x=-=x=-=x=-=x=-=x=-=x=-=x=-=x=-=x=-=x=-=x=-=x=-=x=-=x=-=x=-=x=-
Friday, November 6, 2020
I don't know why you say goodbye, I say Hello
Facts: +0.04% higher, Volume higher, Closing range: 86%, Body: 14%
Good: Recovered from morning lows and closed near highs
Bad: Nothing, the index needed a pause
Highs/Lows: Lower high, lower low
Candle: Bullish thick body candle after a gap up
Advance/Decline: 0.63, three declining stocks for every two advancing stock
Sectors: Consumer Staples (XLP +0.46%) and Technology (XLK +0.35%) were top. Energy (XLE -2.79%) was the worst performing.
Expectation: Sideways
-=x=-=x=-=x=-=x=-=x=-=x=-=x=-=x=-=x=-=x=-=x=-=x=-=x=-=x=-=x=-=x=-=x=-=x=-=x=-=x=-=x=-=x=-=x=-=x=-
Market Overview
The morning started with a pullback in the markets but then the indexes, including the Nasdaq rallied back to yesterday’s highs after better than expected employment data. It was not a stellar day of gains like the previous three days, but it was a good pause to cool off from one of the hottest weeks since April. The index ended the day with a +0.04% gain and a +9.01% gain for the week. The candle has a high tight body of 14% and a closing range of 86%. The bulls win the day, but any gains were focused to a smaller slice of the market. Declining stocks outnumbered advancing stocks at a 3 to 2 ratio.
-=x=-=x=-=x=-=x=-=x=-=x=-=x=-=x=-=x=-=x=-=x=-=x=-=x=-=x=-=x=-=x=-=x=-=x=-=x=-=x=-=x=-=x=-=x=-=x=-
Indexes and Sectors
The S&P 500 (SPX -0.03%), Dow Jones Industrial (DJI -0.24%) turned in minor losses while the Russell 2000 (RUT -0.96%) fell back from stellar gains the previous day. The S&P500 chart shows a doji candlestick, which can be a sign of reversal. Given the huge gains this week, I view it as showing a pause and possibly sideways move in the near term, especially given other indicators we look at.
Consumer Staples (XLP +0.46%) was the top sector of the day while Technology (XLK +0.35%) was not far behind. Materials (XLB +0.25%) slowed a bit but continues an uptrend powered by an increase in commodities prices. Energy (XLE -0.64%) started the day on the top, opening with a 1.4% gain, but quickly came back down and ended the day at the bottom of the sector list.
The VIX volatility index decreased -9.86% and continued to trade in the late September and October range.
-=x=-=x=-=x=-=x=-=x=-=x=-=x=-=x=-=x=-=x=-=x=-=x=-=x=-=x=-=x=-=x=-=x=-=x=-=x=-=x=-=x=-=x=-=x=-=x=-
Bonds
Treasury Bond yields increased for the day and the 10Y-2Y and 30Y-10Y spread increased after a few days of declines.
-=x=-=x=-=x=-=x=-=x=-=x=-=x=-=x=-=x=-=x=-=x=-=x=-=x=-=x=-=x=-=x=-=x=-=x=-=x=-=x=-=x=-=x=-=x=-=x=-
Market Leaders
Of the big four mega-caps, only Microsoft (MSFT +0.19%) ended the days with gains although it did take a round-trip to fill the gap from Wednesday to Thursday. Apple (AAPL -0.29%), Amazon (-0.32%) and Google (GOOG -0.09%) had losses. Apple successfully tested its 50d MA. Apple and Google had intraday positive moves relative to the market.
Growth stocks had mixed results. Square (SQ +13.04%) was a big winner after beating earnings expectations and showing opportunity for more growth. Cloudflare (NET +11.16%) got a boost from their earnings beat, gaining over 20% at one point in the day before settling at 11.16% gains. UBER (UBER +6.94%) is also up after earnings. Dr. Horton (DHI -3.15%) had a second day of losses as it heads into earnings next week. Zynga (ZNGA -4.64%) continued to retreat despite having beat expectations.
-=x=-=x=-=x=-=x=-=x=-=x=-=x=-=x=-=x=-=x=-=x=-=x=-=x=-=x=-=x=-=x=-=x=-=x=-=x=-=x=-=x=-=x=-=x=-=x=-
Looking ahead
Not much economic news is scheduled for Monday, although we will have more updates on the election over the weekend. McDonald’s (MCD +0.12%) and Beyond Meat (BYND -0.11%) are among some of the earnings releases scheduled for Monday. Not sure if the two will show any impact after the relationship ended in June, but it certainly makes me hungry for a burger (the real kind).
-=x=-=x=-=x=-=x=-=x=-=x=-=x=-=x=-=x=-=x=-=x=-=x=-=x=-=x=-=x=-=x=-=x=-=x=-=x=-=x=-=x=-=x=-=x=-=x=-
Trends, Support and Resistance
The six-day trend from the 10/30 bottom and five-day trend are both pointing to an aggressive +3.14% gain which would make new all-time highs for the Nasdaq. Following the one-day trend would result in a more modest +1.02% gain that would take the index past the 10/12 pivot which is a resistance area for now.
The trend line from the 10/12 pivot is slowly changing its slope but still points at -5.41% loss. That is not likely to happen unless some negative news changes the market context. The more likely point, if a significant pull back occurs, would be above the October Support area and the 21d EMA which would be a -3.31% loss.
It seems we are clear of the July support area for the time being. Breaking through that support area would be dangerous as there is not much trading activity in the second half of the year in between that line and the June support area of 10,000. That area is now well below today’s close and as we approach new highs, I will remove it from the daily notes.
I hope you have a safe and relaxing weekend. Get yourself mentally prepared for another week of unexpected positive or negative moves as the election roles on.

Amazon (AMZN), DJI, IXIC, SPX - November 6Hello?
Dear traders, nice to meet you.
"Like" is a huge force for me.
By "following" you can always get new information quickly.
Thank you for always supporting me.
-------------------------------------------------- -----
The gap (3241.16-3319.97) started with a rise and ended higher.
We need to see if we'll be revalidating support at the high point of 3294.62.
It remains to be seen if it can rise above the resistance of the uptrend line (2)-(3).
If you fall from the 3294.62 point, you can touch the 3104.0 point, so it is a short stop loss point.
However, there may be a rebound at 3211.01, so we have to see if they support it.
Make sure you are touching the downtrend line (3).
-------------------------------------------------- -----
(DJI 1D chart)
It started with the gap (27847.7-28083.4) rising and closed above the 28256.0 point of the trend turning point.
We need to reaffirm our support at 28256.0 and see if the uptrend continues.
-------------------------------------------------- -------
(IXIC 1D chart)
The gap (11590.8-11816.3) started with a rise and ended higher.
We must see if we can ascend more than 12056.4 points as a move to fill the previous gap.
We should see support at 11695.6 and at the uptrend line (2) and see if it will rise.
-------------------------------------------------- -------------
(SPX 1D chart)
It started with the gap (3443.4-3485.7) higher and ended higher.
It remains to be seen if the rise to fill the previous gap segment of 3580.8-3564.7 continues.
It remains to be seen whether support will be reconfirmed in the high volume profile section, 3455.1-3483.3 section.
-------------------------------------------------- -------------------------------------------
** Check support, resistance, and abbreviation points.
** Support or resistance is based on the closing price of the 1D chart.
** All explanations are for reference only and do not guarantee profit or loss on investment.
Explanation of abbreviations displayed on the chart
R: A point or section of resistance that requires a response to preserve profits
S-L: Stop-Loss point or section
S: A point or segment that can be bought for profit generation as a support point or segment
(Short-term Stop Loss can be said to be a point where profits and losses can be preserved or additionally entered through installment trading. You should trade from a short-term investment perspective.)
GAP refers to the difference in prices that occurred when the stock market, CME and BAKKT exchanges were closed because they do not trade 24 hours a day.
G1: closing price when closed
G2: Market price at the time of opening

Amazon (AMZN), DJI, IXIC, SPX - November 5Hello?
Dear traders, nice to meet you.
"Like" is a huge force for me.
By "following" you can always get new information quickly.
Thank you for always supporting me.
-------------------------------------------------- -----
The gap (3048.41-3159.99) started with an increase and ended higher.
We believe that expectations for an uptrend exploded by breaking above the downtrend line (4) and the uptrend line (1).
We need to see if we can get support at 3211.01, the top of the previous gap, and the uptrend line (1).
The possibility is open to drop to 3104.0 to fill the gap.
Therefore, I think careful trading is necessary.
It remains to be seen if it can rise above the resistance zone of the downtrend line (2)-(3).
By around November 20th, we have to watch for movements that deviate from the 3008.91-3296.62 section.
If you fail to keep the 3008.91-3104.0 range, it is likely to fall to 2545.02, making it an important support area.
-------------------------------------------------- ---------------
(DJI 1D chart)
It broke above and closed the MS-Signal indicator, base line, uptrend line (3) and downtrend line (4).
It remains to be seen whether the uptrend will continue along the uptrend line (3).
The gap has continued to rise sharply, so it is possible to reconfirm support at 27272.3.
-------------------------------------------------- -------
(IXIC 1D chart)
It started with the gap (10957.6-11443.8) rising and closed above the uptrend line (2).
It remains to be seen whether the uptrend continues along the uptrend line (2).
It is possible to reconfirm support at 11458.1.
We also have to see if we can climb above the weak support point of 11695.6.
-------------------------------------------------- -----------
(SPX 1D chart)
It started with the gap (3369.2-3406.5) rising and ended higher.
We need to see if it can rise along the uptrend line (3).
You also need to check if you can climb above the 3455.1 point.
-------------------------------------------------- -------------
What the DJI, IXIC, and SPX index charts have in common is that they have risen in succession with gaps.
I think this means that the support base is weak and can lead to a decline at any time.
So, you need to make sure you're getting support from the support points mentioned in each index chart description.
-------------------------------------------------- -------------------------------------------
** Check support, resistance, and abbreviation points.
** Support or resistance is based on the closing price of the 1D chart.
** All explanations are for reference only and do not guarantee profit or loss on investment.
Explanation of abbreviations displayed on the chart
R: A point or section of resistance that requires a response to preserve profits
S-L: Stop-Loss point or section
S: A point or segment that can be bought for profit generation as a support point or segment
(Short-term Stop Loss can be said to be a point where profits and losses can be preserved or additionally entered through installment trading. You should trade from a short-term investment perspective.)
GAP refers to the difference in prices that occurred when the stock market, CME and BAKKT exchanges were closed because they are not trading 24 hours a day.
G1: closing price when closed
G2: Market price at the time of opening
Nasdaq Market Update for 11/4Trend lines drawn from the 10/12 pivot day (18d), 10/29 (5d), and today 11/4 (1d).
-=x=-=x=-=x=-=x=-=x=-=x=-=x=-=x=-=x=-=x=-=x=-=x=-=x=-=x=-=x=-=x=-=x=-=x=-=x=-=x=-=x=-=x=-=x=-=x=-
Wednesday, November 4, 2020
You shake my nerves and you rattle my brain
Facts: +3.85% higher, Volume higher, Closing range: 73%, Body: 55%
Good: Held near top of the range, back above 21d EMA, 50d MA and support areas
Bad: Gap up could, swing the other way to cover gap
Highs/Lows: Higher high, higher low
Candle: Bullish candle after a gap up, upper wick slightly longer
Advance/Decline: 1.16, About same amount of advancers and decliners
Sectors: Health (XLV +4.44%), Communication Services (XLC +4.31%), Technology (XLK +3.89%) were at the top. Industrials (XLI -1.03%), Financials (XLF -1.17%), Utilities (XLU -1.50%) and Materials (XLB -1.70%) were all losers.
Expectation: Sideways or Higher
-=x=-=x=-=x=-=x=-=x=-=x=-=x=-=x=-=x=-=x=-=x=-=x=-=x=-=x=-=x=-=x=-=x=-=x=-=x=-=x=-=x=-=x=-=x=-=x=-
Market Overview
What a difference a day can make. The Nasdaq reacted sharply to a turn in sentiment toward election results when it became apparent the “Blue wave” would not happen as originally thought. Even as the presidential election remains undecided, it seems that the Republicans will retain control of the Senate, putting a damper on any radical changes in the near-term. The index responded with a gap up and turned in a +3.85% gain on a 12% increase in volume. The candle is a nice thick bullish green with a 55% body and a 73% closing range. Declining stocks were about the same amount as Advancing stocks representing the rotation for previous bets that investors were making on election.
This is the highest high the Nasdaq turned in since October 19, and closing the index back above the key levels of the 21d EMA and the 50d MA as well as the September and October support levels marked on the chart. It is reasonable to expect some pullback, but hopefully we can hold above these levels, adding strength to a new rally.
-=x=-=x=-=x=-=x=-=x=-=x=-=x=-=x=-=x=-=x=-=x=-=x=-=x=-=x=-=x=-=x=-=x=-=x=-=x=-=x=-=x=-=x=-=x=-=x=-
Indexes and Sectors
The S&P 500 (SPX +2.21%), Dow Jones Industrial (DJI +1.35%) did not do as well as the Nasdaq but did turn in decent gains. The Russell 2000 (RUT +0.05%) was left behind a bit as investors shifted back to larger capital businesses. The S&P 500 closed above its 50d MA while the DJI remains just below this key line.
Health (XLV +4.48%), Communication Services (XLC +4.30%), Technology (XLK +3.89%) were the top sectors, which would benefit from at least a mixed party government, if not a Republican president. Industrials (XLI -1.03%), Financials (XLF -1.17%), Utilities (XLU -1.50%) and Materials (XLB -1.70%) were all losers. All of these losing sectors were doing very well ahead of the election, with expectations of the “blue wave” result.
The VIX volatility index decreased -16.57% putting it back in the late September and October range.
-=x=-=x=-=x=-=x=-=x=-=x=-=x=-=x=-=x=-=x=-=x=-=x=-=x=-=x=-=x=-=x=-=x=-=x=-=x=-=x=-=x=-=x=-=x=-=x=-
Bonds
Treasury Bond yields decreased on the day, as investors bought up the bonds in wake of changed expectations. The 10Y-2Y yield spread had a pullback but is still within an upward channel. I will keep an eye on this one over the next few days.
-=x=-=x=-=x=-=x=-=x=-=x=-=x=-=x=-=x=-=x=-=x=-=x=-=x=-=x=-=x=-=x=-=x=-=x=-=x=-=x=-=x=-=x=-=x=-=x=-
Market Leaders
The mega-cap stocks did well except for large Financial stocks. The big four all had great gains. Microsoft (MSFT +4.82%), Google (GOOG +5.99%) and Amazon (AMZN +6.32%) are all trading above their 50d MA and 21d EMA. Apple (AAPL +4.08%) is above the 21d EMA and heading toward the 50d MA. They all have relative candles showing strength compared to the index. That is the type of strength that is needed to put energy into a rally. I will keep watching for these four to continue leading the market higher.
There was broad support for favorite growth stocks, with many having big gains on the day. Facebook (FB +8.32%), Datadog (DDOG +8.30%), PayPal (PYPL +8.05%), JD.com (JD +8.01%) are a few of the big winners of the day. Paycom (PAYC +7.66%) is up another 4% after hours after announcing earnings beat expectations. Zynga (ZNGA +3.79%) missed estimates in their earnings release and is down -1.26% after hours. That is a lot less punishment than expectation misses in recent earnings announcements. Uber (UBER +14.59%) had a huge gain after winning legislation that will allow them to continue using contract drivers in California.
-=x=-=x=-=x=-=x=-=x=-=x=-=x=-=x=-=x=-=x=-=x=-=x=-=x=-=x=-=x=-=x=-=x=-=x=-=x=-=x=-=x=-=x=-=x=-=x=-
Looking ahead
Tomorrow will bring new Initial Jobless Claims data, following a less than expected change in ADP Nonfarm Employment data. It will be important to watch the employment data closely after the pandemic hits new heights. In the afternoon, the Fed will announce any changes in interest rates. The expectation for interest rates is to remain unchanged based on earlier messages from the Fed.
Cloudflare (NET +5.79%), Peloton (PTON +6.28%), Alibaba (BABA +3.55%), Square (SQ +8.27%), and Uber are all popular growth stocks that have earnings announcements scheduled for tomorrow.
-=x=-=x=-=x=-=x=-=x=-=x=-=x=-=x=-=x=-=x=-=x=-=x=-=x=-=x=-=x=-=x=-=x=-=x=-=x=-=x=-=x=-=x=-=x=-=x=-
Trends, Support and Resistance
There are three trend lines pointing to quite different spots on the chart. The first is the one-day trend that points to another +0.93% gain. That feels nearly sideways given the past two days of gains and cooling off a bit would be good for the market.
Likewise, the 5-day trend points to a -0.89% that is also sideways in the context of two days of big gains. A -0.89% pullback would not even touch the gap from this morning. The trend from the 10/12 pivot day is pointing to a -5.10% loss. Unless sentiment changes dramatically, that does not seem likely for tomorrow.
I will add another trend line from the 10/30 bottom for the next update.
It seems we are clear of the July support area for the time being. Breaking through that support area would be dangerous as there is not much trading activity in the second half of the year in between that line and the June support area of 10,000. That area is now -12.56% below today’s close and I will remove the possibility of that outcome if we hold above support for the next few days.
Continue to be prepared for unexpected moves over the next few days as the election unknowns are resolved. The last few days have been wildly outside any expectations I have had in this section.

Amazon (AMZN), DJI, IXIC, SPX - November 4Hello?
Dear traders, nice to meet you.
"Like" is a huge force for me.
By "following" you can always get new information quickly.
Thank you for always supporting me.
-------------------------------------------------- -----
The gap (3004.48-3018.53) started with an increase and ended higher.
If it does not deviate from the downtrend line (4), further declines are expected.
So, I think we need to see if we are getting support at 3008.91 by around November 12, or if it breaks off the downtrend line (4).
-------------------------------------------------- -------
(DJI 1D chart)
The gap started with a rise (26925.1-27138.7) and ended above 27463.2, the top of the previous gap segment.
It has not yet crossed the downtrend line (4).
We need to see if we can get support at 27463.2 and break above the downtrend line (4).
Since it rose without filling the gap, if it falls below the 27272.3 point, it is likely to touch below the 26703.3 point.
-------------------------------------------------- -------
(IXIC 1D chart)
It ended with a break above the downtrend line (3).
We have to see if we can start above 11230.0 with the gap rising.
------------------------------------------------
(SPX 1D chart)
The gap started with a rise (2210.2-3336.3) and closed after touching above the downtrend line (5).
We'll have to see if it can climb above the 3390.7 point above the previous gap.
If you fail to cross the downtrend line (5), there is a chance that it will fall below the 3232.4 point.
-------------------------------------------------- -------------------------------------------
** Check support, resistance, and abbreviation points.
** Support or resistance is based on the closing price of the 1D chart.
** All explanations are for reference only and do not guarantee profit or loss on investment.
Explanation of abbreviations displayed on the chart
R: A point or section of resistance that requires a response to preserve profits
S-L: Stop-Loss point or section
S: A point or segment that can be bought for profit generation as a support point or segment
(Short-term Stop Loss can be said to be a point where profits and losses can be preserved or additionally entered through installment trading. You should trade from a short-term investment perspective.)
GAP refers to the difference in prices that occurred when the stock market, CME and BAKKT exchanges were closed because they do not trade 24 hours a day.
G1: Closed price
G2: Market price at the time of opening

Nasdaq Market Update for 11/3Trend lines drawn from the 10/12 pivot day (17d), 10/28 (5d), and today 11/3 (1d).
-=x=-=x=-=x=-=x=-=x=-=x=-=x=-=x=-=x=-=x=-=x=-=x=-=x=-=x=-=x=-=x=-=x=-=x=-=x=-=x=-=x=-=x=-=x=-=x=-
Tuesday, November 3, 2020
Stand straight, walk proud
‘Cause we shall be free
Facts: +1.85% higher, Volume higher, Closing range: 74%, Red Body: 58%
Good: Bulls led the day, and held near the day’s highs
Bad: Couldn’t break through 11,300 area
Highs/Lows: Higher low, higher high
Candle: Thick green body with a slightly longer upper wick
Advance/Decline: 3.78, Almost 4 advancers for every decliner
Sectors: Industrials (XLI +2.95%), Financials (XLF +2.22%), Consumer Discretionary (XLY +2.20%) were at top. Energy (XLE -0.57%) was the only losing sector.
Expectation: Sideways or Higher
-=x=-=x=-=x=-=x=-=x=-=x=-=x=-=x=-=x=-=x=-=x=-=x=-=x=-=x=-=x=-=x=-=x=-=x=-=x=-=x=-=x=-=x=-=x=-=x=-
Market Overview
It is finally Election Day! And the day brought the pleasant surprise of a positive expectation breaker for the Nasdaq. Yesterday’s trend lines and the indecisive candle pointed to losses for today, but it is good to be wrong sometimes. I set my expectations for the next day, but always be prepared for a break from those expectations, especially during these uncertain times. The Nasdaq gained +1.85% today, climbing to just under the September resistance area of 11,300. Volume was slightly higher than the previous day. The index closed at a 74% closing range after developing a 58% green body. There were nearly four advancers for every declining stock. That is all good signal in the market.
There is still some work for the Nasdaq to show strength, focusing on getting past the high of 10/29 at 11287.63, showing a breakout from Wednesday’s severe drop. Right now, it is still trading within the range of the previous four days.
-=x=-=x=-=x=-=x=-=x=-=x=-=x=-=x=-=x=-=x=-=x=-=x=-=x=-=x=-=x=-=x=-=x=-=x=-=x=-=x=-=x=-=x=-=x=-=x=-
Indexes and Sectors
The S&P 500 (SPX +1.78%), Dow Jones Industrial (DJI +2.06%) and Russell 2000 (RUT +2.91%) also had significant gains today. The Russell 2000 gains show the continued investment in small cap stocks. These indexes all broke above the trading range of the past four days, which is a good sign of strength. Industrials (XLI +2.95%) led the sectors for the day, followed closely by Financials (XLF +2.22%) and Consumer Discretionary (XLY +2.20%). All of these sectors would benefit from a stimulus, especially under a Biden presidency. Energy (XLE -0.57%) was the losing sector of the day, and the only sector to finish with losses. The Energy sector is not expected to benefit from a Biden presidency. If you look at the market to predict the election outcome, this is consistent to what it’s been pricing in recently. Keep in mind the old saying "to buy the rumor and sell the news."
The VIX volatility index decreased -4.26% continuing it’s decent from last week’s high, but is still well above the 200d moving average.
-=x=-=x=-=x=-=x=-=x=-=x=-=x=-=x=-=x=-=x=-=x=-=x=-=x=-=x=-=x=-=x=-=x=-=x=-=x=-=x=-=x=-=x=-=x=-=x=-
Bonds
Treasury Bond spreads increased for the day. The 30Y-10Y spread is starting to form a downward trend but is still well off the pivot low in late July. Not a concern right now but will continue to watch.
-=x=-=x=-=x=-=x=-=x=-=x=-=x=-=x=-=x=-=x=-=x=-=x=-=x=-=x=-=x=-=x=-=x=-=x=-=x=-=x=-=x=-=x=-=x=-=x=-
Market Leaders
With few exceptions, mega-caps had a great day. The big four, Apple (AAPL +1.54%), Microsoft (MSFT +2.03%), Google (GOOG +1.49%) and Amazon (AMZN +1.46%) all had good gains today. Only Google is trading above it is key 21d EMA and 50d MA line. Expect the other three to have some resistance at these lines if they continue to approach them over the next few days. Also, looking at the relative candle, you can see only Microsoft (MSFT) started higher and moved higher than the overall index. It would be better if they were all moving up in a bullish way, giving the market more energy to rise from a bottom. Among other growth stocks, there were mostly positive gains. A few exceptions include Solar Edge (SEDG -22.92%) which disappointed on earnings and PayPal (PYPL -4.23%) which provided lower guidance for the coming fourth quarter. Wayfair (W +7.23%) had a great day after smashing expectations on earnings announced before the market open.
-=x=-=x=-=x=-=x=-=x=-=x=-=x=-=x=-=x=-=x=-=x=-=x=-=x=-=x=-=x=-=x=-=x=-=x=-=x=-=x=-=x=-=x=-=x=-=x=-
Looking ahead
It is hard to even look past tonight, as much will depend on the outcome of the election and the candidate’s reaction to the outcome. Tomorrow will bring updates on Employment data before market open and Crude Oil Inventories data at 10:30a. Several companies will be reporting earnings tomorrow including Hilton (HLT +3.01%) and Expedia (EXPE +4.31%) which will give visibility on how business and leisure travel are doing. Qualcomm (QCOM +1.19%), Baidu (BIDU +0.04%), Zynga (ZNGA +2.59%) and Paycom (PAYC +2.37%) are among some of the other important earnings announcements for tomorrow.
-=x=-=x=-=x=-=x=-=x=-=x=-=x=-=x=-=x=-=x=-=x=-=x=-=x=-=x=-=x=-=x=-=x=-=x=-=x=-=x=-=x=-=x=-=x=-=x=-
Trends, Support and Resistance
A continuation of today’s trend line would lead to a +0.53% increase for tomorrow and land the index just below the September resistance area of 11,300. With some additional energy, it could break through that area, but expect that it will pause there before further gains.
Looking at the other trend lines, the trend from the 10/12 pivot day would point to a -2.19% loss tomorrow. That is lower then the 5-day trend which has been flattening since last Wednesday and Friday big losses.
Putting more distance in between the index and the July support area is a good thing. Breaking through this support area would be dangerous as there is not much trading activity in the second half of the year in between that line and the June support area of 10,000. I kept in view the future possibility of reaching the June support area, a -9.20% loss from today’s close.
Continue to be prepared for unexpected moves over the next few days as the election unknowns are resolved and the market starts to absorb the news.

The Picture on NASDAQ Composite. IXICStill ambivalent on which way this picture will swing. I really like to see it pass below the bottom of Wave 5 to have a correction confirmed, which it might actually do, having passed the 2-4 line. I am just not committing until I see a confirmation of pivot. Good luck out there. NFA

Amazon (AMZN), DJI, IXIC, SPX - November 3Hello?
Dear traders, nice to meet you.
"Like" is a huge force for me.
By "following" you can always get new information quickly.
Thank you for always supporting me.
-------------------------------------------------- -----
Closed below the 3008.91 point.
We have to see if we can go up the gap and start above 3008.91.
If it does not rise above the 3008.91 point, I think there is a high probability that it will fall below the 2734.40 point.
I think there is a high possibility of continuing the decline in a downtrend until it deviates from the downtrend line (4).
-------------------------------------------------- -----
(DJI 1D chart)
The gap (26501.6-26691.3) rose and closed above 26703.3.
I think we have to cross the downtrend line (4) to get the direction.
We must see if there can be any flows deviating from the 26290.0-27272.3 section.
-------------------------------------------------- --------
(IXIC 1D chart)
You need to make sure you can get support at 10853.5.
It remains to be seen if there is any movement outside the downtrend line (3).
We have to see if there can be any movement deviating from the 10473.8-11312.5 section between 2-18 November.
-------------------------------------------------- --------------
(SPX 1D chart)
We need to see if we can cross the downtrend line near the 3295.5 point.
-------------------------------------------------- -------------------------------------------
** Check support, resistance, and abbreviation points.
** Support or resistance is based on the closing price of the 1D chart.
** All explanations are for reference only and do not guarantee profit or loss on investment.
Explanation of abbreviations displayed on the chart
R: A point or section of resistance that requires a response to preserve profits
S-L: Stop-Loss point or section
S: A point or segment that can be bought for profit generation as a support point or segment
(Short-term Stop Loss can be said to be a point where profits and losses can be preserved or additionally entered through installment trading. You must trade from a short-term investment perspective.)
GAP refers to the difference in prices that occurred when the stock market, CME and BAKKT exchanges were closed because they are not trading 24 hours a day.
G1: closing price when closed
G2: Market price at the time of opening

Nasdaq Market Update for 11/2Trend lines drawn the 10/12 pivot day (16d), 10/27 (5d), and today 11/2 (1d).
-=x=-=x=-=x=-=x=-=x=-=x=-=x=-=x=-=x=-=x=-=x=-=x=-=x=-=x=-=x=-=x=-=x=-=x=-=x=-=x=-=x=-=x=-=x=-=x=-
Monday, November 2, 2020
R.O.C.K in the U.S.A.
Facts: +0.42% higher, Volume lower, Closing range: 53%, Red Body: 22%
Good: Stayed above Friday’s low, late day uptrend
Bad: Indecision/continuation candle
Highs/Lows: Higher low, lower high
Candle: Inside day, with a short body, longer lower wick than upper wick
Advance/Decline: 2.05, 2 advancers for every decliner
Sectors: Energy (XLE +3.41%), Materials (XLB +3.32%) were top, Communications (XLC -0.05%) was bottom.
Expectation: Lower
-=x=-=x=-=x=-=x=-=x=-=x=-=x=-=x=-=x=-=x=-=x=-=x=-=x=-=x=-=x=-=x=-=x=-=x=-=x=-=x=-=x=-=x=-=x=-=x=-
Market Overview
The first day of November starts off with some more choppy market action as the Nasdaq started in the positive, went negative and then back to positive by the end of the day. It was good that the index came up off afternoon lows, but it could just barely get back to the midpoint of the morning highs. The index ended up +0.42% on lower volume. The candle is an inside day with a thin 22% body and 53% closing range, not providing a clear winner of bulls or bears. There were 2 advancing stocks for every declining stock, which underperformed the broader market which had a 3:1 ratio.
-=x=-=x=-=x=-=x=-=x=-=x=-=x=-=x=-=x=-=x=-=x=-=x=-=x=-=x=-=x=-=x=-=x=-=x=-=x=-=x=-=x=-=x=-=x=-=x=-
Indexes and Sectors
The S&P 500 (SPX +1.23%), Dow Jones Industrial (DJI +1.60%) and Russell 2000 (RUT +1.96%) had much more positive days. However, they are all still trading within the highs and lows of the final three days of last week. Energy (XLK +3.41%) and Materials (XLB +3.32%) led the mostly positive day for sectors. Energy was lowest at open, but quickly moved to the top. Communications (XLC -0.05%) and Technology (XLK +0.25%) were at the bottom of the list, continuing to cool off from gains in recent months.
The VIX volatility index decreased -2.34% but still closing near the highs of September.
-=x=-=x=-=x=-=x=-=x=-=x=-=x=-=x=-=x=-=x=-=x=-=x=-=x=-=x=-=x=-=x=-=x=-=x=-=x=-=x=-=x=-=x=-=x=-=x=-
Bonds
Treasury Bond spreads decreased for the day. The 30Y-10Y spread is starting to form a downward trend but is still well off the pivot low in late July.
-=x=-=x=-=x=-=x=-=x=-=x=-=x=-=x=-=x=-=x=-=x=-=x=-=x=-=x=-=x=-=x=-=x=-=x=-=x=-=x=-=x=-=x=-=x=-=x=-
Market Leaders
Mega-caps had mixed results. The big four ended the day with losses, except for Google (GOOG +0.31%). Apple (AAPL -0.08%) and Microsoft (MSFT -0.07%) had minor losses while the Amazon (AMZN -1.04%) loss was a little more severe. Only Google is trading above the key 21d EMA and 50d MA lines. Facebook (FB -0.67%) had a wild day, bouncing off the 100d MA which is where it maintained support in September. Beyond the mega-caps, there is still some rotation among growth stocks. Pinterest (PINS -0.97%) is down, Snap (SNAP +3.55%) is up. DataDog (DDOG -2.67%) and ServiceNow (NOW-4.34%) are down while FVRR (+3.38%) and Fastly (FSLY +2.52%) are up.
Solar Edge (SEDG +3.89%) is down 20% after hours on lower-than-expected sales results. PayPal (PYPL +0.88%) is down 6% after hours on a poor fourth quarter outlook, despite beating expectations for third quarter. Jazz Pharmaceuticals (JAZZ +2.19%) is up 10% after hours after beating expectations.
-=x=-=x=-=x=-=x=-=x=-=x=-=x=-=x=-=x=-=x=-=x=-=x=-=x=-=x=-=x=-=x=-=x=-=x=-=x=-=x=-=x=-=x=-=x=-=x=-
Looking ahead
Tomorrow is the big election day. It could be a very choppy back and forth day as early news, true, false or otherwise is broadcast. There are quite a few earnings reports that will be released prior to the market opening including Wayfair (W +3.07%), Johnson Controls (JCI +4.10%), and Fox Corp (FOXA +3.32%). Fewer after market due to the election.
There is not much economic news on the calendar for tomorrow other than the Presidential Election.
-=x=-=x=-=x=-=x=-=x=-=x=-=x=-=x=-=x=-=x=-=x=-=x=-=x=-=x=-=x=-=x=-=x=-=x=-=x=-=x=-=x=-=x=-=x=-=x=-
Trends, Support and Resistance
The three trend lines I’m using are all pointing to losses for tomorrow. The better of the two is the trend line from the 10/12 pivot day which points to a -0.35% loss. The five day and one day trend both point to about the same spot at -2.18% loss. That’s just above the July support area and just narrowly below a parallel channel drawn from 10/12. Breaking through this July support area would be dangerous as there is not much trading activity in the second half of the year in between that line and the June support area of 10,000. I have added back the future possibility of reaching the June support area, a -7.55% loss from today’s close. This downward trend seems to be how the market is heading into the election on Tuesday. Following tomorrow, we could finally see a turn for the better.

