SPX, Now 13th Oct low is critical !Taking out 3806.91 minor high puts 13th Oct low (3491.58) in a critical position.
As explained in my previous publications, there was a chance for best case scenario and market bounce at 0.5 Retracement of rally after pandemic low and Bulls, Bottom fisher and Dip Buyers took the chance however, is this best case scenario going to happen? Bulls should pray for market to sustain last created low !
I showed two different yet possible scenarios on the chart:
On the left side of the chart ,shown in green, we have our best case scenario which calls for completion of an ABC form of correction. With yesterday's taking out 3806.91 minor high we have now a proof for termination of last down going wave which is labeled as wave C. If this is going to happen , SPX will see unbelievable upside targets. The key for this scenario is 3491.58 low. As far as index is above this low, market is safe for bulls.
On the right side of the chart, shown in red, we have our terrifying scenario which suggests painful targets for SPX. I am sure that you can see powerful resistances in this chart. Index is below 50,100 and 200 days moving average and also below major down trend line. I intentionally excluded these resistances from best case scenario chart to show how optimism can make us ignore what we should see. Is market able to break all these powerful resistances and continue it's way up to new ATH and unbelievable targets? If not, Market will see very unpleasant, terrifying painful targets.
Macroeconomics, War and energy crisis, Inflation and FED's series of rate hikes do not support best case scenario but market is crazy sometimes. For me and to be in safe side, breaking out mentioned resistances is necessary to be sure about market up trend.
Please keep this golden statement in mind :
" Sometimes best thing to do in market is doing nothing "
Good Luck.
Nasdaq Composite Index CFD

IXIC Potential For Bullish ContinuationLooking at the H4 chart, my overall bias for IXIC is bullish due to the current price being above the Ichimoku cloud, indicating a bullish market. Looking for a pullback buy entry at 10753.57, where the 38.2% Fibonacci line is. Stop loss will be at 10207.47, where the recent swing low is. Take profit will be at 11521.97, where the 50% Fibonacci line is.
Please be advised that the information presented on TradingView is provided to Vantage (‘Vantage Global Limited’, ‘we’) by a third-party provider (‘Everest Fortune Group’). Please be reminded that you are solely responsible for the trading decisions on your account. There is a very high degree of risk involved in trading. Any information and/or content is intended entirely for research, educational and informational purposes only and does not constitute investment or consultation advice or investment strategy. The information is not tailored to the investment needs of any specific person and therefore does not involve a consideration of any of the investment objectives, financial situation or needs of any viewer that may receive it. Kindly also note that past performance is not a reliable indicator of future results. Actual results may differ materially from those anticipated in forward-looking or past performance statements. We assume no liability as to the accuracy or completeness of any of the information and/or content provided herein and the Company cannot be held responsible for any omission, mistake nor for any loss or damage including without limitation to any loss of profit which may arise from reliance on any information supplied by Everest Fortune Group.

IXICHello, dear friends. I am in the view of a downward movement in the current situation, and whenever it happens, I will announce a definitive opinion about the second upward movement.

No pivot, no easing, only more rate hikes, and painYesterday, the central bank of the United States raised interest rates by 50 basis points. The FED’s chairman reiterated that the monetary policy is not accommodative enough and laid out a path for more increases, with the projection of interest rates above 5% in 2023. Additionally, Jerome Powell stated the FED would not start thinking about cutting rates until its goal of 2% inflation over time is achieved.
That is nothing new to us, as we dismissed the “pivot narrative” several times in the past months. Indeed, we stressed that the terminal rate would go much higher than initially expected and for much longer than originally thought. Unfortunately, we abandoned our price targets for QQQ one day before the meeting.
Despite that, we continue to be bearish on the stock market and maintain our price target for NQ1! at 10 000$. However, as for the QQQ, we will abstain from setting a new price target after the latest abandonment. We will update our thoughts on a new price target soon.
Illustration 1.01
Illustration 1.01 displays the daily chart of QQQ. Yellow arrows indicate fake breakouts above the resistance. Interestingly, the second breakout occurred similarly (meaning very quickly, driven by algorithms, and short-lived) to the first one, about which we expressed skepticism.
Technical analysis
Daily time frame = Neutral
Weekly time frame = Bearish
Illustration 1.02
For the past month, QQQ constituted a 5% trading range within which it has been moving. We do not expect another breakout to the upside. Contrarily, we expect a breakout below the support level, which will be very bearish.
Please feel free to express your ideas and thoughts in the comment section.
DISCLAIMER: This analysis is not intended to encourage any buying or selling of any particular securities. Furthermore, it should not be a basis for taking any trade action by an individual investor. Therefore, your own due diligence is highly advised before entering a trade.

The NASDAQ FractalWhile we are talking about the Bitcoin fractal / logistic curve, I decided to analyze the second bubbly candidate, NDQ/NDX.
The .com bubble was fast and extensive, so in retrospect it is easy to see that it was a big bubble. The 2008-2021 big-tech mania may not be apparent but if we just rescale the chart on the price axis (not date) we see that the 1994-2000 part is highly correlated to the 2015-2021 price action. This is the bubble part of the two growths.
The overlapping part is quite satisfactory in the way it moves together. Considering the simplistic method of analysis I did.
We should scale things down since growth follows a fibonacci movement, not a linear one. Nature forces each growth to be some golden ratio smaller than the previous one. Either we like it or not...
I drew a retracement from the 2000 peak to the 1994 beginning, and moved it to 2015 as a start.
The bubble part of the 2015-2021 growth is significantly lower when compared to the 1994-2000 growth. Do note that in both instances a 6 year period is analyzed. The decreased rate of change is apparent.
There are numerous comparisons one can make.
Again retracement is copied and moved, not rescaled in any way.
I always tried to find a peak in NDQ. It wasn't until I tried fitting the .com bubble to the today's bubble that everything made sense. The chart got completed on it's own. A theoretical peak in NDQ will be on the 1.618 ratio of the .com bubble. It is quite far from here but with this candle pattern it makes sense. I have basically copied the 1985-2022 period and pasted on 2006. As I said before, the chart is rescaled only on price. And would you like to know how much I ended up scaling the chart? By a factor of .618
Conclusion: NASDAQ has it in it's DNA. Periods of incredible gains and periods of painful losses. This year it significantly underperformed the other main indices.
For the near future, with so many new technologies coming, it wouldn't be extreme to witness another bubble after a painful drop. We are dependent on technology, so it's sector will gain.
Final note: Bubbles and their patterns can be incredible sometimes.
80 years apart, back then with pen and paper, in 2000 on computer screens. Yet the bubble peak is identical.
PS. It appears from the chart, in pure speculation that sometime in the future we will violate this important trendline. Perhaps in 2040's robots will overtake the world and we will abolish technology once and for all. Curiously, a while back I listened to a song titled 2042 by Active Member. It's in Greek so don't bother looking for it if you don't understand the language.
Tread lightly, for this is hallowed ground.
-Father Grigori

NASDAQ has long way from now on to go up!|Hello dears
After a while I'm back and I found that there isn't any good signal in Nasdaq going up.
Its according to monthly analysis .

SPX | Will this time be different?World on terror in 2001, world on Russia in 2022.
Sticky inflation, explosive dollar and a tech bubble.
And a housing crisis brewing? Not a recipe for success.
I don't understand why anyone would expect actual, long-term growth from this exact point.
The chart above shows something peculiar. We have bearishly tried to escape the ribbon and failed (for now?).
Also the recent peak occurred in the 1.272 extension of 2000 peak, to 2009 bottom. A brief blow-off top in Dec.21 killed any hope of further growth. We have tremendous resistance above us, are we up for the task? Do we have heaps of money or are we over-leveraged from the 2-year party we had?
Also look at this peculiar era. A linear channel that barely deviated from its course shaped the previous years. And now we lost all support. A long-term rising channel isn't very bullish for me. We have analyzed it with many many methods, that since the GFC we are experiencing RSI Divergence (RSI printing lower highs, price printing higher highs).
Tread lightly, for this is hallowed ground.
-Father Grigori
PS: I <3 HL2


Will the bulls return? NDX Strong trend line in green
I believe this is just a little bump in the road along a long bullrun for the Nasdaq
We are still along the trend line
Much higher we must go
Happy holidays friends

NDX Bull Idea - Third Touch Third touch along the lower trend line
Suggesting this third touch will act as a support point and led to another run higher than the previous high we have seen
Curved up channel drawn with the thick white line
Attaching another analysis further showing this bull theory

QQQ stays choppySince its recent peak on 15th November 2022, the price of QQQ drifted lower by about 4%. Currently, it trades for around 282$. We continue to be bearish on the Nasdaq 100 index and pay close attention to market developments. To support our bearish thesis, we would like to see QQQ continue to hold below the immediate support/resistance. Additionally, we would like to see a pick-up in volume accompanying a price decline. Contrarily, if QQQ breaks above the immediate support/resistance, it will be bullish.
As far as fundamental factors go, these support our bearish thesis on the macroeconomic level. The FED and other central banks are pursuing tighter economic conditions to beat high inflation, which will inadvertently slow down the economy even more. With that in mind, we dismiss that the primary downtrend has hit bottom. Accordingly, our price targets for QQQ stay at 280$ and 270$ (10 000$ for NQ1!).
Illustration 1.01
The setup we introduced recently remains valid.
Technical analysis - daily time frame
RSI, MACD, and Stochastic are neutral. DM+ and DM- are bullish. Overall, the daily time is neutral.
Technical analysis - weekly time frame
Stochastic points to the upside. MACD also points to the upside but stays in the bearish zone. RSI is neutral. DM+ and DM- are bearish. Overall, the weekly time frame is neutral.
Please feel free to express your ideas and thoughts in the comment section.
DISCLAIMER: This analysis is not intended to encourage any buying or selling of any particular securities. Furthermore, it should not be a basis for taking any trade action by an individual investor. Therefore, your own due diligence is highly advised before entering a trade.

Last Dip / Next Bull-Run / April 2023Zoom out to see the whole chart!
This spread graph displays Nasdaq/(Gold*Dollar). The benefits of such a spread graph are:
* Reduces fluctuations from gold or dollar
* Omits short-term/seasonal price changes of assets
The graph technically aligns with my DXY/USM2 analysis. USM2 being US Money Supply. The second spread graph portrays the same indication:
Check out my previous analyses to get a better understanding of spread graphs.
Thanks! :)

S&P 500 Price Action & Economic Data An overview of the market technical analysis from the major indices on the first day of the week prior to major economic data, the NFP. What will impact the market movement this week? We will be looking closely at the commodity market, bond yields, US Dollar and the Gold markets. We also touch on AMD stocks as our watchlist for this week.

Fundamental & Technical | BTC📉Bitcoin is currently testing a decisive resistance line (Zone 2).
Current existing factors influencing financial markets:
* Decreasing investors confidence
1. The continuance of recession-indicating economic reports
- A recession is expected (lastest FED + inflation rate reports)
2. Further war escalations
- Russia defaulting, economic allies are changing and higher % of GDP devoted in military sector.
3. Political uncertainty
- Boris Johnson resigning(UK)...
4. Natural diseases + disasters
- Covid 3rd/4th waves, extreme hot weather
1. FED Interest Rate decision on to be posted @ 18:00 on 2022-07-27. Current inflation reads at 9.1 (2022-07-13), beating the consensus (expected) inflation (8.8).
There is currently a lot of uncertainty over financial asset valuation. Worse economic statistics than predicted will likely imply our volatile digital assets will drop heavily once the interest rate decision is out(and if its hawkish).
2. Japan warns over Chinese and Russian increasing cooperation (economic & military).
Rising concerns for investors:
- Increasing number of involved countries (alliances)
- Lasting severity of war donations
- Rising war spending (2.5% of total GDP increase in UK)
3. Depending on the UK's new PM outcome, the country's fiscal(tax) policies may be on each extreme.
The candidates:
* Rishi Sunak vowing to increase taxes
* Penny Mordaunt would raise income tax thresholds for basic and middle-income earners. (Lowering tax revenue)
* Foreign Secretary Liz Truss mentions creating ''low tax, low regulation zones''. (Lowering tax rates)
4. Covid + Heat waves
- Extreme heat waves in Europe affecting productivity, trade, currency valuations and etc.
- Currently, Covid waves have a greater impact on LEDCs. Corruption, poor infrastructure, worse weather control(worsening symptoms severity) and fake vaccine passports may all contribute towards this fact.
Thereby, I believe a drop will occur to satisfy the market changes within the zone 2.
Risk/rewards ratio: 3.23
Open Short: 265.75M
Take Profit: 173.17M
Stop Loss: 293.74
Note: the graph is BTC/Gold. I will be posting an explanation for it's utility
Thanks for your time!
San:)

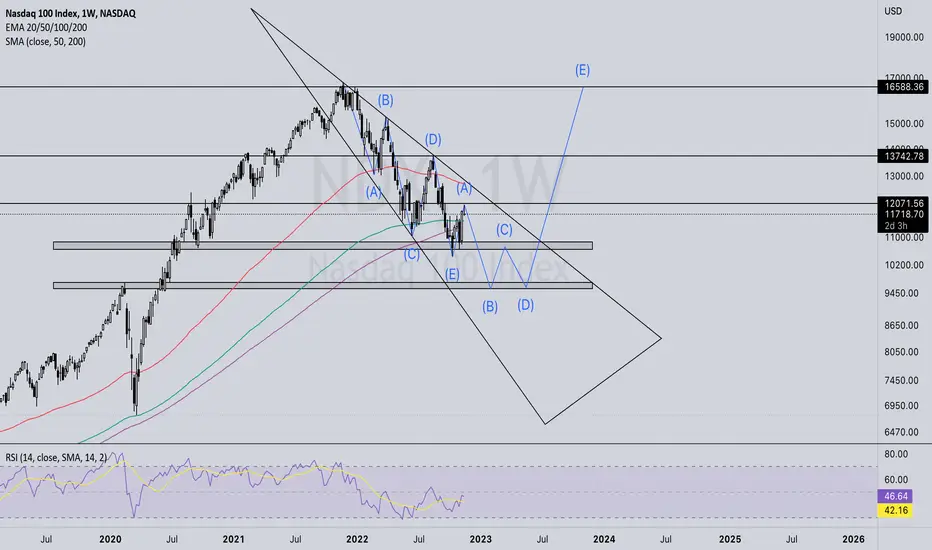
NDX 100 , NASDAQ ANALYSIS , 1 WEEKI shared Nasdaq 100 analysis with you
If the price does not close above 12000 $ in the weekly time frame
we can see a drop to the range of 9000 $ to 9500 $
Nasdaq 100 - Signs of exhaustionSince the latest CPI print NQ1! rose approximately 9%, with most of the move-up being manifested right after the release. The move was accompanied by high volume; however, on Friday and Monday, the volume declined substantially. This continuous decline in volume hints at exhaustion and potential reversal. Therefore, we remain very cautious.
To support our thesis, we would like to see a further slump in volume and the price going up. Then, we would like to see this followed by a spike in volume and the start of selling pressure. Contrarily, to invalidate our bearish thesis, we would like to see the price hold above 11 734$. Additionally, we would like to see the pick-up in volume accompanying a move higher.
On the endnote, we still believe this is only another bear market rally, and because of that, we stay bearish beyond the short term and stick to our price target for NQ1! at 10 000$.
Illustration 1.01
Since the latest CPI print, each session after the print manifested a declining volume from open to close. Yellow arrows indicate these developments on the chart.
Technical analysis - daily time frame
RSI, MACD, and Stochastic are all bullish. DM+ and DM- are bullish as well. Overall, the daily time frame is bullish, although the trend remains weak.
Technical analysis - weekly time frame
RSI and Stochastic point to the upside. MACD tries to reverse to the upside but stays in the bearish zone. DM+ and DM- are all bearish. Overall, the weekly time frame is less bearish than the last week.
Please feel free to express your ideas and thoughts in the comment section.
DISCLAIMER: This analysis is not intended to encourage any buying or selling of any particular securities. Furthermore, it should not be a basis for taking any trade action by an individual investor. Therefore, your own due diligence is highly advised before entering a trade.

NASDAQ DXY Timeline compared to DOTCOM BubbleThis is roughly where I think we are in this major bear market cycle.
The index is hovering around the 50 Month TEMA and the DXY is having in a large shorter term correction.
IMHO the market is vastly over-reacting to a single monthly CPI datapoint and there's a lot more pain yet to come.
I suspect strongly that the 100 and 200 Monthly TEMA are still in play over the next 12 months.

IXIC (NDX) Logarithmic Long Term Trend Line A long term trend line has been touched on the Nasdaq Composite
This has been seen as a point of great support extending all the way back to the 1980's
Price will likely bounce off this line and continue upwards
This is an addition to chart below, providing support

NDQ - My NASDAQ Outlook I have placed some bars patterns that show my current thoughts on the situation with the Nasdaq, it has been performing poorly on relative timeframes lately so I thought I would brighten it up a bit.
These bars patterns extend well above the dominant uptrend (observable on the log trend) and more accurately show the bubble we are currently in.
Big Bubble, big rise
If you are hodling stocks right now in my eyes you are comfy

1969, 53 years laterIt is like 1969, only exactly the same. (A quote Ashens would say)
Sticky inflation begins
Gold stagnating
Cheap oil, and then not that cheap
Space exploration
And the following years after 1969, look what happened to:
Inflation: Remained for 10 years
Gold: After a disappointing drop in 1969-1970, it exploded 19x until 1979.
Oil: Increased 10x until 1980
Space: We went on the moon several times, and then we lost the technology.
PS. There may be more similarities I am not aware of.
So what will happen now?
Exactly the same, all over again.
-- Stubborn inflation
-- Gold exploding (not bitcoin, they will ban this stuff and go all-out in CBDC. CBDC is like CBD only nothing like it. It is the dream of governments. They certainly encourage both of them. I don't post an opinion on CBD, I am just posting a joke.)
-- In a couple of years, we will see today's oil prices and actually want them. Now we obviously don't want them, it is like we are on sales and we just don't know it, yet...
-- We have apparently "landed" on a meteorite which is like exactly the same as in 1969 when we apparently landed on the moon. They like to make history repeat itself. If we find the technology we lost all these years ago (maybe Elon with a plethora of CBDC and CBD will find it). Maybe our bodies will go to Mars. Or more probably, we will take an AR experience to space, because that will save the planet.
Let's hope that in 8 years from now, we will not be in 1984. We are definitely stepping towards it.
(I know 1969+15 is 1984, and 2022+8 is 2030. Things are going much faster than 50 years ago.)
Tread lightly, for this is hallowed ground.
-Father Grigori
PS. Let's also hope that we don't meet up with Father Grigori, zombies or the combine.

IXIC - Long-awaited Bull signalComment :
1) IXIC has been fall more than 20% since previous peak on 16-Aug, bear signal appear next day from top. And today, it finally shows up Bull signal, indicating a short-term rebound. Short-term supporting price is lowest of 17-Oct that is 10569.69, this point must not be broke else the rebound will be ended.
2) TrendX+ indicator - candleestick moving below red trendline, mid-term downtrend underway.
3) DDX+ indicator - Bull signal shows up, looking forward a short-term long position.
4) MCDX+ indicator - weak, a little of banker bar (red), while retailer bar (turquoise) has occupy more than 50%.
Support & Resistance :
S : 10569.69 +/-
DISCLAIMER :
Analysis above SOLELY for case study purpose, not a PROFESSIONAL ADVISE. This analysis does not provide any trading advise and buy or sell. Trade at your own risk. Trade only after you have acknowledged and accepted the risks involved.

Nasdaq- What's Next?Been a while posting about Nasdaq composite index (or Nasdaq) so here is an update:
Fundamentals are scary as we all know.
Russians are preparing for a 'second round' of attacks on Kiev and no political solutions or a serious attempt is expected soon. It's a major issue for the global economy.
Time will be pushing Putin as well, trust me. So we might hopefully see the end of this soon but NOT yet... 😰🙏🌐
In the meantime the Dollar is killing all other currencies and that's an ice cream nobody likes to take. Unless you are Biden (www.hindustantimes.com) 🫥💩
European economy is flirting with a recession and protests arise (twitter.com) in France🇫🇷 (twitter.com)Italy🇮🇹Belgium🇧🇪Germany🇩🇪 and other countries. Europeans are getting pissed off...🤬
In the meantime in England Liz Truss (or short term expiring trash) (twitter.com) can not have a 'pivot' so there goes everyone else's hopium of seeing lower interest rates back that soon..
Donald Trump 🎃 is attempting a rebound of his own to 'Save America' this time (he made is great again the last time?) (www.dailymail.co.uk)
In the meantime we expect a new 75basis Rate hike by the Feds.
Finally, something we haven't seen before:
the Chinese postponed releasing their GDP (www.bloomberg.com) today. No reason offered!
In other words:
the Fundamentals are BAD 🙀 but regardless:
we always follow the chart!
Chart shows resistance at 11030-11043 and possible visit below the 10,000 mark to 9040 or even 8455
Not a good chart but things do change fast and will keep you posted.
One Love,
The FXPROFESSOR

SPX, What is going on the market ??Which Bull Cycle is market correcting?
Answer to this question shows us where MAY be a good point to buy the dip with open eyes and how to be prepared for alternative scenarios.
As shown and explained on the charts, there are three alternative scenarios for now and all of them are valid although they have different probabilities. :
1. Best case scenario :
In this very bullish scenario , market is just correcting the bull run started after pandemic low. In this case, we are not to much far from the SPX bottom. 3195 to 3505 corresponding to 0.618 and 0.5 Retracement levels is the zone in which SPX will bottom. I give least possibility to this scenario but surely keep it in mind since it is still a valid one.
2. Moderate case scenario :
In this scenario, SPX is correcting the bull cycle started at 60.96 on 1974 and ended at ATH. In this case, SPX will reach to very unpleasant and painful target zone which is 1878-2439 corresponding to 0.618 and 0.5 retracement levels respectively. I give most possibility to this scenario. Proofs and evidences for this scenario( and two others of course ) are provided on my published video idea about DJIA (See related idea for more details).
3. Worst case scenario :
In this scenario, market has completed 90 years impulsive section and mother of all crashes is on the way. I prefer to pray for the market in this case instead of any explanations. May GOD Bless The Market.
Maybe it is time to leave the habit of (( Buy the Dip )) with closed eyes.
Good luck every body.
