does anyone remember Dr Copper?here is my meaningful description. Dr copper is at a level, transports have rolled, and we have to wonder what banks are up to... SSS...
IYT

SPY head n shoulder formation we are at or near the end I am posting this chart at this time for what is good reason . The neg cycles from the spiral from 9/11/2001 is nov 3 but as stated we were closed until sept 21 and that is nov13 th so WHY am I going long Reason is the IYT dropped and held my line in the sand at 209.6 and that the DOW retraced to .786 to the tick . is that good enough to take the risk YES by Options and NOT futures .

$IYT Trend line SupportThe AMEX:IYT ETF, which is currently at a critical trend line support level. This pivotal juncture could very well influence the ETF's directional bias in the short to medium term.
For those looking at potential entry or exit points, this may present an ideal moment to reassess your positions and investment strategies involving $IYT. Trend line support levels often serve as crucial indicators for bullish or bearish market sentiment, and a confirmed break or bounce at this level could provide actionable insights for your trading decisions.

DOW TRANSPORTATION .50 % and 618% The wave structure can be counted as a wave 4 drop this would setup the last wave up from today as the setup for support is been seen today . and put call models are set and oil is setup to break from 93/95.5 back to under 84 /79 this would be supportive for the djt

$IYT IYT #IYT This level has LONG historyThis $200 range has a long history of solid support which used to once be heavy never-ending resistance. This should now be really strong support as shown today. That double bottom it created at the $197 range this afternoon should really be current Temp. support. I would expect ( not financial advice) a relief bounce from here. If and when the $200 level is lost ( $195 is the lowest i'd hold Stop) you'll find no support until $175 followed by $155.

ishares Trust iShares U.S. Transportation ETF (IYT)-Bullishishares Trust iShares U.S. Transportation ETF AMEX:IYT
I am bullish on IYT because I've identified a Bullish Harami pattern on the daily chart. Furthermore, we have several confluences on the MacD, RSI and volume indicators.
-The signal is crossing up like A.I. (Allen Iverson) on the MacD indicator
- The RSI indicator is pointing up
-The OBV indicator is displaying increasing volume
Peace & Prosperity,
Al
*******This is not financial advice**************This is not financial advice**************This is not financial advice*******

IYT Oversold and at supportTransports (IYT) ETF is oversold and at support. Biggest holdings are UPS and UNP. Something to watch next week.
GM is also almost oversold, might take a stab if MFI touches oversold next week. Double bottom maybe?

ODFL - Have we found support of the descending channel?Not sure, but it found Log chart parallel channel support.
Goodluck, earnings in about 15 sessions.

Transports weakening, an ominous sign for the markets?After making new highs in 2021, the transport ETF has failed to push to new highs on multiple occasions. This similar chart pattern also took place in 2008. There's an unfilled gap in the $148-152 level. That would be a logical target when/if this weakness continues. This is also a potential ominous sign for the overall markets if the 2008 playbook is repeating itself.....

TOP WAVE STRUCTURE I AM BEAHISH NOW IYT I have now moved to a net short in djt using IYT We have the etf forming a double top as the cash made a new high .This is very neg going forward FOR ALL INDEXES .USE PUTS FOR MARCH TO MID SUMMER AT THE MONEY

𝗧𝗿𝗮𝗻𝘀𝗽𝗼𝗿𝘁𝘀 𝗨𝗽𝗱𝗮𝘁𝗲: $DJT Daily. 🐂-ish DivergenceBullish divergence at bottom of channel. Possible run to start on false #DeltaVariant fears?
$TRAN $IYT $JETS $AAL $UAL $DAL $LUV $FDX $EXPE $BA $SPY $ES_F $VIX $DIA $DJI #Stocks #Transports 🛫

DOW moves to all time high of 37kBad news aside, IYT is what pushes the DOW to 37k. IYT got pummeled back in June losing alot of ground. Airlines and Railroads have finally found their footing, basing, and slowly climbing up this past week. IYT to 300 soon!

NSC - Ascending triangle, sector newsNSC - Ascending triangle, Rail sector news. Canadian Pacific Railway (CP) To Buy Kansas City Southern (KSU) In US$29 Bln Deal. NSC is forming an Ascending triangle on daily TF. There will only be 5 rail stocks left with a positive ROI, based on Finviz.com screener.

𝗧𝗿𝗮𝗻𝘀𝗽𝗼𝗿𝘁𝘀 𝗨𝗽𝗱𝗮𝘁𝗲: $DJT Weekly. False Breakout?Got the new highs, but a false breakout? If so, should revisit $10K or lower soon
$TRAN $IYT $FDX $AAL $UAL $DAL $LUV $EXPE $SPY $SPX $ES_F $VIX $DIA $DJI $YM_F #Stocks #Transports 🛫

Bullish Transports - Hidden Bullish Divergence (Monthly)MACD suggests a bullish breakout is underway with lots of energy to expend.
The cold hard Technical analysis is right there.

IYT Transport Golden cross continuation in septemberIYT Transport Golden cross on Aug 21, looking for continuation. You can see the accumulation candles in the chart. The top 4 holdings are FDX, UNP, NSC and KSU, which make up over 40% of ETF. Using seasonality charts, IYT in sept is up 2.5% the past 4 years.

𝗧𝗿𝗮𝗻𝘀𝗽𝗼𝗿𝘁𝘀 𝗨𝗽𝗱𝗮𝘁𝗲: $DJT Weekly. Re-cross GoldenDeath cross negated and re-crossed golden. No new highs, but that may be tested before pullback
$TRAN $IYT $AAL $UAL $DAL $LUV $EXPE $FDX $SPY $DIA $DJI $YM_F #Stocks #Transports 🛫

How go the transports, so goes the marketcomparing 45min chart of SPY and IYT...volume profile gives some support as to why the IYT is not recovering. there is no volume support at current prices, and holders mainly bought much higher...
SPY...it is at the point of supply...failed to get above it and is now grinding in a narrow range as the volume at this level fights for supremacy...I think the straight volume trend still in decline, compared to the increasing volume in the IYT shows that the price has not quite hit the stops or trigger point on SPY.
As the economic reality sets in, another month of missed payments, 2 looming bankruptcies (Hertz, JCrew), and unemployment on thursday...I'd expect some risk off trades ahead of the numbers, but with the fiscal stimulus fire hose on full blast...who knows...maybe people are placing bets for an in line number and thus irrationally exuberant push higher...As a small business owner, I just can't shake the sense that something profound has changed. In some ways for the better, but for the near term economic outlook it is decidedly negative.
Maybe not this week, but by this fall we will be trading sub 2400 on the SP500 and talking about the worst economic crisis in living memory.
Printing fiat will not fix this...It is a system of payments, the payments can't stop for more than 30days...let alone 60-90, before the system just fails...Don't believe me? Get long and watch.

Transportation Average & Small Cap Out-performanceInteresting relationship here
0.95 sixty week CC
IYT = 100% Industrials (obviosuly)
IWM = 16% Industrials
IYT = 45% Large cap, 45% Mid cap
IWM = 66% Small Cap, 15% Micro cap

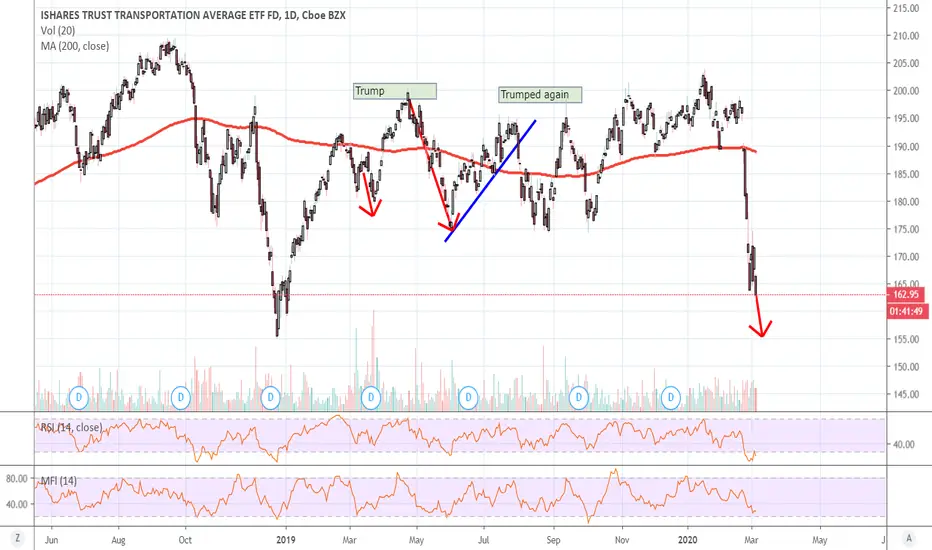
IYT - Transports look bearishTRansports look bearish as people cancel trips due to the virus. I don;t think we've seen the bottom yet...
Remember the Dow theory.....
𝗧𝗿𝗮𝗻𝘀𝗽𝗼𝗿𝘁𝘀 𝗨𝗽𝗱𝗮𝘁𝗲: $DJT Daily. Breaking Down200dma broke as has the 2019 uptrend. Huge red flag for markets. May DCB here near 10K

S&P Next Week Expected Move ($50.50)I continue to believe the risks are heavily skewed to the downside, a belief that has only strengthened as the Coronavirus's impact on the global economy has yet to show up in economic data.
Best of Luck Next Week:
- RH
_____________________________________________________________________________________________________________________________________
Baltic Dry Index offers the earliest indication:
tradingeconomics.com
Broad Overview of Coronavirus:
www.youtube.com
Fed Concerned:
www.bloomberg.com
Germany Industrial Production Worst in 11 Years:
tradingeconomics.com
______________________________________________________________________________________________________________________________________
Last Week:
Monthly USOIL:
Daily USOIL:
Chart Dump:

