HolderStat┆BNBUSD came out of the wedgeBINANCE:BNBUSDT just cleared a multi-week wedge resistance, signaling a bullish breakout above $635. The price is now poised to retest the upper channel boundary near $700–730. If bulls maintain momentum, this breakout could mirror prior impulsive legs higher, especially following similar consolidation patterns earlier this year.
J-BNB

BNB Price Today: Downtrend Ends As Bullish Momentum Strengthens
BNB is currently priced at $658 , showing resilience despite market volatility. However, it’s facing a micro downtrend this month. The positioning of the exponential moving averages (EMAs) below the candlestick indicates a potential bullish trend.
This pattern suggests that if BNB can maintain its current price, there could be an upward movement, making it a favorable outlook for investors despite the ongoing market uncertainty.
For BNB to regain bullish momentum, breaking free from the downtrend is key. A bounce off $646 support could help BNB target $667 , which has proven difficult since May.
The RSI remains above neutral, signaling growing buying pressure that could fuel the uptrend. A successful breach of $667 into support would confirm a more optimistic outlook for the coin.
If market conditions worsen, BNB risks dropping below the $646 support . In this scenario, the next levels of support at $628 and $615 would be tested.
A break below these levels could invalidate the bullish outlook, leading to further declines. Investors should stay alert to shifts in broader market sentiment.

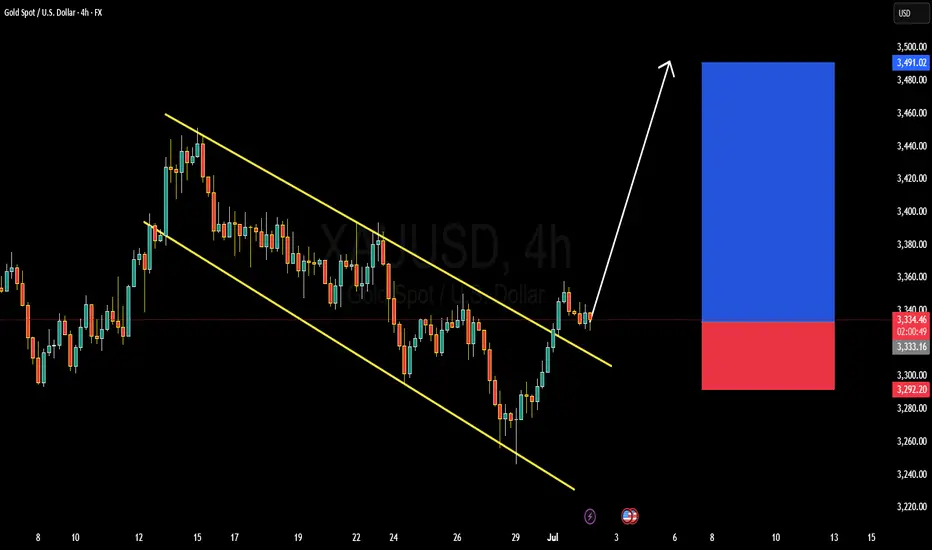
XAUUSD BULLISH OR BEARISH DETAILED ANALYSISXAUUSD has officially broken out of a well-structured descending channel on the 4H timeframe, suggesting a potential shift in market sentiment from bearish to bullish. After multiple rejections from the lower boundary and consistent pressure on the upper trendline, the breakout above the channel confirms a strong upside bias. Price is currently holding near 3330, and I’m now eyeing 3450 as the next key resistance level. This setup aligns perfectly with a textbook channel breakout, offering a solid risk-to-reward scenario for bullish continuation.
The breakout comes at a time when macro fundamentals are supportive of gold strength. With rising uncertainty surrounding global inflation trends and mixed economic signals from the US, investors are leaning back into gold as a defensive hedge. The US dollar has shown signs of softening amid increasing speculation that the Fed could pivot to a more neutral stance in the coming months. This gives gold more breathing room to the upside, especially as real yields begin to flatten out.
Geopolitical tensions, especially renewed volatility around global trade and Middle East developments, are further fueling demand for safe-haven assets like XAUUSD. The recent breakout is backed by rising volume and momentum indicators turning bullish, making this move more sustainable than a short-term spike. Gold typically thrives during periods of uncertainty and shifting rate expectations, and that’s exactly the phase we are entering now.
From a technical and macroeconomic perspective, gold is showing strength just as the broader markets begin to wobble. This breakout isn’t just about structure—it’s supported by real macro catalysts and seasonal demand strength. I'm bullish toward the 3450 zone, and any retest of the broken channel resistance now turned support would offer an attractive entry. Staying focused on gold as a top performer in Q3 could offer strong upside with controlled risk.
BNB/USDT 1D🕵️♂️ General context
• Steam: BNB/USDT
• Price: 649.52 USDT
• Time: 1D (daily interval)
• Currently, the reflection is underway after the inheritance, but the technical situation remains uncertain.
⸻
📈 Trend and market structure
• You can see a previous strong drop (visible long red candles).
• Currently, reflection is underway to the level of technical resistance (approx. 650–672 USDT).
• A medium -term inheritance trend is still in force - marked with an orange interrupted line of decreasing (inheritance) trend.
⸻
📊 Technical levels
🔹 Opora (green levels):
1. 651.01 USDT - the first tested resistance (current price right next to it).
2. 672.68 USDT - another resistance, above SMA (2), historically strong level of sales.
3. 700.81 USDT - strong psychological and technical level, tested in the past.
🔻 Support (red levels):
1. 636.40 USDT - short -term support (price maintaining just above this level).
2. 625.65 USDT - key support - if it is broken, a possible test of lower levels.
3. 607.62 and 595.27 USDT - subsequent support, where purchases appeared earlier (Long Knoty).
⸻
📉 Technical indicators
🔵 MacD
• Histogram comes out of red - a potential signal of Momentum change to upward.
• The MacD line begins to turn up to the signal line - possible Bullly Crossover soon (buy signal).
🟣 RSI
• RSI oscillates around line 40-50-it is a neutral zone with a slight tilt down, but RSI-Based has a possible reflection.
• Lack of purchase or sale - suggests that traffic can go both ways.
⸻
🔃 Medium walking (SMAS)
• The price is tested by several medium (green, red, blue line):
• SMA (1) and SMA (5) are similar and flat - no clear short -term trend.
• SMA (2) acts as a strong resistance at 672 USDT.
• Need to break out over 672.68 to recognize that the trend can turn around.
⸻
✅ Applications - technical scenarios
🔼 Bullish (upward) scenario:
• Crossing the level 651–672 USDT and closing the daily candle above.
• Confirmation by RSI> 50 and MacD crossover.
• Target: 700–710 USDT.
🔽 Bearish (inheritance) scenario:
• Price rejection with current resistance and descent below 636 → 625 USDT.
• If 625 falls, a possible drop in around 607/595 USDT.
• RSI may then fall into the sale zone.
⸻
🧠 Neutral / swing strategy
• Currently, the market in potential consolidation between 625 and 672 USDT.
• You can consider:
• Buying at the lower consolidation limit (625–636) with a stop-loss below 620.
• Short or Take Profit at the upper limit (670+) until it breaks out.

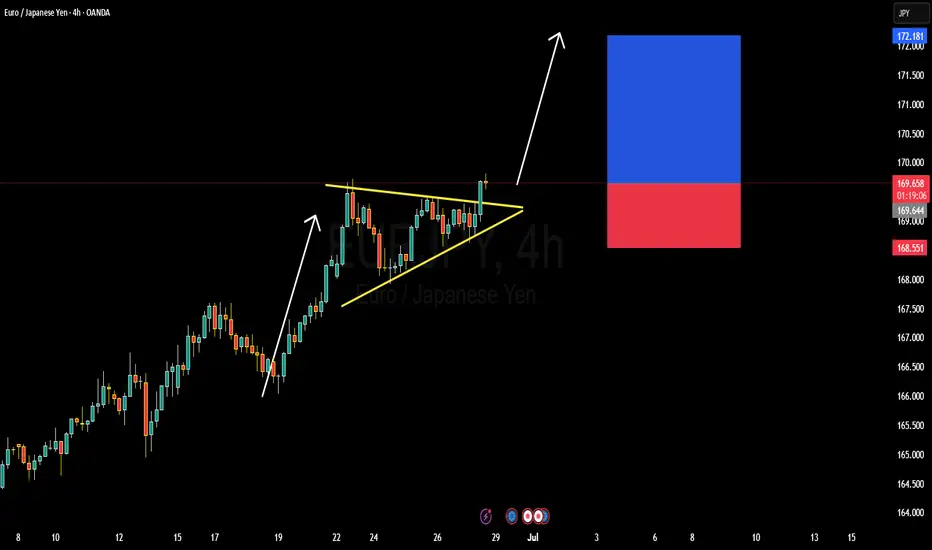
EURJPY BULLISH OR BEARISH DETAILED ANALYSISEURJPY has just broken out of a well-defined bullish pennant pattern on the 4H timeframe, confirming strong continuation potential to the upside. The price is currently hovering around 169.60 after consolidating in a tight structure, respecting both dynamic trendline support and horizontal resistance. This breakout signals renewed bullish momentum, and I'm now targeting the 172.10 zone as the next significant resistance level. The structure is clean, volume supported the breakout, and price action is aligned with the dominant uptrend.
Despite a relatively quiet start to the week—largely influenced by global risk-off sentiment surrounding Middle East tensions—EURJPY has held firm. Now that geopolitical jitters are easing slightly, yen weakness is resurfacing. The Bank of Japan remains firmly dovish, maintaining ultra-loose policy, while the Euro is supported by hawkish commentary from the ECB as inflation in the eurozone remains sticky. This divergence continues to fuel the long-term bullish bias for EURJPY.
Fundamentally, Japanese economic indicators remain soft, and there's still no clarity on when the BoJ will meaningfully shift policy. Meanwhile, EUR zone confidence indicators have stabilized, and speculation is growing around the ECB holding rates higher for longer into Q3. With widening yield differentials and a favorable risk sentiment return, this pair is positioned well for upside movement. Current momentum supports the probability of reaching the 172.00–172.10 area as risk appetite rebuilds across markets.
Technically and fundamentally aligned, EURJPY offers one of the strongest bullish continuation opportunities on the board right now. I will continue to monitor for minor dips as potential add-on areas, aiming for a full extension of the measured move from the pennant formation. Patience pays in setups like this where structure, sentiment, and macro all align.
HolderStat┆BNBUSD forming the falling wedgeBINANCE:BNBUSDT on the 8h chart rebounded from a falling wedge and reclaimed the $630 support. Price structure shows growing strength as it aims for $680 next. Watch for a breakout confirmation to ignite a push toward $740.

HolderStat┆BNBUSD retest of the channelBINANCE:BNBUSDT has completed a bullish reversal from the 633.4 level and is now testing upper trend resistance. A breakout from this wedge structure may lead to a rapid move toward the 680–700 region. Past triangle patterns have preceded strong rallies, and momentum indicators favor bulls. Traders will look for a breakout above 650 to confirm.

BNBUSDTPersonally, I see BNB struggling to break above that key resistance zone near 648–649. The rejection from that level, especially with decreasing momentum, makes me lean bearish in the short term. We’ve seen this zone hold back price before, and unless there's a strong breakout with volume, I think there's a higher chance we see a pullback toward the 616–618 area. I’m just watching price action closely and waiting for a clean confirmation—no need to rush a position when the structure’s already signaling hesitation.

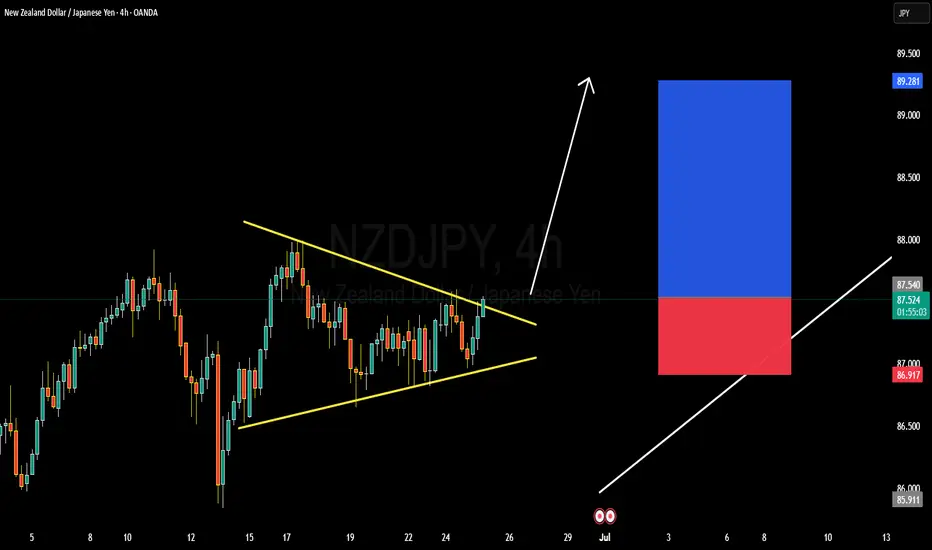
NZDJPY TECHNICAL AND FUNDAMENTALS DETAILED ANALYSISNZDJPY has just completed a bullish breakout from a well-defined symmetrical triangle on the 4H chart, confirming the start of a fresh impulsive move. Price action has broken cleanly above the descending trendline resistance around 87.400, supported by consecutive bullish candles with momentum. This breakout structure is signaling trend continuation, and I’m now targeting 89.500 as the next key resistance zone. The pair has also held higher lows consistently, showing strong bullish pressure in the medium term.
Fundamentally, the New Zealand Dollar remains supported by the Reserve Bank of New Zealand’s persistent hawkish stance. With the RBNZ maintaining higher interest rates to combat sticky domestic inflation, NZD has found strong backing in recent sessions. On the other hand, the Japanese Yen continues to weaken across the board, with the Bank of Japan maintaining ultra-loose monetary policy and no real signals of tightening. Japan’s latest inflation reading came in weaker than expected, further dimming any hawkish BOJ bets.
Today’s sentiment also reflects a global risk-on environment, with equities up and commodity-linked currencies like NZD benefiting. This reinforces bullish momentum in NZDJPY, especially as yield differentials between New Zealand and Japan favor carry trades. Technically, the pair could see brief pullbacks toward 87.100–86.900, which may offer fresh entries for bulls aiming to ride the breakout wave toward 89.500.
With technical confirmation, bullish momentum, and a supportive macro backdrop, NZDJPY looks well-positioned for further upside. I’ll be watching for sustained price action above the breakout zone, and any dips will be viewed as buying opportunities. The trend is up, and momentum is real—this is a textbook breakout setup aligned with both fundamentals and price action.
BNB Analysis (Crypto)Here is my analysis on BNB, the native token of Binance. I'll be using ICT concepts, primarily liquidity, efficiency, PD Arrays, and premium/discount/OTE.
Hope you find it insightful in knowing where price is going to go!
- R2F Trading

USDCAD DETAILED ANALYSISUSDCAD has formed a classic falling wedge pattern on the daily timeframe, with price currently pressing against the upper trendline resistance near 1.37300. This is a high-probability bullish reversal setup, and the pair is showing early signs of a potential breakout. The recent bullish momentum from the lows suggests buyers are stepping in aggressively, and if we get a strong daily close above the wedge, it could confirm the start of a new upward leg. My near-term target for this breakout is 1.47300, offering an excellent risk-reward profile.
From a fundamental perspective, the Canadian Dollar is currently under pressure due to weakening oil prices and softening domestic economic data. The Bank of Canada has recently signaled a dovish tilt following its latest rate cut in June, citing slower GDP growth and easing inflation. On the other hand, the US Dollar is finding renewed strength backed by sticky inflation and the Fed’s cautious stance on rate cuts. The divergence in monetary policy between the Fed and BoC is creating a favorable environment for USDCAD bulls.
Technically, the confluence of wedge resistance, bullish divergence on the RSI, and a clear higher low formation all point toward a breakout scenario. A break above 1.37600–1.38000 would unlock the next wave of bullish continuation, potentially accelerating momentum toward the 1.47 handle. This area also aligns with the previous March highs, making it a strong technical magnet.
I remain bullish on USDCAD and will be watching the breakout closely this week. If the pair holds above 1.36800 and breaks structure convincingly, I’ll be adding to longs on confirmation. The current setup presents a textbook breakout opportunity supported by strong fundamentals, technical structure, and market sentiment leaning in favor of the USD.

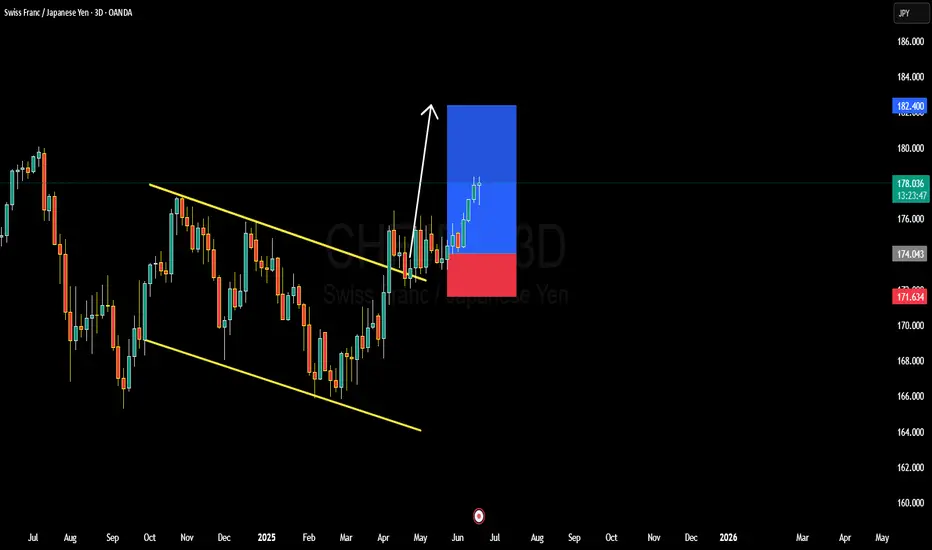
CHFJPY BULLISH OR BEARISH DETAILED ANALYSISCHFJPY has continued to play out exactly as forecasted, breaking out cleanly from the descending channel on the 3D timeframe and rallying strongly above key structure. Price is currently trading around 178.00, already delivering solid upside from the breakout zone. The bullish breakout was confirmed by consecutive impulsive candles with minimal retracement, a clear sign of institutional strength behind this move. As long as this momentum holds, the next major target is 182.00 – a psychological level and previous structure high, now acting as a magnetic zone for price.
On the fundamental side, the Swiss Franc continues to enjoy safe-haven flows as global macro uncertainty persists. The Swiss National Bank has maintained a relatively tight stance, with inflation staying stable and CHF demand picking up. On the flip side, the Japanese Yen remains broadly weak due to ultra-loose monetary policy from the Bank of Japan. BOJ’s reluctance to shift away from yield curve control and negative interest rates makes JPY one of the most attractive funding currencies, driving consistent CHFJPY upside.
Technically, this move is supported by a textbook breakout from a falling wedge pattern, which historically has a high probability of bullish continuation. The volume and momentum on the breakout were strong, and we have a clean higher high and higher low structure forming. This confirms the end of the correction phase and a transition into a trending bullish cycle. With the current risk sentiment leaning toward CHF strength and JPY weakness, I’m confident in further upside toward my 182.000 target.
I’ll continue to trail stops below 174.00 to lock in profit while giving the trade room to breathe. If price consolidates near 179.50–180.00 with low volume, I may look for re-entry setups on pullbacks. As of now, CHFJPY remains one of the strongest trending pairs on the board, and I’ll stay long as long as the structure holds.
HolderStat┆BNBUSD held supportKUCOIN:BNBUSDT keeps coiling inside a contracting wedge above the $639 launchpad. A 4-h close over 650-655 can spark a thrust to 680 and revive the 700–710 “new-high” box; slip-back under 630 delays the breakout but leaves the structure intact 🚀

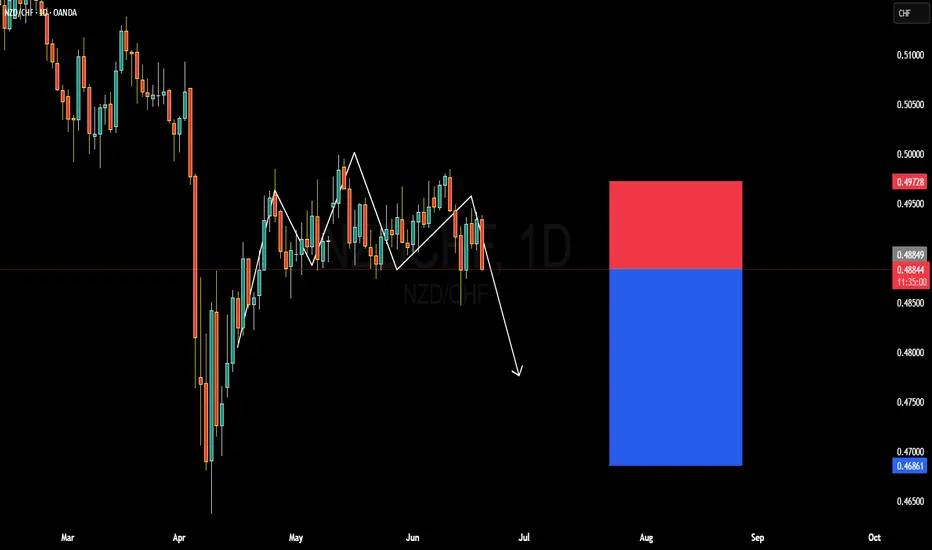
NZDCHF BULLISH OR BEARISH DETAILED ANALYSISNZDCHF is currently trading around the 0.4880–0.4900 zone, and on the daily timeframe, the pair appears to be completing an inverse head and shoulders pattern. However, unlike the typical bullish nature of this pattern, price has failed to break above the neckline and is showing early signs of bearish continuation. The right shoulder has already failed to create a higher high, and recent bearish candlesticks with strong wicks to the upside suggest rejection and downside momentum building. My short bias is supported by this structural weakness and loss of bullish steam.
From a fundamental perspective, the Swiss Franc remains strong due to its safe-haven demand amid lingering global risk aversion and slowing global growth expectations. The Reserve Bank of New Zealand, while on hold recently, has adopted a relatively dovish tone as domestic inflation trends soften. This diverging policy stance between the SNB and RBNZ provides a macroeconomic tailwind favoring CHF strength and NZD weakness. In today’s session, CHF also gained modestly following stronger-than-expected CPI revisions and cautious risk flows in the Asian and European sessions.
Technically, we’ve seen a clean break of the recent support zone near 0.4890, and the market structure has flipped bearish on both the daily and H4 charts. I expect further downside continuation toward the 0.4680–0.4700 range, especially if the current lower highs pattern persists. The bearish flag breakdown and consistent lower closes support continuation toward my 0.46 target. This offers a solid short setup with a favorable risk-reward ratio in play.
I’ll continue monitoring for any pullback toward the 0.4920–0.4950 area for potential re-entries on weakness. Momentum and volume indicators also point lower, aligning with the price action thesis. As long as we stay below 0.4970, the bearish scenario remains active, and I’m looking to capitalize on this developing bearish cycle in NZDCHF.
USOIL FUNDAMENTALS AND TECHNICALS USOIL (WTI Crude) is currently trading near the 72.00 level and is setting up for a potential breakout from a long-standing descending channel on the higher time frame (3D chart). Price has approached the upper boundary of this bearish channel after a strong bullish rally in recent sessions. This indicates growing bullish momentum, and any sustained breakout above the descending trendline could open the path toward the 98.00 zone, a major structural target based on previous price action and Fibonacci projections.
The recent bullish surge in crude oil prices has been fueled by a combination of supply-side constraints and renewed optimism around global demand. OPEC+ continues to show discipline in supply management, and geopolitical tensions in oil-producing regions are adding risk premiums. Furthermore, the Fed’s recent signals of a potential pause in tightening, combined with an improving outlook for Chinese demand recovery, are creating a supportive environment for commodities, particularly oil. These fundamental tailwinds align with the technical structure hinting at an upside breakout.
Technically, USOIL has broken back above a critical mid-channel support level and is now challenging the descending resistance line. The most recent impulsive candles suggest strong buyer conviction. If this momentum holds, we could see a retest followed by continuation toward the 98.00 psychological level. The structure also supports a higher low formation, which is another bullish signal for long-term traders watching the macro channel breakout.
From a trading standpoint, this setup is high probability with a well-defined invalidation zone below 65.00. The confluence of macro catalysts, technical breakout formation, and seasonal demand trends makes this a compelling bullish opportunity. I am closely monitoring price action for confirmation to go long on the breakout and ride the potential wave toward the upper supply region near 98.00.
U

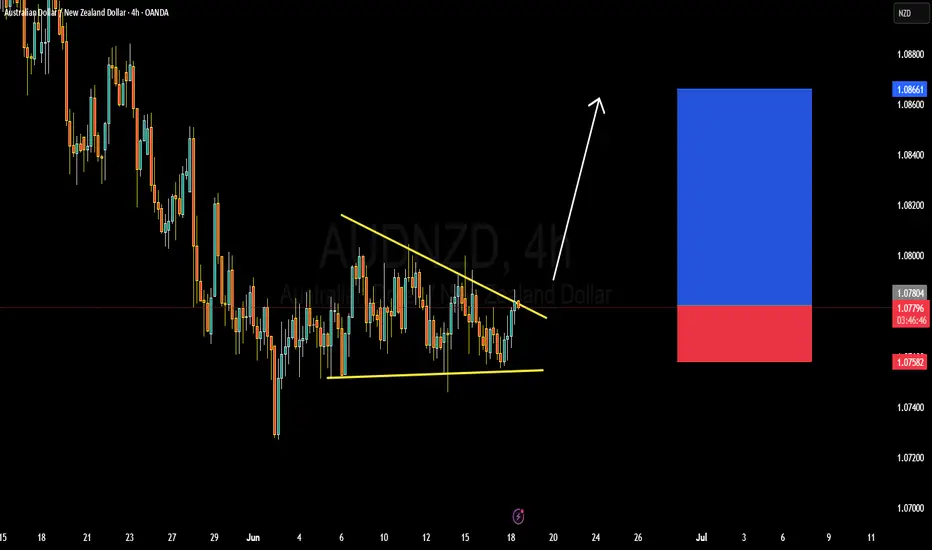
AUDNZD BULISH OR BEARISH DETAILED ANALYSISAUDNZD is currently trading around 1.078 and is on the verge of a classic falling wedge breakout, which is a bullish reversal pattern typically seen after a downtrend. Price action has been compressing within this wedge formation, suggesting an imminent breakout as market pressure builds. A decisive close above the descending trendline would be a powerful signal of bullish continuation, with a near-term upside target of 1.086. The structure has held multiple rejections at both resistance and support, highlighting strong accumulation behavior from institutional participants.
Fundamentally, the Australian dollar is gaining relative strength due to the Reserve Bank of Australia maintaining a hawkish tone, supported by persistent inflation and labor market resilience. In contrast, the Reserve Bank of New Zealand recently surprised the market by signaling a potential end to its hiking cycle, citing slower growth and inflation moderation. This divergence in monetary policy outlook is creating favorable conditions for AUDNZD bulls, particularly as global risk appetite improves and commodity-linked currencies gain traction.
Technically, this 4-hour chart pattern aligns perfectly with recent AUD strength across the board, particularly in pairs like AUDUSD and AUDJPY which have broken key resistance levels. The tight consolidation near the wedge’s upper boundary, coupled with bullish candlestick formations, suggests buyers are stepping in ahead of the breakout. With a clean invalidation below 1.075, the risk-reward ratio here is compelling, especially for momentum traders looking to catch an impulsive leg higher toward 1.086 and beyond.
This setup is high-conviction. AUDNZD is poised for a breakout that aligns with both technical and macro fundamentals. As a professional trader, I’m tracking this setup closely, and any confirmation candle above the trendline will trigger my entry. I expect bullish continuation in line with AUD’s broader strength and NZD’s underperformance.
BNB Pump???On the daily chart of BNB, a symmetrical triangle has formed, and the price is approaching a breakout point. The $600–$604 zone, aligned with the 200-day moving average and the descending trendline, acts as a key resistance. A bullish breakout could push the price toward the $696 area. On the downside, the $575 support is crucial — if broken, the next potential drop could target the $505 zone. Price compression and declining volatility suggest a strong move is likely soon.
📈 A major move is coming for BNB!
🔺 Resistance: $604
🔻 Support: $575 and then $505

HolderStat┆BNBUSD above the $650 levelBYBIT:BNBUSDT is squeezing above the 650 breakout shelf after a flag retest, turning consolidation into up-move renewal. Maintaining 640 trend support holds bias north; clearing 670 unlocks 710-730 and blue-sky talk 🚀

NZDJPY TECHNICALS AND FUNDAMENTALS DETAILED ANALYSISNZDJPY is currently trading around the 87.00 handle and has just bounced strongly from a well-respected support zone. The pair is now showing clear signs of recovery after a brief corrective dip, and price action on the 8H chart confirms a bullish reversal structure. The support held firmly, and we’ve already seen a solid rejection wick forming the foundation of this new impulsive leg up. With this momentum in play, I’m targeting the 90.00 zone in the coming sessions.
On the macro front, the New Zealand dollar is benefiting from a relatively hawkish RBNZ stance. Inflation pressures remain sticky in New Zealand, and the central bank has reiterated its cautious approach toward rate cuts. Meanwhile, the Japanese yen remains under persistent selling pressure due to the Bank of Japan's ultra-loose policy and intervention uncertainty. These diverging central bank outlooks are fueling continued upside in NZDJPY as carry trade flows remain in favor of the kiwi.
From a technical perspective, the market structure remains bullish. After retesting a previous higher low, price is climbing within a clean channel and has broken minor resistance levels convincingly. This aligns well with a swing continuation pattern toward the 90.00 mark. Momentum is supported by increasing bullish volume, and as long as we remain above 86.00, the bulls are firmly in control.
In my analysis, this is a textbook setup. We’re seeing higher lows, strong trend continuation, and a macro-backed directional bias. I’m long from 87.00 with a bullish outlook into 90.00. I’ll reassess price action as we approach major resistance levels, but until then, I remain confidently positioned with a clear technical and fundamental confluence.

XAUUSD BULLISH OR BEARISH DETAILED ANALYSISGold (XAUUSD) continues to maintain strong bullish momentum, with current price action sitting around 3,430. We have been holding a bullish outlook since the key accumulation zone between 3,150 and 3,200. Price has consistently formed higher highs and higher lows, and recent consolidation has broken out with conviction. Based on technical structure, my immediate upside target is 3,500, where I expect price to react before potentially extending even higher depending on upcoming macro drivers.
Fundamentally, gold is being fueled by a combination of sticky inflation data and a cautious Fed stance. Even though the FOMC held rates steady in June, market expectations are shifting towards policy easing later in the year due to softening labor data and a cooling economic outlook. Additionally, geopolitical uncertainties and continued central bank gold buying remain strong tailwinds for the metal. The U.S. dollar index has shown minor weakness post-CPI, offering further support to gold bulls.
Technically, the daily chart shows a clean bullish flag breakout that aligns with the trendline support and impulsive wave structure. Price broke above 3,400 with strong volume and minimal resistance, indicating clear bullish dominance. As long as price holds above the 3,380–3,400 zone, continuation toward 3,500 remains highly probable. There is also confluence from previous structure highs and minor Fibonacci extension levels around that mark.
Overall, I remain confidently long on XAUUSD. I’ve been tracking this bullish cycle since the 3,150–3,200 region and continue to favor upside moves backed by macroeconomic and technical alignment. I’ll be watching key reaction zones near 3,500 for potential profit-taking, while holding swing positions with dynamic risk management in place.

This isn’t a dump. It’s a delivery systemBNB sold off fast — but not irrationally. Look closer, and you’ll see the system at work: rejection from inefficiency, compression, and now a retest of where the last real buyers were found.
The structure:
Price swept short-term demand and wicked below local range lows with a high-volume rejection. That low was engineered — not failed.
Above us? A neatly layered series of 60-minute FVGs from 646.5 to 652.0. Every candle into that zone is a test. But the true objective is to reload short once that imbalance is filled.
Playbook:
We’re in a reactive zone now. Here’s what I’m watching:
Price pushes into the FVG cluster (646–650)
Volume dries → rejection wick → return to discounted re-entry
Aggressive scalpers might long the bounce into the FVG, but the higher-probability play is fading the inefficiency once it’s filled.
Execution:
Scalp long (optional): 643.5 → TP into 648–650
Main setup: short entry from 647.4–650.5
SL above 652.2
TP1: 640.5
TP2: 634.8
Final draw: 630.0 if structure accelerates
Patience is what separates the move from the moment.
Final thought:
“This move didn’t break structure. It exposed the next one.”

HolderStat┆BNBUSD broke the local resistanceCRYPTOCAP:BNB
→ Coils above rising support 630–640 under 680 wall
↳ Pop > 680 ignites sprint to 700–720 supply shelf
⇢ Lose 630 downgrades to 600–610 retest
⤴ Sub-600 invites 580 deeper pullback

BNB 1D Ready to Explode? This Chart Says YES. 06/12/25BINANCE:BNBUSDT is forming a tight consolidation right below key resistance at $710, inside a triangle structure. Every dip into the $655–$625 support zone gets quickly bought up — showing strong buyer interest and accumulation.
Price is compressing inside the triangle with higher lows, indicating bullish pressure. A breakout above $710 would likely trigger a strong move toward $770–$780, and potentially a new ATH > $800.
As long as $625 holds — I'm bullish. I expect one more sweep of support before an explosive breakout.
Spot/futures entries: $655–$625
Targets: $710 → $780 → $820+
Invalidation: Daily close below $625.
