NZDCAD BULLISH OR BEARISH DETAILED ANALYSIS ??NZDCAD is currently coiling within a textbook bullish flag formation after an aggressive impulsive leg to the upside. Price action remains tight inside this consolidation structure, respecting both trendline resistance and support. As we approach the apex of this flag, I’m closely watching for a breakout confirmation to trigger the next bullish continuation leg toward the 0.8600 target.
From a macro perspective, the New Zealand dollar is gaining strength following the RBNZ’s firm stance on keeping rates elevated due to persistent inflation risks, particularly in housing and services. On the flip side, the Canadian dollar is showing relative weakness as oil prices stall and the Bank of Canada shifts toward a more dovish tone amid weaker economic data and slowing consumer spending. This divergence in central bank policy and economic outlook is building a strong fundamental case for NZDCAD upside.
Technically, the structure remains clean. The market formed a strong bullish engulfing rally earlier in April, and since then has entered a symmetrical correction with higher lows forming under compression. This is a classic continuation setup with strong momentum buildup underneath. A breakout above the 0.8280–0.8300 zone with volume would likely trigger institutional interest and drive price rapidly toward the 0.8600 level, which aligns with the measured move of the flag.
This is a high-probability trade idea supported by both technical and fundamental convergence. With risk well-defined below 0.8135 and momentum favoring the bulls, NZDCAD is one of my top setups going into June. Breakout traders and swing traders alike should keep this pair on the radar as the next bullish expansion looks imminent.
J-BNB

BNBUSD aiming for $800 and that's only short-term.Binance Coin (BNBUSD) is staging a strong short-term push after holding its 1D MA200 (orange trend-line). This is taking place on the technical Bullish Leg of the 10-month Channel Up.
The 1W RSI broke above its MA trend-line (yellow) and that confirmed this new bullish structure. The previous Bullish Leg peaked a little over the 2.0 Fibonacci extension. Our short-term Target is therefore $800.
-------------------------------------------------------------------------------
** Please LIKE 👍, FOLLOW ✅, SHARE 🙌 and COMMENT ✍ if you enjoy this idea! Also share your ideas and charts in the comments section below! This is best way to keep it relevant, support us, keep the content here free and allow the idea to reach as many people as possible. **
-------------------------------------------------------------------------------
💸💸💸💸💸💸
👇 👇 👇 👇 👇 👇

HolderStat┆BNBUSD breakthrough bastion to 750CRYPTOCAP:BNB — Downtrend line shattered; retest formed a tight rectangle just above 635 neckline. Strong consolidation over rising support signals intent to reach the 720-760 extension zone marked atop former range. Bulls must guard 600-610 to preserve breakout psychology.

CETUS Hack Giving Opportunities Within SUICRYPTOCAP:SUI SUI is one of the fastest growing L1 chains. Previously extreme intra SUI dominance within swapping volume by KUCOIN:CETUSUSDT CETUS. This hack is a direct threat to the confidence of not just the application but the chain itself just like Ethereum was exposed during the MakerDAO hack.
Volume market wants to know their funds are secure to certain degree and predictable. Volume flow is more than fine with centralisation, esp with low barriers. Should the deposits be mostly secured and exploit fixed then it can bring confidence roaring back not just to CETUS but more importantly, SUI.
CETUS dominance within SUI is falling to rising applications. My favourite is Bluefin with its low barriers to account creation like google login. KUCOIN:BLUEUSDT BLUE has rising dominance within SUI volume market.

BNB will rest after reaching 1000BNB has successfully bounced back from the support area and heading towards the next resistance which is around 900-1000. This target is easily achievable for BNB since is fundamentally strong and BNB ecosystem is heavily used.
I'm expecting BNB to reach 1000 in 3rd of this year.
Follow Our TradingView Account for More Technical Analysis Updates, | Like, Share and Comment Your thoughts.
Cheers
GreenCrypto

GBPJPY BULLISH OR BEARISH DETAILED ANALYSISGBPJPY has successfully broken out of a long-term descending trendline on the 3D timeframe, which had capped price action for months. The breakout is now confirmed with multiple candle closes above the trendline and a retest holding firm around 190.500. This shift in structure signals a major bullish reversal, and I’m now targeting the 199.600 level as the next potential upside objective.
From a fundamental perspective, the British pound is strengthening amid persistent inflationary pressures in the UK, which are keeping the Bank of England firmly in the hawkish camp. With CPI still elevated and wage growth remaining sticky, the BoE has little room to cut rates aggressively anytime soon. In contrast, the Bank of Japan continues to hold a dovish tone with ultra-accommodative monetary policy, offering a wide interest rate differential that favors GBP longs, especially in carry trade setups.
Technically, this setup offers a clean risk-reward profile. The breakout above the descending structure combined with a strong support zone around 190.500 gives this move a solid foundation. We’re seeing momentum build with higher highs and higher lows forming across multiple timeframes. As long as GBPJPY holds above the 190.000 zone, the bullish bias remains valid and the path toward 199.600 looks open and sustainable.
Traders should keep a close eye on short-term pullbacks as potential re-entry zones. With a macro tailwind behind GBP strength and continued JPY weakness, this pair is primed for further upside. I’m riding this bullish wave with a medium-term outlook and adjusting my position based on intraday market behavior.

Another reversal coming (Altcoins Market)A reversal at the blue box zone has already occurred. Now, we’re looking at a potential minor reversal, pay close attention between Tuesday and Wednesday. Why does this matter? Because the fastest and safest way to make money is to buy low and sell high.
I usually exit when it becomes highly overbought or reacts to key support and resistance (SnR) zones. Currently, I’m not holding any major positions, except for a few memecoins.
Once the price reaches the red box area, I’ll be loading up. This time, I’m choosing CRYPTOCAP:BNB and $APT.
Don’t ask me why, I just am.

ETH - Ethereum Weekly Chart🔍 Market Structure & Smart Money Analysis:
✅ Bullish Signs:
Recent CHoCH at $2,000: Suggests shift from bearish to bullish order flow
BOS above recent resistance: Confirms upward market structure
Stochastic Oscillator: Turning bullish from oversold area (momentum confirmation)
Volume Pickup: Suggests stronger buyer interest
🧠 Liquidity Zones:
Equal Lows (EQL) seen in 2023 and again near 2024 → were taken out → classic liquidity sweep before reversal
Weak High near $4,951: A future potential liquidity target
Supply Zone around $3,200–$3,700: Previously strong resistance, could act as a rejection point again
🧭 Trend Summary:
Macro Structure: Recovering from multi-month downtrend
Short-Term: Bullish momentum building post-reversal
Next Objectives:
Bullish target: $3,200–$3,700 (possible pause or reversal zone)
Bearish invalidation: Drop below $2,000 with strong candle body
📝 Conclusion & Outlook:
ETH has likely confirmed a bullish shift on the weekly timeframe with the CHoCH and BOS above $2K.
Immediate upside targets are within the $3,200–$3,700 region before facing stronger resistance.
This could be the beginning of a longer-term accumulation → markup cycle, targeting the $4,950+ liquidity zone eventually.
Keep monitoring weekly closes and volume, and watch for divergence or rejection signals near supply zones.
-------------------
----------------------------
Low Market Cap #RWA #RealEstate #Tokenization Platforms by FDV
SQRB $100K on PROBIT
$RNB $310K
$HTS $1.9M
$STBU $3.5M
LAND $3.6M
-----
Not for recommendations to BUY SELL any stocks, cryptos, FX or securities
Not for Financial Advise
DYOR

HolderStat┆BNBUSD prepare to test $700CRYPTOCAP:BNB surges out of a falling-channel base, then prints twin consolidation pennants that keep hugging an accelerating support rail near 640 USDT. Friday’s fresh thrust through the pennant roof drags price back inside the long-term rising wedge, opening a measured path toward the 720-740 resistance shelf. As long as the inner trendline at 630-635 holds, momentum traders can lean on the channel mid-line; a daily close below 600 would defer—but not defeat—the bullish thesis.

BNBUSDT | Watching the Blue BoxesBNBUSDT is setting up a possible move, and I’ll be watching for an upward break inside the blue boxes .
No need to jump the gun. If price breaks out with volume and confirms on a lower timeframe, that’s where opportunity begins .
“I will not insist on my short idea. If the levels suddenly break upwards and do not give a downward break in the low time frame, I will not evaluate it. If they break upwards with volume and give a retest, I will look long.”
Let others guess. You wait with purpose.
📌I keep my charts clean and simple because I believe clarity leads to better decisions.
📌My approach is built on years of experience and a solid track record. I don’t claim to know it all but I’m confident in my ability to spot high-probability setups.
📌If you would like to learn how to use the heatmap, cumulative volume delta and volume footprint techniques that I use below to determine very accurate demand regions, you can send me a private message. I help anyone who wants it completely free of charge.
🔑I have a long list of my proven technique below:
🎯 ZENUSDT.P: Patience & Profitability | %230 Reaction from the Sniper Entry
🐶 DOGEUSDT.P: Next Move
🎨 RENDERUSDT.P: Opportunity of the Month
💎 ETHUSDT.P: Where to Retrace
🟢 BNBUSDT.P: Potential Surge
📊 BTC Dominance: Reaction Zone
🌊 WAVESUSDT.P: Demand Zone Potential
🟣 UNIUSDT.P: Long-Term Trade
🔵 XRPUSDT.P: Entry Zones
🔗 LINKUSDT.P: Follow The River
📈 BTCUSDT.P: Two Key Demand Zones
🟩 POLUSDT: Bullish Momentum
🌟 PENDLEUSDT.P: Where Opportunity Meets Precision
🔥 BTCUSDT.P: Liquidation of Highly Leveraged Longs
🌊 SOLUSDT.P: SOL's Dip - Your Opportunity
🐸 1000PEPEUSDT.P: Prime Bounce Zone Unlocked
🚀 ETHUSDT.P: Set to Explode - Don't Miss This Game Changer
🤖 IQUSDT: Smart Plan
⚡️ PONDUSDT: A Trade Not Taken Is Better Than a Losing One
💼 STMXUSDT: 2 Buying Areas
🐢 TURBOUSDT: Buy Zones and Buyer Presence
🌍 ICPUSDT.P: Massive Upside Potential | Check the Trade Update For Seeing Results
🟠 IDEXUSDT: Spot Buy Area | %26 Profit if You Trade with MSB
📌 USUALUSDT: Buyers Are Active + %70 Profit in Total
🌟 FORTHUSDT: Sniper Entry +%26 Reaction
🐳 QKCUSDT: Sniper Entry +%57 Reaction
📊 BTC.D: Retest of Key Area Highly Likely
📊 XNOUSDT %80 Reaction with a Simple Blue Box!
📊 BELUSDT Amazing %120 Reaction!
📊 Simple Red Box, Extraordinary Results
I stopped adding to the list because it's kinda tiring to add 5-10 charts in every move but you can check my profile and see that it goes on..

EURUSD BULLISH OR BEARISH DETAILED ANALYSISEURUSD has followed our expectations beautifully, bouncing strongly off a key support zone near 1.1270. This zone was previously a tough resistance which the pair broke through, and it’s now acting as a strong demand area. The latest bullish engulfing candle from this region signals solid buying pressure, confirming that bulls are stepping in to protect this structure. I’m now targeting a move toward the 1.17 level, which aligns with the previous high and the next major resistance on the chart.
From a macro perspective, the euro is showing resilience amid recent ECB policy comments, where officials have adopted a cautious but steady tone. Inflation remains persistent enough to delay aggressive rate cuts, keeping EUR demand intact. Meanwhile, the dollar is seeing renewed selling interest as market expectations shift toward a Fed pause, especially after softer US economic indicators including retail sales and jobless claims. This divergence is likely to support further upside in EURUSD.
Technically, this is a classic textbook retest of broken resistance turned support, backed by momentum indicators such as RSI now bouncing from mid-range and MACD showing signs of a potential bullish crossover. Volume has spiked at the support zone, confirming institutional participation. As long as EURUSD holds above 1.1270, I remain bullish and see this move extending toward 1.17 over the coming sessions.
This setup presents a strong risk-to-reward opportunity with momentum aligning with structure. The breakout and retest scenario is fully intact, and fundamentals are now favoring a continuation to the upside. Traders and swing holders should keep this on their radar as EURUSD looks ready to climb further.

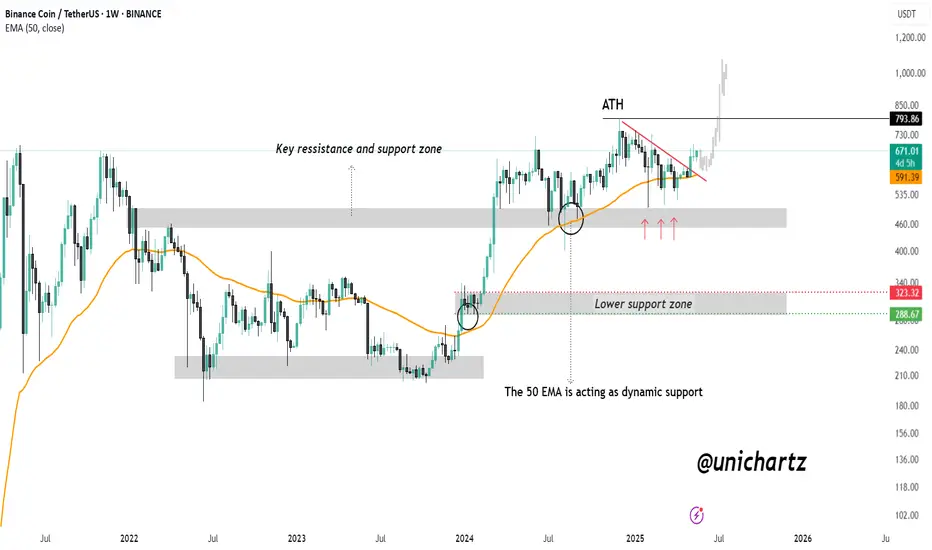
BNB Weekly Breakout: Road to $1,000?CRYPTOCAP:BNB is showing strong bullish momentum on the weekly chart. The 50 EMA is acting as a dynamic support, holding firm during multiple retests and providing a solid foundation for upward movement.
Recently, price action has broken above a key descending resistance line and successfully reclaimed a major support-resistance zone, turning it into a strong base. This area, which previously acted as a battleground for bulls and bears, is now supporting the current rally.
As long as BNB continues to hold above this zone and the 50 EMA, the structure remains bullish. With sustained momentum, a retest of the all-time high zone around $793 is likely, and a breakout above it could open the door for a move toward $1,000 and beyond.
DYOR, NFA
HolderStat┆BNBUSD digesting the wedge breakCRYPTOCAP:BNB shattered a year-long descending wedge, sprinted to 670 USDT, and now forms a pennant atop the 620 neckline. Holding 620 keeps the 700-730 target alive; drop below 600 and price risks sliding back inside the old wedge toward 560. 🔔

BNBUSDT - Big Move Loading….BINANCE:BNBUSDT recently made a clean breakout from a strong resistance level, and since then, it’s been chilling in a tight consolidation range textbook flag formation if you ask us! This kind of local flag pattern often signals a continuation of the previous move, and in BNB’s case, that move was up.
The consolidation phase seems mature now, and price action is starting to show signs of life again. With growing hype around BNB and Binance related developments, momentum could be building for a strong leg up. If things go as expected, the next destination might just be its previous all-time high. 👀
Traders should watch for volume confirmation on the breakout from this flag. A decisive move above the pattern could trigger a sharp rally. But hey as always, don’t forget your stop-loss. Protect your capital and ride the move smartly. Let’s see if BNB is ready to fly again!
BINANCE:BNBUSDT Currently trading at $653
Buy level : Above $655
Stop loss : Below $620
Target : $795
Max leverage 5x
Always keep stop loss
Follow Our Tradingview Account for More Technical Analysis Updates, | Like, Share and Comment Your thoughts

EURGBP BULLISH OR BEARISH DETAILED ANALYSISEURGBP is currently respecting a well-defined rising channel structure on the daily timeframe, and the pair has just delivered a strong bounce off the lower trendline support. This fresh reaction suggests renewed bullish momentum from the bulls stepping in at a key zone. The current price is hovering around 0.84–0.8450, and I’m targeting a move towards the 0.87 area, aligning perfectly with the upper boundary of the channel and a clean resistance level from previous market structure.
From a fundamental standpoint, euro sentiment is being supported by sticky inflation across the Eurozone. The ECB remains cautious with any premature easing, with policymakers signaling a data-dependent approach to rate cuts. Meanwhile, the UK economy is under pressure after the latest GDP figures confirmed weak growth, adding weight to the Bank of England’s dovish leanings. Traders are now increasingly pricing in rate cuts from the BOE in the coming quarter, creating a clear divergence in monetary policy outlooks — a bullish driver for EURGBP.
This technical setup is further reinforced by bullish candlestick formations on the daily chart, signaling a potential reversal from recent weakness. RSI is bouncing off mid-levels, and there's early crossover potential in MACD favoring upward momentum. Price has also reclaimed key support near 0.8400, now likely to act as a floor going forward. As long as price remains above this zone, the path of least resistance remains to the upside.
With this combination of a rising channel pattern, supportive euro fundamentals, and GBP macro weakness, EURGBP presents a high-probability long opportunity. I remain bullish on this pair with a clean 0.87 target in view. Momentum is building, and this setup fits perfectly into a swing trading model with trend continuation potential.

EURAUD BULLISH OR BEARISH DETAILED ANALYSISEURAUD is currently presenting a textbook bullish setup with a well-defined falling wedge formation on the daily chart. After a strong impulsive rally in April, price has been consolidating within this wedge, forming consistent lower highs and lower lows—typical of a corrective pattern. Now, with price testing the upper trendline of the wedge, we are positioned for a potential breakout, supported by increasing bullish momentum and clean structure. With the current price around 1.75, the next leg higher toward the 1.85 resistance zone is well on the radar.
From a fundamental perspective, the euro is gaining strength on the back of improving Eurozone macro data, with recent PMI figures showing resilience and inflation staying moderately sticky—making the ECB cautious about aggressive rate cuts. Meanwhile, the Australian dollar continues to face headwinds amid declining commodity prices and weakening consumer sentiment. The Reserve Bank of Australia remains relatively dovish, especially as wage growth plateaus and inflation expectations cool. This EURAUD divergence sets the stage for a broader move in favor of the euro.
Technically, the breakout from this wedge structure would signify the continuation of the prior bullish trend, and given the size of the previous impulsive move, a breakout target of 1.85 is both conservative and well-aligned with market structure. The bullish divergence forming on oscillators such as RSI and MACD also confirms the slowing momentum in the downward move. A clean break and close above 1.7550 would be the trigger point for long positions, with invalidation below 1.7220.
This is a high-probability breakout setup with strong confluence across technical and fundamental indicators. With euro strength coming into play and AUD fundamentals remaining weak, I’m favoring the long side here. A move toward 1.85 is well-supported, and a break above the wedge could trigger significant upside in the coming sessions. This is a setup worth watching closely.

Binance Blinked! High level of USDC volume across Binance..Binance has for many years tried their own versions of buying US debt with USD made from selling a stablecoin of their own. This has been squashed nearly every time and has most likely hindered the flow on binance itself.
It seems binance may have blinked. USDC has been flooding into Binance this year maintaining often very high levels of relative volume. This flow is overall better than if neither party capitulated. Must be careful of different streams of volume fragmenting both bullish and bearish data. While USDT is seeing all time highs its market share is falling with the wider adoption of stablecoins on chain and in traditional finance.
All this is occuring as stablecoin regulation is being passed in the US www.tradingview.com and Dimon says NYSE:JPM will be buying COINBASE:BTCUSD for clients soon

HolderStat┆BNBUSD consolidation breakout hunts 700-720CRYPTOCAP:BNB ended a protracted falling-channel decline by igniting from a tight consolidation rectangle around 600 USDT. The ensuing surge stalled near 670 and is now rechecking the breakout zone at 640, which also aligns with the underside of a freshly drawn rising wedge. A successful hold here could catapult price toward the 700-720 resistance corridor, the depth equivalent of the prior consolidation range. Slip back under 620 would risk sliding into the old channel.


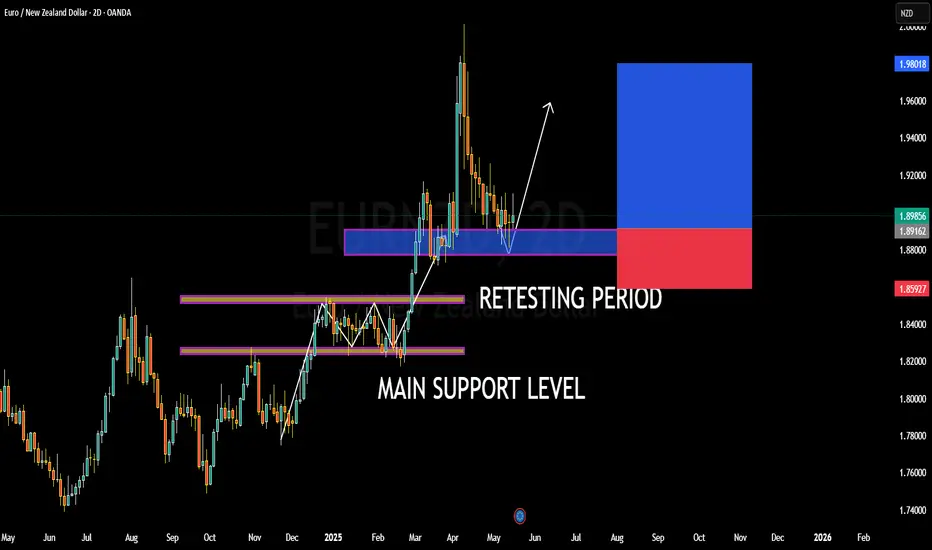
EURNZD BULLISH OR BEARISH DETAILED ANALYSISEURNZD is currently trading around the 1.89 zone after successfully completing a retest of its prior breakout area. This level aligns perfectly with a key historical demand zone, where previous resistance has now flipped into strong support. The market structure remains bullish, and the recent higher-low formation combined with increased volume suggests the pair is gearing up for its next impulsive move to the upside. The price has respected the support zone with precision, signaling institutional interest and a favorable risk-to-reward ratio for long positions.
From a fundamental perspective, the euro remains relatively supported against the New Zealand dollar due to diverging monetary policy expectations. The European Central Bank is maintaining a cautious but slightly hawkish tone amid sticky core inflation, while the Reserve Bank of New Zealand is under pressure to ease policy later this year due to softening economic indicators, including a slowdown in GDP growth and weaker labor market conditions. These macro drivers favor a bullish bias on EURNZD as capital flow leans toward safer, yield-protected assets in the eurozone.
Technically, this setup has clean market geometry. The pair has broken through a multi-month consolidation structure and is now retesting the breakout with confluence from the main support zone at 1.88–1.89. With momentum building and volume increasing on the bounce, the setup is valid for a continuation toward the 1.99 level, especially if the pair reclaims the minor resistance at 1.9050. Breakout traders and position holders should monitor this area closely for confirmation.
Overall, this is a textbook bullish continuation play. The market has absorbed sell pressure at a critical level, and the successful retest confirms the strength of the new support base. With both technical structure and macro fundamentals aligned, this setup offers high potential for trend continuation, and I'm anticipating a strong move toward 1.99 in the coming weeks.
REIUSDT Forming a Bullish Falling Wedge
REIUSDT is currently trading within a well-defined falling wedge pattern, a classic technical formation that often signals an imminent bullish reversal. As price action tightens near the apex of the wedge, REI is showing strong signs of accumulation, supported by a solid bounce from a major horizontal support zone. This key level has held multiple times, indicating buyers are stepping in with increasing conviction.
Volume is picking up in recent sessions, further validating the possibility of an upcoming breakout. A falling wedge breakout, especially with rising volume, tends to trigger powerful rallies. In this case, the projected move could see REIUSDT appreciating by 200% to 250%, targeting previous highs and major resistance levels from earlier cycles. Such explosive upside aligns well with the technical structure and growing investor attention around the project.
This setup offers a favorable risk-to-reward scenario for swing traders and mid-term investors who are watching for altcoin breakouts. With broader market sentiment leaning bullish and renewed interest flowing into undervalued coins, REIUSDT stands out as a compelling opportunity. The coin’s ability to maintain support while coiling within the wedge is a bullish signal in itself.
✅ Show your support by hitting the like button and
✅ Leaving a comment below! (What is You opinion about this Coin)
Your feedback and engagement keep me inspired to share more insightful market analysis with you!

BNBUSDT - Potential SupportWhen my latest BNB analysis() still printing, best trade is the one you make with your profits!
I'm watching BNB, specifically this blue box, where buyers might step in.
If price drops to this zone, I won't trade blindly. I'll look for a breakout above a small resistance level within the box, followed by a retest as support on a lower timeframe. This confirms buyer interest.
I'll also monitor order flow, CDV divergences, and volume spikes for clues. In narrow ranges, watch for liquidity hunts dips below support that quickly recover. Failed breakouts above resistance within the box, or regained levels, are also key.
Remember, I won't insist on a short if price breaks upward with volume and retests that level as support; I'll consider longs. Flexibility and confirmation are crucial.
I hope we reach this blue area to gauge the market reaction. Expect volatility. Missing this setup could be costly. Stay tuned for updates; you can rely on my insights.
📌I keep my charts clean and simple because I believe clarity leads to better decisions.
📌My approach is built on years of experience and a solid track record. I don’t claim to know it all but I’m confident in my ability to spot high-probability setups.
📌If you would like to learn how to use the heatmap, cumulative volume delta and volume footprint techniques that I use below to determine very accurate demand regions, you can send me a private message. I help anyone who wants it completely free of charge.
🔑I have a long list of my proven technique below:
🎯 ZENUSDT.P: Patience & Profitability | %230 Reaction from the Sniper Entry
🐶 DOGEUSDT.P: Next Move
🎨 RENDERUSDT.P: Opportunity of the Month
💎 ETHUSDT.P: Where to Retrace
🟢 BNBUSDT.P: Potential Surge
📊 BTC Dominance: Reaction Zone
🌊 WAVESUSDT.P: Demand Zone Potential
🟣 UNIUSDT.P: Long-Term Trade
🔵 XRPUSDT.P: Entry Zones
🔗 LINKUSDT.P: Follow The River
📈 BTCUSDT.P: Two Key Demand Zones
🟩 POLUSDT: Bullish Momentum
🌟 PENDLEUSDT.P: Where Opportunity Meets Precision
🔥 BTCUSDT.P: Liquidation of Highly Leveraged Longs
🌊 SOLUSDT.P: SOL's Dip - Your Opportunity
🐸 1000PEPEUSDT.P: Prime Bounce Zone Unlocked
🚀 ETHUSDT.P: Set to Explode - Don't Miss This Game Changer
🤖 IQUSDT: Smart Plan
⚡️ PONDUSDT: A Trade Not Taken Is Better Than a Losing One
💼 STMXUSDT: 2 Buying Areas
🐢 TURBOUSDT: Buy Zones and Buyer Presence
🌍 ICPUSDT.P: Massive Upside Potential | Check the Trade Update For Seeing Results
🟠 IDEXUSDT: Spot Buy Area | %26 Profit if You Trade with MSB
📌 USUALUSDT: Buyers Are Active + %70 Profit in Total
🌟 FORTHUSDT: Sniper Entry +%26 Reaction
🐳 QKCUSDT: Sniper Entry +%57 Reaction
📊 BTC.D: Retest of Key Area Highly Likely
📊 XNOUSDT %80 Reaction with a Simple Blue Box!
📊 BELUSDT Amazing %120 Reaction!
📊 Simple Red Box, Extraordinary Results
I stopped adding to the list because it's kinda tiring to add 5-10 charts in every move but you can check my profile and see that it goes on..

HolderStat┆BNBUSD 645 gate opens 730BNB price surged out of a steep falling channel and later coiled inside a tight consolidation rectangle, igniting a vertical drive that now hovers under the 645 USDT horizontal cap. Holding the breakout origin at 600‑610 keeps the upside narrative intact; clearance of 645 exposes the 720‑730 objective derived from the earlier channel depth.
