AVAX / AVAXUSDT | 1H | Avax will be the rocketHey there;
I have prepared avax analysis for you. All I ask from you is to support this analysis with your likes.
My Avax target level is 22.62 and my stop level is 17.37.
This analysis has a win rate of 2.00
Guys I will update this analysis under this post
Now let's just follow this analysis and see if my analysis is correct or not.
Thank you very much to everyone who has been kind and supported me with their likes.
Thanks to your support, I am constantly preparing special analyzes for you.
I love all my followers very much.
J-DXY
GOLD H1 Update: Pullback in Progress BUY DIPS TP 3 100 USD🏆 Gold Market Update (March 24th 2025)
📊 Technical Outlook update
🔸Bullish OUTLOOK
🔸Broke out and set new ATH
🔸Strong UPTREND: Sequence of Higher Lows
🔸Recommend to BUY DIPS 2950 USD
🔸Price Target BULLS: 3075 USD - 3100 USD
📈 Market Performance & Price Action
🚀 Gold Hits All-Time High – Reached $3,057.21/oz this week
📊 Driven by: Geopolitical tensions + economic uncertainty
🏦 Federal Reserve Impact
🛑 Fed Keeps Interest Rates Steady at 4.25%–4.50%
🔮 Signals 2 rate cuts likely in 2025 due to slowing growth
📉 Lower rate outlook supports bullish gold sentiment
💹 Gold Investment Trends
📈 Gold ETFs Outperform Physical Gold
GDX (Gold Miners ETF) ↑ 32%
GLD (SPDR Gold Shares) ↑ 15.5%
📊 Investors leaning toward mining stocks & ETF exposure for higher returns
DOLLAR INDEX (DXY): Bearish Outlook Explained
Dollar Index is currently consolidating within a range on intraday time frames.
Testing its upper boundary, the market formed a double top pattern.
With a strong bearish mood after the opening, the market is going
to drop lower.
Goal - 103.8
❤️Please, support my work with like, thank you!❤️
Correction( old gbpusd chart was invert post by mistake)
---
GBP/USD Bears Taking Control? 🔥
🚨 Smart Money Shift in Play! GBP/USD just broke a key Choch (Change of Character) level, signaling a potential trend reversal. The bulls are losing momentum, and smart money could be preparing for a deeper correction.
📉 Bearish Setup in Progress:
✅ Liquidity grab above previous highs
✅ Break of structure confirming weakness
✅ Retest of supply zone (1.29500) before a potential dump
📍 Target Zone: 1.27800 – 1.28000
📊 If price respects the supply zone, we could see a strong downside move into the next demand area. Watch for confirmation signs before entering!
🔥 Will GBP/USD hit the target, or will bulls fight back? Drop your thoughts below.
USD/CAD Triangle Pattern (24.03.2025)The USD/CAD pair on the M30 timeframe presents a Potential Buying Opportunity due to a recent Formation of a Triangle Pattern. This suggests a shift in momentum towards the upside and a higher likelihood of further advances in the coming hours.
Possible Long Trade:
Entry: Consider Entering A Long Position around Trendline Of The Pattern.
Target Levels:
1st Resistance – 1.4403
2nd Resistance – 1.4435
🎁 Please hit the like button and
🎁 Leave a comment to support for My Post !
Your likes and comments are incredibly motivating and will encourage me to share more analysis with you.
Best Regards, KABHI_TA_TRADING
Thank you.
The New week can give us a Pullback on Gold!Waiting for the bigger move and for that bigger move to happen we need a solid pill back to fill in some gaps. Focused on the patience for this in order to maximize the reward. Allow Monday and Tues to show if they will reach for the lows and set up. Logically the best entry should come after Tuesday. But you never know. Just wait for it cause price will show when it is ready.
EURUSD - Anticipated Pullback to Key Reaction ZoneThe EUR/USD 4-hour chart shows a recent downward movement after reaching peaks around 1.0950. Price action indicates a bearish momentum developing, with the pair currently trading at approximately 1.0815. We are expecting a pullback to occur first to the reaction zone marked on the chart (approximately 1.0730-1.0750 area, highlighted in blue), which represents a significant fair value gap. Traders should wait for the price to reach this zone and then look for signs of a bullish reversal, such as candlestick patterns (like hammers or engulfing patterns), divergences on oscillator indicators, or increased buying volume. This reaction zone could provide an attractive entry opportunity for long positions if bullish confirmation signals appear, potentially initiating a new upward movement from this established support area.
Disclosure: I am part of Trade Nation's Influencer program and receive a monthly fee for using their TradingView charts in my analysis.
$DXY IdeiaFor the DXY, we expect the week to remain bullish, driven by the ongoing correction after a significant price drop. Our expectation is that the upward movement will extend to the weekly key level premium.
This bullish outlook is reinforced by several factors. First, we observed a bottom SMT with GU, followed by a market structure break on the daily chart. Additionally, the H4 timeframe has shown continuation purges, where lows are rejected, indicating buying strength. Finally, we identified a bearish SMT in bond yields, providing a strong indication that we are following the correct direction.
Ultimate 2025 Forex Prop Trading FAQ + Strategy Guide🧠 Forex Prop Trading: What Is It?
Prop trading (proprietary trading) is when a trader uses a firm’s capital to trade the markets (instead of their own), and keeps a share of the profits – usually 70–90%.
✅ Low startup cost
✅ No personal risk (firm takes the loss)
✅ Big upside potential with scaling plans
📋 Step-by-Step Action Plan to Get Started (2025)
🔍 1. Understand the Prop Firm Model
🏦 Prop firms fund skilled traders with $10K to $500K+
🎯 You pass a challenge or evaluation phase to prove your skills
💵 Once funded, you earn a profit split (70%–90%)
🧪 2. Choose a Top Prop Firm (2025)
Look for reliable and regulated firms with transparent rules:
FTMO 🌍 – Trusted globally, up to $400K scaling
MyFundedFX 📊 – Up to 90% profit split, no time limit
E8 Funding ⚡ – Fast scaling and instant funding
FundedNext 💼 – 15% profit share during challenge phase
The Funded Trader 🏰 – Up to $600K with leaderboard bonuses
🔎 Compare features: fees, drawdown limits, trading style freedom
💻 3. Train & Master Your Strategy
🧠 Pick a clear, rule-based strategy (e.g. trend following, breakout, supply/demand)
📅 Backtest over 6–12 months of data
💡 Use AI tools & trade journals like Edgewonk or MyFXBook
🎯 Focus on:
Win rate (above 50–60%)
Risk-reward ratio (1:2 or better)
Consistency, not wild profits
🧪 4. Pass the Evaluation Phase
🔐 Follow risk rules strictly (daily & max drawdown)
⚖️ Use proper risk management (0.5–1% risk per trade)
🧘♂️ Trade calmly, avoid overtrading or revenge trades
📈 Most challenges:
Hit 8–10% profit target
Stay under 5–10% total drawdown
Trade for at least 5–10 days
🧠 Tip: Pass in a demo environment first before going live!
💵 5. Get Funded & Start Earning
🟢 Once approved, you trade real firm capital
💰 You keep up to 90% of profits, with withdrawals every 2 weeks to 1 month
🚀 Many firms offer scaling plans to grow your account over time
💬 FAQ – Prop Trading in 2025
❓ How much can you make?
🔹 Small accounts ($50K): $2K–$8K/month with 4–8% returns
🔹 Large accounts ($200K+): $10K+/month possible for consistent traders
💡 Many traders start part-time and scale as they build trust with the firm
❓ How much do I need to start?
💳 Challenge fees range from:
$100 for $10K
$250–$350 for $50K
$500–$700 for $100K+
⚠️ No need to deposit trade capital – just the challenge fee
❓ What are the risks?
You can lose the challenge fee if you break rules or over-leverage
You won’t owe money to the firm
The biggest risk is psychological – many fail from overtrading or emotional decisions
🚀 Final Tips to Succeed
✅ Trade like a robot, think like a CEO
✅ Journal every trade – self-awareness is key
✅ Avoid over-leveraging and gambling mindset
✅ Stick to one strategy and master it
✅ Focus on consistency over quick wins
Potenial inverse head and shoulders pattern for Bitcoin This is the scenario I’m believing in for the near term for BINANCE:BTCUSD .
One more leg down to confirm the neckline around 78,300 USD.
Quick reversal price action to retest the 92,300 USD (ish) level.
If the breakout takes place to the upside, then I think we will retest the previous highs, with a higher probability of going much higher. Although I believe the tariffs will have a big impact on the USD (DXY index), which I believe will have a strong effect on BTC for the near term, around the coming 6 months. So, I believe the new high will most likely come in Q4 this year, making this cycle different from the historic crypto cycles. Although, there is still a chance that other countries will start to adopt more crypto-friendly policies for crypto or Bitcoin, making this thesis more uncertain. If the policies come out as positive, then I think there are good chances of reaching new highs earlier than Q4, 2025.
DXY Update – Two Possible Scenarios! 📢 DXY Update – Two Possible Scenarios! 📢
1️⃣ Bearish Scenario: Looking for sell from the Bearish OB 🎯
2️⃣ Bullish Scenario: If price doesn’t reach the Bearish OB, we shift focus to the Bullish OB for a potential buy ✅
📌 Waiting for price to approach key zones & using confirmations for entry!
📊 Stay updated with our latest analysis – Follow our TradingView page! 🚀
Weekly FOREX Forecast Mar 24-28: Buy CAD, CHF, JPY vs USD!This is an outlook for the week of March 24 - 28th.
In this video, we will analyze the following FX markets:
USD Index
EUR
GBP
AUD
NZD
The USD Index is entering a Daily +FVG, which is nested in a Weekly +FVG. This is a bearish indication for the USD, which is a potential bullish situation for EURUSD, GBPUSD, AUDUSD and NZDUSD. This will be potentially bearish for the USDCAD, USDCHF, and USDJPY. Wait for the market structure shift going in the direction of your TP, and enter on the pullback.
Enjoy!
May profits be upon you.
Leave any questions or comments in the comment section.
I appreciate any feedback from my viewers!
Like and/or subscribe if you want more accurate analysis.
Thank you so much!
Disclaimer:
I do not provide personal investment advice and I am not a qualified licensed investment advisor.
All information found here, including any ideas, opinions, views, predictions, forecasts, commentaries, suggestions, expressed or implied herein, are for informational, entertainment or educational purposes only and should not be construed as personal investment advice. While the information provided is believed to be accurate, it may include errors or inaccuracies.
I will not and cannot be held liable for any actions you take as a result of anything you read here.
Conduct your own due diligence, or consult a licensed financial advisor or broker before making any and all investment decisions. Any investments, trades, speculations, or decisions made on the basis of any information found on this channel, expressed or implied herein, are committed at your own risk, financial or otherwise.
Weekly Market Analysis - 22nd Mar 2025Ok, here we go with another weekly market analysis!
So, what I'm feeling from my charting is that we may get a lower USD, but not before a little retracement first, particularly an iFVG on the 2W timeframe. After that, lower prices. This coincides with some of my analysis of other pairs, but not all of them. Whilst everything is not aligned yet, my instincts are usually pretty good. But, this not mean I am jumping into any trades yet. I have my own techniques for getting in and out of trades.
Check out the video and see if your own analysis flows with mine!
Analyzed pairs: DXY, EURUSD, NZDUSD, USDCHF, USDCAD, USDJPY, OIL, XPD, XPT, XAU, BTC.
Happy trading!
- R2F Trading
3.22 Gold Short-term Trend Analysis and SuggestionsTechnical analysis:
From the daily chart, technical indicators show signs of upward exhaustion and lose strength at extreme levels. At the same time, gold prices are holding above all bullish moving averages, with the 20-day simple moving average (SMA) providing dynamic pressure near 2941.70. From the 4-hour chart, the 100-period SMA and 200-period SMA continue to move higher, well below the above short-term moving averages. At the same time, the momentum indicator moves lower in the positive area but loses downward strength; while the relative strength index (RSI) corrects the overbought condition and then stabilizes near 61. Overall, Zhang Jinglin recommends wide fluctuations in gold operations today!
Short-term operation strategy:
SELL: Short near 3045 above, stop loss 3051, target near 3015, 3000.
We update regularly throughout the day and tell you how we manage active ideas and settings. Thank you for your likes, comments and attention, we are very grateful!
GBP/USD is heating up! A major shift is coming—are you ready?"Analysis:
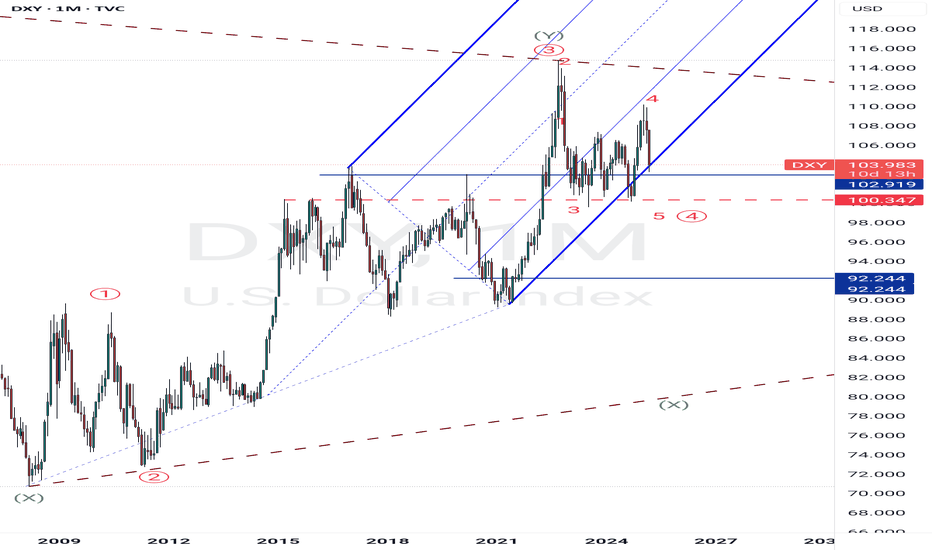
The correlation between DXY & GBP/USD is playing out perfectly! As the Dollar Index (DXY) approaches key resistance in the 112-113 zone, GBP/USD is reacting inversely, showing signs of a potential drop toward 1.14.
Elliott Wave patterns confirm a high-probability reversal setup, aligning with macroeconomic factors and liquidity zones. If DXY gains strength, expect a bearish breakdown on GBP/USD.
📈 Key Levels to Watch:
GBP/USD Resistance: 1.32-1.34
GBP/USD Support: 1.14
DXY Resistance: 112-113
DXY Support: 102.5
💡 Will GBP/USD hold or break down? Drop your predictions below! 👇
Bitcoin, interest rate effects, Macro events since 2021 - UPDATEThere is one very simple takeaway for me from this chart and that is simply that raises and Lowering of interest rates had Very little Effect on Bitcoin
It is more the effect it had on other organisations and the sentiment that followed Bitcoin and the traders.
For instance, From Jan 2023, when we saw Bitcoin begin its recovery, interest rates continued to rise.....and had NO effect on the Bitcoin recovery
And I think this continues to this day.
After the First push higher by Bitcoin in 2023, PA went into a Long range...in this time, interest rates began remaining at a static level. Bitcoin did not rise because of this.
When BTC was ready, it made a push higher again, interest rates were static and remained so while BTC entered another long range in 2024
It could be said that BTC PA rose once Rates were reduced but PA leveled out again even while the next rates decision was to reduce.
Bitcoin has its own agenda, it is NOT dependant on the USA to control its choices
On Each range, the MACD on the weekly timef rames was OVERBOUGHT.
And it is currently resetting having been overbought again.
This s NOTHING to do with interest rates.
MACRO events do have an impact though and we need to pay attention this this
But over all, Bitcoin is GOOD, BULLISH and getting ready for its next push
Have a Nice day now
DXY aka USD suspicious leading diagonalif price confirms it is a leading diagonal, we will see a corrective move down before another spike higher.
Am eagerly waiting for the confirmation to load up positions in eurusd gpb aud etc as DXY will show the way, it moves up mean USD bullish and hence eurusd gbpusd etc moves down.
Good luck.
PS: Give a boost if you like my sharing
DXY, bullish or bearish?Welcome back!
Today i'm posting a small idea on the DXY. Usually i cover crypto but the macro is important. A weak dollar correlates with more risk being taken and a strong dollar with less risk being taken. Hence my analysis of the DXY.
In the above chart a couple of things can be seen which makes the outlook hard to predict.
On one side there is a bullflag on the monthly timeframe with a target of 130!
On the other side, looking under we can see a bearish MACD cross and a bearish stoch RSI. On average it takes half a year to a year for a cross like this to recover.
This causes me to be bearish on the dollar and bullish on risk-on assets.
Thanks for reading


