As Goes January So Goes the YearI have written and talked about this statistical superstition born out of trading almanacs of the "January Effect" which proposes that the month of January's direction (a green bar or a red bar) will determine the final close of the year as a whole. I plugged the data into a spreadsheet this year mid-January to get the updated statistic and for the last 97 years this adage has held true 68% of the time. Like all statistics when studying markets "nothing is 100%" but it is safe to say "more often than not" this is true.
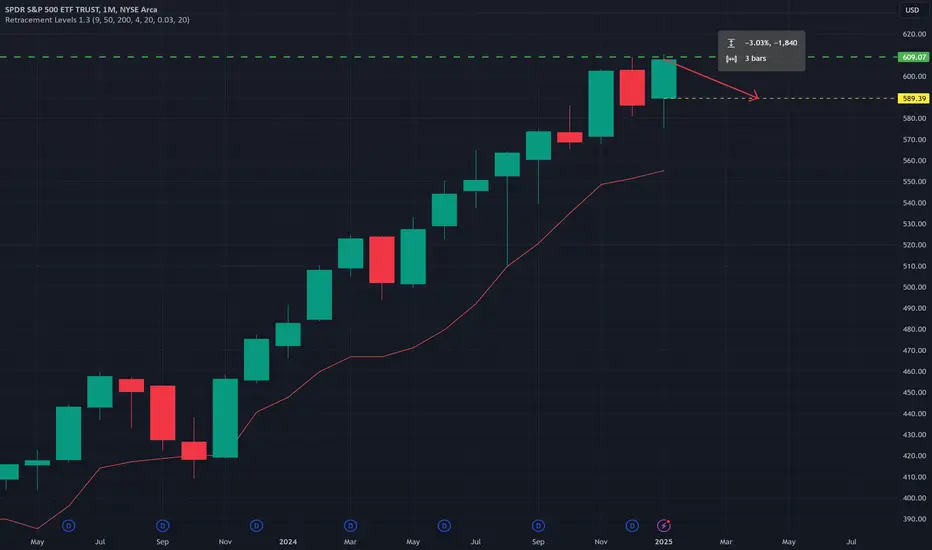
The January 2025 Monthly open is -3.03% from the Friday close... SPY is going to open -2.19% as of writing this morning. We still have a whole week of trading days left in January to see how 2025 will MOST PROBABLY play out.
There's a lot of "reasons" talk this morning about some Chinese AI being the culprit of the selloff. I never take heed of the need for the media to publish digestible stories to give such reasons: they are never tradable prior to the event they claim and each is a one-off so knowing the "reason" (if even true) is totally worthless for making money.
The more logical answer according to price which is far more actionable to traders is the failed breakout last Friday. While SPY made a new All Time High the Weekly itself failed to close to confirm it. Not following through on such a move is a clear bearish signal going into a weekend. Now THAT is a much better "reason" to be focused on this week (and every time it happens in the future).
January
Onyxcoin (XCN) 10x gains - luckyI know I'm not the only one that missed the amazing 10x gains from Onyxcoin. Whoever did have some of this cryptocurrency before the price went up this month sure is feeling lucky right now. I'd be hard pressed to say another company will be close to this amount of gains for the entire year. Looks like the year is going to be looking at the history of this monumental occasion for XCN. As it were, despite the company losing practically all their value, there is still a believer in this company out there in the world.

Ascending Triangle in Nikkei/Yen Futures: A 2025 Bullish Setup?1. Introduction
The Nikkei/Yen Futures, a crucial instrument for traders aiming to capture movements in Japan’s equity index and its currency dynamics, presents an intriguing setup as we step into 2025. An ascending triangle pattern, a classic bullish formation, is emerging on the chart, signaling a potential breakout to the upside.
Adding to the technical allure is the depletion of sell unfilled orders (UFOs) within a significant price zone between 40,420 and 39,685. This critical area, revisited six times since late July 2024, has seen a steady reduction of unfilled sell orders, opening the possibility for bullish momentum to dominate. With the price currently hovering near the 39,685 level, the stage appears set for a breakout opportunity.
2. The Technical Setup
The ascending triangle, characterized by a series of higher lows converging toward a horizontal resistance level, often signifies bullish pressure. In the case of the Nikkei/Yen Futures, the horizontal resistance resides near 39,685, the lower boundary of a key sell UFO zone.
This resistance has been tested repeatedly since July 2024, with each revisit chipping away at the sell orders within the zone. Such behavior suggests diminishing selling pressure, setting the foundation for a breakout. The anticipated target for this breakout, calculated using Fibonacci projection, is set at 41,380—aligning with historical price action and technical projections.
Key Contract Specifications:
o Regular Nikkei/Yen Futures (NIY1!)
Contract Size: ¥500 x Nikkei 225 index
Tick Size: ¥5
Point Value: ¥2,500
Margin Requirement: Approx. $ 1,500,000 JPY
o Micro Nikkei/Yen Futures (MNI)
Contract Size: ¥50 x Nikkei 225 index
Tick Size: ¥5
Point Value: ¥250
Margin Requirement: Approx. $ 150,000 JPY
These details ensure accessibility for both institutional and retail traders, with the micro contract enabling smaller capital commitments while maintaining exposure to the same underlying asset.
3. Forward-Looking Trade Plan
The technical evidence supports a bullish trade plan for Nikkei/Yen Futures:
Trade Direction: Long
Entry Price: Above 39,685, confirming a breakout from the resistance level.
Target Price: 41,380, based on Fibonacci projections.
Stop Loss: 39,120, targeting a 3:1 reward-to-risk ratio to manage risk effectively.
Reward-to-Risk Ratio: 3:1 (Calculated: 41,380 - 39,685 = 1,695 reward; 39,685 - 39,120 = 565 risk).
The trade parameters apply to both the standard and micro contracts, offering flexibility in position sizing. Traders with smaller accounts may opt for the micro contract to manage margin requirements while engaging in this high-potential setup.
4. Importance of Risk Management
Risk management remains the cornerstone of any successful trading strategy, particularly when trading leveraged instruments like futures. Here are key considerations for managing risk in the Nikkei/Yen Futures trade setup:
Stop-Loss Orders: Placing a stop-loss at 39,120 ensures a predefined risk level, protecting traders from unexpected market reversals. It’s vital to adhere to this level to maintain discipline and avoid emotional decision-making.
Position Sizing: The availability of micro contracts (MNIY1!) allows traders to tailor their position size according to their account size and risk tolerance. For example, trading one micro contract involves a significantly smaller margin commitment compared to the regular contract, making it suitable for retail traders.
Defined Risk Exposure: Leveraged products like futures can lead to substantial losses if risk is not clearly defined. Using stop-loss orders and trading within calculated risk parameters prevents the potential for undefined losses.
Precise Entries and Exits: Setting the entry above 39,685 ensures a systematic approach to triggering the trade based on the expected breakout. Similarly, targeting 41,380 using Fibonacci projections ensures that profit objectives align with technical analysis rather than arbitrary levels.
By prioritizing these aspects, traders can mitigate risks while maximizing the potential reward from this bullish setup.
5. Closing Remarks
The Nikkei/Yen Futures seem to be poised for a potential breakout as we enter 2025, driven by a combination of technical factors and diminishing sell-side unfilled orders. The ascending triangle formation strengthens the bullish bias, with the calculated Fibonacci projection of 41,380 offering an attractive target.
Both the standard and micro contracts cater to different trader profiles, allowing participation regardless of account size. As the price approaches the critical 39,685 level, traders are encouraged to stay vigilant, using real-time CME data to track developments and validate entry triggers.
When charting futures, the data provided could be delayed. Traders working with the ticker symbols discussed in this idea may prefer to use CME Group real-time data plan on TradingView: www.tradingview.com - This consideration is particularly important for shorter-term traders, whereas it may be less critical for those focused on longer-term trading strategies.
General Disclaimer:
The trade ideas presented herein are solely for illustrative purposes forming a part of a case study intended to demonstrate key principles in risk management within the context of the specific market scenarios discussed. These ideas are not to be interpreted as investment recommendations or financial advice. They do not endorse or promote any specific trading strategies, financial products, or services. The information provided is based on data believed to be reliable; however, its accuracy or completeness cannot be guaranteed. Trading in financial markets involves risks, including the potential loss of principal. Each individual should conduct their own research and consult with professional financial advisors before making any investment decisions. The author or publisher of this content bears no responsibility for any actions taken based on the information provided or for any resultant financial or other losses.

Nifty and Sectoral Analysis till 31 Dec 2024 - View January 2025Sectoral Analysis
Time Frames
Yearly
Monthly
Weekly
Daily

Will we repeat Jan 2020 - Apr 2021? I copied Jan 2020 - Apr 2021 and overlapped it starting Jan 2023.. minus the Covid drop, I could see us following similar path but more drawn out.

USDJPY - WEEKLY ANALYSIS - 20.01.24 Price took buyside LIQ on the weekly TF
create a 4HR bear ob
Sell to buy
sell 175 pip
buy possibe 500+ pips from Weekly GZ.

USDJPY - DAILY - WEKELY ANALYSIS - 20.01.24Price took buyside LIQ on the weekly TF
create a 4HR bear ob
Sell to buy
sell 175 pip
buy possibe 500+ pips from Weekly GZ.

USDJPY 4HR Weekly Analysis Price took buyside LIQ on the weekly TF
create a 4HR bear ob
Sell to buy
sell 175 pip
buy possibe 500+ pips from Weekly GZ.

HSI ForecastThe current status is uncertain, and there are two possibilities:
1. If it is the 2nd wave of an upward trend, the HSI (Hang Seng Index) will rebound in the short term and surpass 16500. The level of 16500 will be tested multiple times, which would be the most favorable situation for the HSI.
2. If it is the 5th wave of a downturn, the HSI will break the 15400 level and drop even further, below 14470, previous bottom, and towards 13000.
In 2024, I expect the HSI to fluctuate between 15300 and 17100 until the market gains a clearer understanding of China's economic performance.
At the beginning of 2024, in the very short term, the trend is likely to decline further. I anticipate that the HSI will test a near-term new low at 15300. However, after the 1st quarter, it could benefit from a lower Federal Reserve interest rate. Nevertheless, the strength of the rebound may not be very strong due to the prevailing uncertainty in the market. We can target the rebound to 16500 or max 17000.
Disclaimer
Please understand the forecasting will be subjected to many factors and this is the vision at this moment. This comment is not encouraging you to follow or make any investment decision. You will be the only one be responsible for your investment decision and any related behavior. I am not going to bear any legal or non-legal responsibility.

🟨 UPDATE 4: Whaley Breadth SignPostThis is update 4 for the Signpost after the Whaley Breadth idea post in Feb'23
If you remember The Whaley Breadth Trust is a powerful signal that has a great success rate. It was invented by Wayne Whaley in 2009. Since 1970 to 2009, the signal has occured only 12 times!
Based on the Whaley Breadth Post and January Trifecta we drew a potential map for the next 3, 6 and 12 months.
For my followers, I even made a special indicator for the Whaley Breadth here:
UPDATING:
We have had a strong rally up since our last update in May28. This has brought us very close to our signposts, but of course some of the deadlines have been missed. This is to say that we are moving in the right direction as per the historical indications but slower than the averages that I have used.
Make sure you check my previous posts about the Whaley Thrust as how they are developing.

Overview of Cryptocurrency Volatility - 1M, January, 2023.Analysis of the volatility index in January. Time interval - 1 month.
Currency - USDT or equivalent to BUSD .
The selection is carried out according to the lists of cryptocurrencies that are represented on the spot and futures markets, with a total of more than a hundred coins.
Top 15 Coins (January):
1. APT /usdt - 385.47% (High&Low: 492.62%)
2. GALA /usdt - 225.15% (High&Low: 279.59%)
3. DYDX /usdt - 192.20% (High&Low: 223.39%)
4. FTM /usdt - 168.43% (High&Low: 178.64%)
5. MANA /usdt - 152.24% (High&Low: 177.25%)
6. HOOK /usdt - 147.93% (High&Low: 224.29%)
7. INJ /usdt - 146.51% (High&Low: 156.86%)
8. GMT /usdt - 140.10% (High&Low: 199.74%)
9. SOL /usdt - 139.92% (High&Low: 171.61%)
10. OP /usdt - 135.95% (High&Low: 179.30%)
11. DAR /usdt - 132.99% (High&Low: 186.10%)
12. LDO /usdt - 130.50% (High&Low: 198.22%)
13. ONE /usdt - 125.57% (High&Low: 136.76%)
14. AUDIO /usdt - 115.81% (High&Low: 186.62%)
15. OCEAN /usdt - 113.59% (High&Low: 147.80%)
The coin showed the worst result: CTK /usdt - 8.20% (High&Low: 23.92%).
Full list of analyzed coins: www.tradingview.com
Analysis information for all coins: docs.google.com
Thanks for your attention!

Overview of Cryptocurrency Volatility - 1D, January, 2023.Analysis of the volatility index in January. Time interval - 1 day.
Currency - USDT or equivalent to BUSD .
The selection is carried out according to the lists of cryptocurrencies that are represented on the spot and futures markets, with a total of more than a hundred coins.
Top 15 Coins (1 day):
1. APT /usdt - 249.29% (High&Low: 532.39%)
2. GALA /usdt - 242.33% (High&Low: 533.62%)
3. HOOK /usdt - 231.75% (High&Low: 543.74%)
4. LDO /usdt - 215.16% (High&Low: 524.31%)
5. GMT /usdt - 201.68% (High&Low: 421.13%)
6. DYDX /usdt - 200.32% (High&Low: 413.62%)
7. ANC /busd - 199.74% (High&Low: 467.76%)
8. SOL /usdt - 186.13% (High&Low: 363.33%)
9. OP /usdt - 178.49% (High&Low: 414.12%)
10. FTM /usdt - 176.37% (High&Low: 331.13%)
11. PHB /busd - 170.30% (High&Low: 471.12%)
12. MANA /usdt - 161.58% (High&Low: 352.77%)
13. AUDIO /usdt - 157.92% (High&Low: 364.08%)
14. AXS /usdt - 155.57% (High&Low: 330.32%)
15. OCEAN /usdt - 155.21% (High&Low: 406.22%)
The coin showed the worst result: BTC /usdt - 52.13% (High&Low: 106.50%).
Full list of analyzed coins: www.tradingview.com
Analysis information for all coins: docs.google.com
Thanks for your attention!

Overview of Cryptocurrency Volatility - 1h, January, 2023.Analysis of the volatility index in January. Time interval - 1 hour.
Currency - USDT or equivalent to BUSD .
The selection is carried out according to the lists of cryptocurrencies that are represented on the spot and futures markets, with a total of more than a hundred coins.
Top 15 Coins (1 hour):
1. HOOK /usdt - 1156.19% (High&Low: 2458.48%)
2. ANC /busd - 990.89% (High&Low: 2184.49%)
3. LDO /usdt - 966.14% (High&Low: 2083.05%)
4. GALA /usdt - 957.66% (High&Low: 2052.71%)
5. PHB /busd - 946.5% (High&Low: 2085.62%)
6. APT /usdt - 907.17% (High&Low: 2101.18%)
7. OP /usdt - 799.48% (High&Low: 1760.77%)
8. OCEAN /usdt - 795.33% (High&Low: 1719.13%)
9. GMT /usdt - 789.94% (High&Low: 1695.64%)
10. DYDX /usdt - 747.58% (High&Low: 1612.22%)
11. LUNA /usdt - 712.64% (High&Low: 1519.07%)
12. HNT /busd - 702.37% (High&Low: 1544.36%)
13. FTM /usdt - 689.97% (High&Low: 1485.82%)
14. AUDIO /usdt - 686.29% (High&Low: 1438.73%)
15. MASK /usdt - 678.93% (High&Low: 1494.87%)
The coin showed the worst result: BTC /usdt - 204.1% (High&Low: 465.11%).
Full list of analyzed coins: www.tradingview.com
Analysis information for all coins: docs.google.com
Thanks for your attention!

❌ UPDATE 3: Whaley Breadth SignPostThis is update 3 for the SignPost after the Whaley Breadth Post.
If you remember The Whaley Breadth Trust is a powerful signal that has a great success rate. It was invented by Wayne Whaley in 2009. Since 1970 to 2009, the signal has occured only 12 times!
Based on the Whaley Breadth Post and January Trifecta we drew a potential map for the next 3, 6 and 12 months.
For my followers, I even made a special indicator for the Whaley Breadth here:
UPDATING we see that the SPX failed to follow the map on both the pullback and the expected 3 month gain. However, we also see that there is more tightening action than anticipated, rather than complete capitulation. The second pullback measures about -6.2% rather than the anticipated -5.5%. But rather than appreciating to +12% the SPX appreciated only +6%.
I would conclude that the current Whaley Breadth SignPost has failed on two accounts. Will continue to watch its development but so far it is not performing as expected.

AUDJPY GEARING TO FLYAUDJPY has hit a key support area and I'm currently waiting don it to retest to buy up. I had my first area of buy but it did dip regarding retest so two entries are shown.

🟨 January - Massive BULLISH SignJANUARY HAS A PROVEN PREDICTIVE POWER FOR THE END OF THE YEAR
WHY THIS MATTERS
This indicator has been 90% correct since 1950. It is used on the SP500.
BY THE NUMBERS
The January Trifecta (def below) has occured 31 years since 1950. 28 of them we have followed with positive year for SP
Average gain during January Trifecta is +17%
If January Barometer closes above 5% (CURRENTLY +6% for month), average gain is 17.5%
If you are coming from a negative previous year (like we have 2022) and we get the January Trifecta the average gain is 28.9%
Down year follwed by January Trifecta has happened 10 times since 1950. Look them up: 1954, 1958, 1961, 1963, 1971, 195, 1995, 2012, 2019, 2023
THE DEFINITIONS
Santa Clause Rally - last 5 days oof Dec + 2d Jan
January "First Five Days" - the total move for the first 5 trading days of Jan
January Barometer - the total move of the Jan Mov
January Trifecta - Positive signs from Santa Clause Rally, First Five Days and the Barometer

GBPUSD daily forecastIts Friday the 13th but that does not affect us as our skill is how we trade and no external forces can ever affect us.

January EffectHello guys! Have you ever heard of the "January effect"? It's a pattern that has been observed in financial markets where the prices of small cap stocks tend to go up in the month of January. Some people think this happens because of tax-loss selling (when investors sell stocks that aren't doing well in order to reduce their tax burden) or because more people are interested in buying small cap stocks at the start of a new year. It's important to remember that the January effect isn't a sure thing and shouldn't be the only reason you make investment decisions.
What do you think about this effect?

S&P500 - Outlook - 2023 - 1st Week of January - 4 Hour ChartS&P500 Outlook for the 1st week of January 2023 on the 4 hour chart.
Looking for a minor high, or the beginning of a strong move to the downside to HEAVILY short the market within the first few days, or first trading week of January.
1) Always have your stop loss in place.
2) Always have your 'take-profit' target planned before entering.
3) Always be open to being wrong, and exit when the market is not heading in the anticipated direction.

S&P500 - Outlook - 2023 - 1st week of JanuaryS&P500 Outlook for the 1st week of January 2023.
Looking for a minor high, or the beginning of a strong move to the downside to HEAVILY short the market within the first few days, or first trading week of January.
1) Always have your stop loss in place.
2) Always have your 'take-profit' target planned before entering.
3) Always be open to being wrong, and exit when the market is not heading in the anticipated direction.

S&P500 - Outlook - 2023 - 1st Week of JanuaryS&P500 Outlook for the 1st week of January 2023.
Looking for a minor high, or the beginning of a strong move to the downside to HEAVILY short the market within the first few days, or first trading week of January.
1) Always have your stop loss in place.
2) Always have your 'take-profit' target planned before entering.
3) Always be open to being wrong, and exit when the market is not heading in the anticipated direction.

🟨 January effect - SPX vs RUTWHAT IT IS
Since 1988 the Russell 2000 has outperfomed the SPX 73.5% of the time during the end of December into 1st of January.
Classical David vs Goliath. Read more below👇
THE DETAILS
Testing from 1988 to 2021 the period of 15th Dec through to 1st Jan, we see that Russell 2000 has outperformed the SPX 25 out of all 34 years.
This is a win rate of 73.5% . Moreover, the times the Russel outperforms the SPX were greatly oversized when the Russell underperforms. Gains in the years of outperfmrance are 5 times bigger. Totals outperformance vs Total underperformance is (42.80% vs -7.81%).
And there was only 1 year (1988) when there was a loss larger than 1%. The last few years we have not been so consistent but it is worth the consideration.
