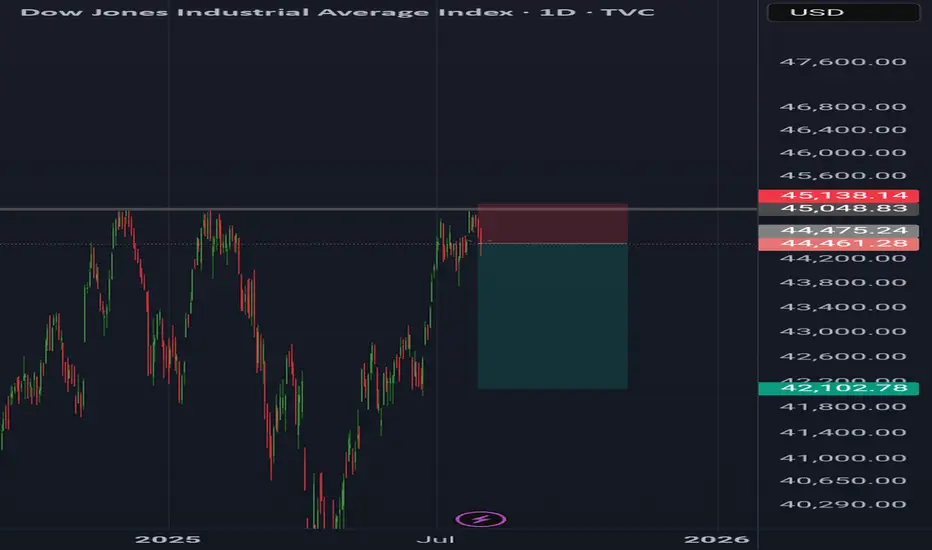
Dow jonesDow Jones daily analysis
Time frame daily
Risk rewards ratio >3.5
Short position
Because price couldn't break the 45.048 again and earthquake in 5he east of Russia and Japan makes the markets drop down
Japan
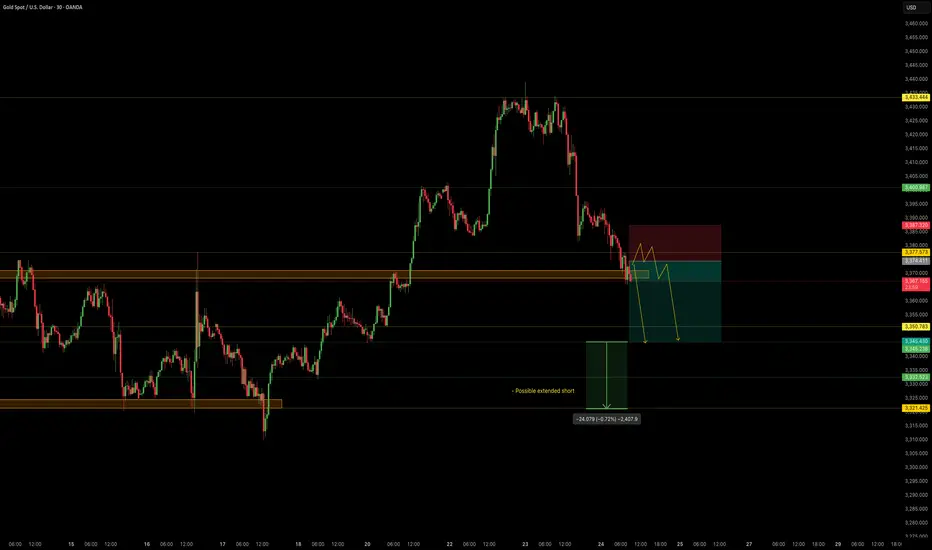
NordKern - XAUUSD InsightNordKern | Simplified Insight OANDA:XAUUSD – Short Opportunity Ahead
Gold is now near our important level at 3370, offering a shorting opportunity considering recent events and technical action.
Gold Price Decline – What's Behind It?
In the last two sessions (July 23–24), gold has retreated strongly owing to a set of global as well as market-specific circumstances:
1. Trade Deal Optimism
Advances in U.S.–Japan and U.S.–EU trade discussions lessened worldwide uncertainty, decreasing demand for gold as a safe-haven.
2. Higher U.S. Yields
Higher Treasury yields are rendering non-yielding assets such as gold less appealing, adding to downward pressure.
3. Technical & Profit-Taking
Following a recent rally, gold was exposed to selling. Stop-loss and profit-taking triggers hastened the fall.
Summary of Key Drivers
U.S. Trade Deals: Reduced geopolitical risk
Higher Treasury Yields: Decreased gold's relative attractiveness
Technical Selling: Enhanced the downward trend
Trade Setup – Bearish Bias
Entry : 3374.4
Stop Loss : 3387.3
Take Profit : 3345.4
Extended Target : 3322
Key Notes:
- Trade Deal Optimism: U.S.–Japan and U.S.–EU agreements eased global tensions, reducing demand for gold as a safe-haven asset.
- Yield Pressure: Rising U.S. Treasury yields made gold less attractive compared to interest-bearing alternatives.
- Technical Selling: Profit-taking and stop-loss triggers accelerated the decline after gold’s recent rally.
This setup remains tactically driven. Manage risk carefully and monitor for any renewed political shifts.
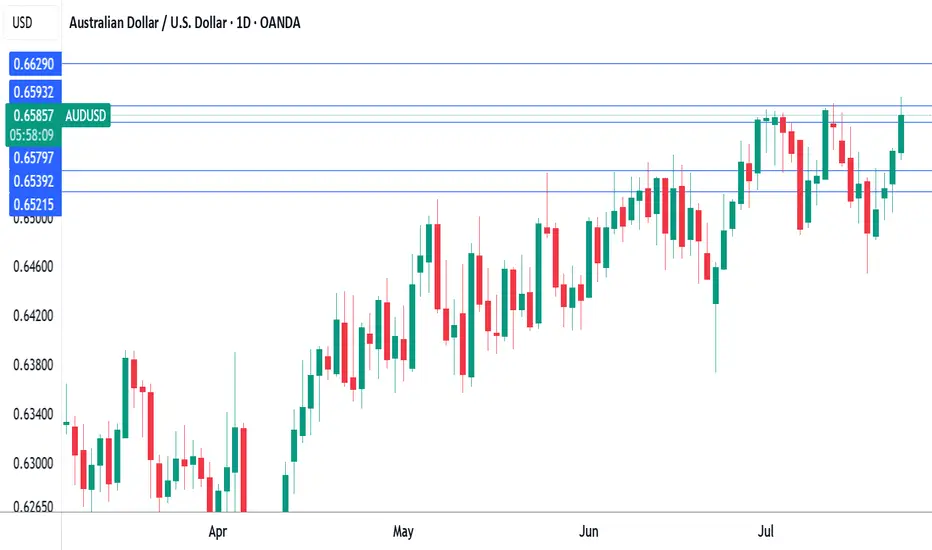
Australian dollar hits eight-month high on risk-on moodThe Australian dollar has rallied for a fourth sucessive day. In the North American session, AUD/USD is trading at 0.6588, up 0.50% on the day. The red-hot Aussie has jumped 1.6% since Thursday and hit a daily high of 0.6600 earlier, its highest level since Nov. 2024.
The financial markets are in a risk-on mood today, buoyed by the announcement that the US and Japan have reached a trade agreement. Under the deal, the US will impose 15% tariffs on Japanese products, including automobiles. As well, Japan will invest some $550 billion into the US.
Global stock markets are higher and the Australian dollar, a gauge of risk appetite, has climbed to an eight-month high.
Investors also reacted positively today to reports that negotiations between the US and China were speeding up and the US could grant an extension of the August 12 deadline to reach an agreement. The latest positive developments on the tariff front have raised hopes that the US will also sign trade deals with the European Union and South Korea.
The White House continues to put pressure on the Federal Reserve. Earlier this week, Treasury Scott Bessent called for a thorough review of the Federal Reserve. Bessent echoed President Trump's calls for the Fed to lower interest rates.
Fed Chair Jerome Powell hasn't shown any signs of plans to cut rates and has fired back that the uncertainty over Trump's trade policy has forced the Fed to adopt a wait-and-see policy. The Fed is widely expected to hold rates at the July 30 meeting but there is a 58% likelihood of a rate cut in September, according to CME's FedWatch.
AUD/USD has pushed above resistance at 0.6579 and tested resistance at 0.6593 earlier. Next, there is resistance at 0.6629
0.6539 and 0.6521 are the next support levels
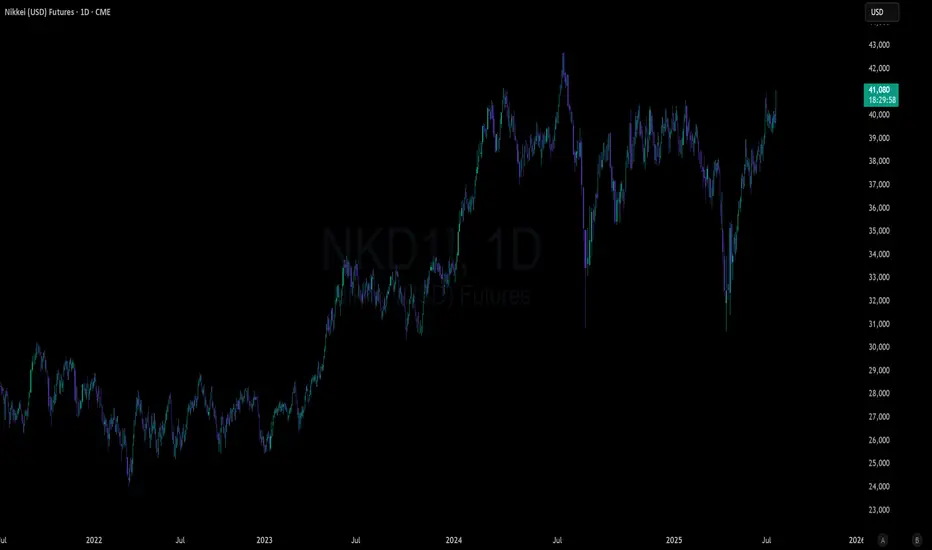
Nikkei Futures Try for ATHsWith US President Trump finalizing an agreement with Japan by imposing a 15% tariff on US businesses for Japanese products, Japanese stocks are flying due to the new found competitive advantage they have
146.6 gap hike. With all of the other pairs basically closing their gap against JPY, the only one left is usd!

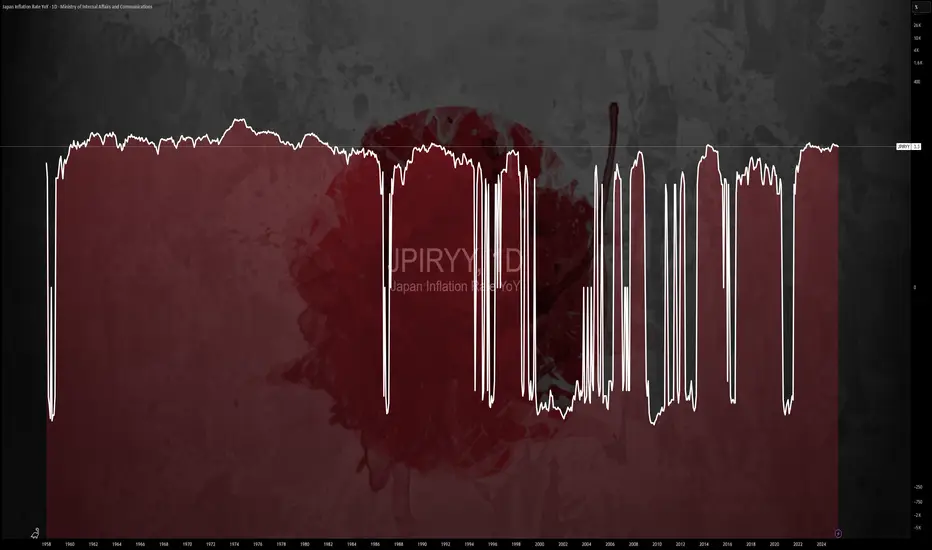
$JPIRYY -Japan Inflation Hits 7-Month Low (June/2025)ECONOMICS:JPIRYY 3.3%
June/2025
source: Ministry of Internal Affairs & Communications
-Japan’s annual inflation rate eased to 3.3% in June 2025 from 3.5% in May, marking the lowest reading since last November, as a sharp slowdown in electricity and gas prices offset persistent upward pressure from rice.
Core inflation also matched the headline rate at 3.3%, pointing to a three-month low and aligning with expectations.
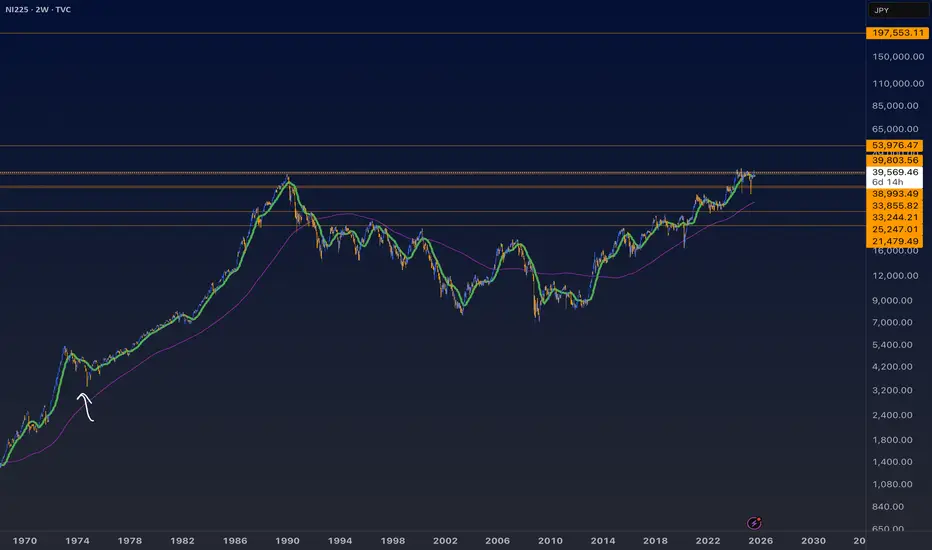
JAPAN as a HERO? UP! GOKU Last Fight! JAPAN is the last one to join the party! The final fight for the #BlowoffTop.
Why is this so important? If you look at correlations with BTC, global liquidity, China, the Fed’s interest rates, and more, Japan plays a key role. After China, Japan is the next to wake up and give the final push to this Bull Market.
The last time the Nikkei dropped more than 25% was during the COVID crash. What happened next? It rallied 26% in the first 52 days and extended its Bull Market to over 88% from the bottom.
With the current Carry Trade crisis (still unresolved), the TVC:NI225 has dropped more than 25% again, and guess what? It’s up 26% in the first 52 days... History doesn’t repeat, but it often rhymes.
It’s feeling like 2017 all over again... What do you think? 🚀📈

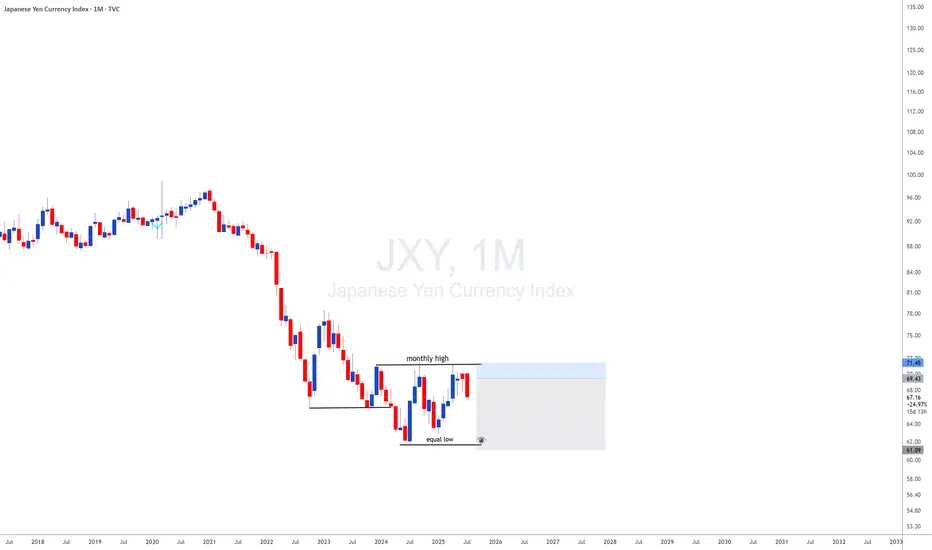
JXY with JXY looking monthly downside and DXY looing upside i will be looking for 35 years breakout of usdjpy meanning uj is a long therm upside
How to View the Assets in Japan
It should be noted that many of the assets the government owns are not marketable, or, if so, their
price can sharply drop in the case of fiscal crisis. Therefore, the financial situation should be assessed
first by gross debt.
In addition, the assets earmarked with the liabilities (such as pension reserves and FILP loans) are
not directly related to fiscal consolidation because they are not included in “Bonds outstanding of
central and local governments”, which is the benchmark of fiscal consolidation target
Why election risk means yen volatility could rise this weekThe Japanese yen remains vulnerable ahead of Japan’s Upper House election on July 20.
Polls suggest the ruling LDP-Komeito coalition may lose its Upper House majority. Such an outcome would further weaken Prime Minister Shigeru Ishiba’s position, with his government already operating as a minority in the Lower House.
Adding to the pressure, the U.S. is set to impose 25% tariffs on Japanese goods from August 1—part of a broader protectionist push.
NI225 NIKKEI 225 25-7-11Japan stocks remind me the most of this time in 1975, which marked a bottom. It’s not identical at all. Just the closest I could compare it to. It’s at all time highs and after a year or so of consolidation. The thing is now looks even better for a textbook W reversal up now. It’s a striking pattern really you can clearly see it. I wouldn’t be surprised if it makes more spikes back down though also before resuming an upward trend.
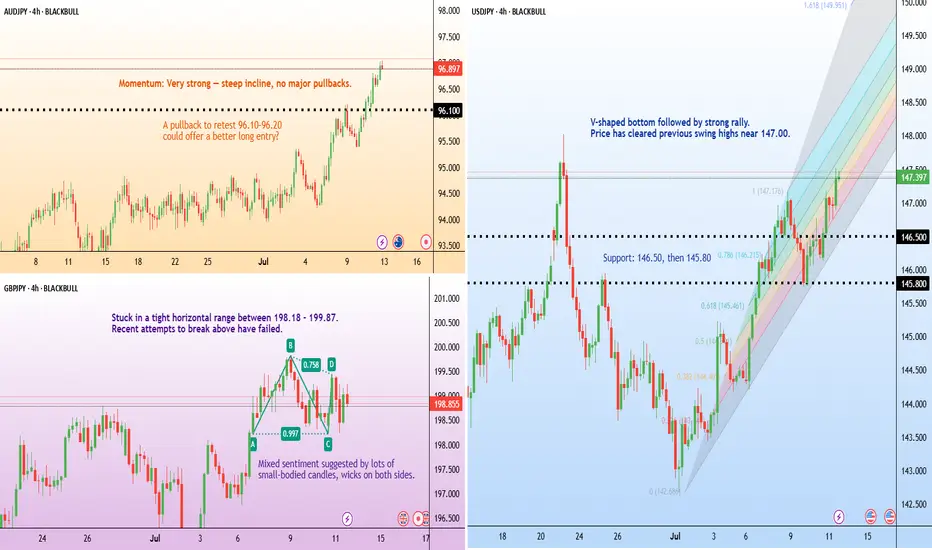
The Chart Says ''Cheer Up Japan'' – JPY Looks Safe📊🇯🇵 The Chart Says "Cheer Up Japan" – JPY Looks Safe 💙✨
There’s been talk, worry, even viral prophecy this week… but I’m here to say:
I read charts — not fear.
And right now, the JPY is showing strength, not weakness.
After running a full scan with my AI-powered Precision Master Mode, the cleanest trade setup aligned with this view is:
AUDJPY SHORT 📉
🗾 Cheer up, Japan — the Yen’s got this.
No panic in the charts. Just structure, volume, and momentum confirming that JPY is holding its ground as a safe-haven currency.
🔍 TRADE SETUP – AUDJPY SHORT
ENTRY: Market (or 94.85 for better R:R)
STOP LOSS: 95.70 (above trap high)
TARGETS:
TP1: 93.50
TP2: 91.57
TP3: 87.84 (macro target)
📈 What the chart shows:
– Strong rejection from top channel zone (structure is King!)
– SuperTrend flip starting on multiple TFs
– VWRSI fading = momentum loss
– Volume Profile confirms resistance
So while the headlines play on emotions, my execution comes from structure.
Let’s ride this JPY strength into next week — calmly, confidently.
📸 Chart attached (8H view – AI tuned)
📰 Article on the 'prophecy' that sparked the buzz:
www.telegraphindia.com
Have a nice weekend Japan and all Asia! After a 'scary prophecy' troubling your minds the weekend can end up being a crazy happy one!
One Love,
The FXPROFESSOR 💙
Disclosure: I am happy to be part of the Trade Nation's Influencer program and receive a monthly fee for using their TradingView charts in my analysis. Awesome broker, where the trader really comes first! 🌟🤝📈

Is Japan's Economic Future at a Tariff Crossroads?The Nikkei 225, Japan's benchmark stock index, stands at a critical juncture, facing significant pressure from potential US tariffs of up to 35% on Japanese imports. This assertive stance by US President Donald Trump has already triggered a notable decline in Japanese equities, with the Nikkei 225 experiencing a 1.1% drop and the broader Topix Index falling 0.6% on Wednesday, marking consecutive days of losses. This immediate market reaction, characterized by a broad-based selloff across all sectors, underscores profound investor concern and a pre-emptive pricing-in of negative outcomes, particularly for the highly vulnerable automotive and agricultural sectors.
The looming July 9 deadline for a trade agreement is pivotal, with President Trump explicitly stating his intention not to extend the current tariff pause. These proposed tariffs would far exceed previous rates, adding substantial financial burdens to industries already facing existing levies. Japan's economy, already struggling with a recent contraction in GDP and persistent declines in real wages, is particularly susceptible to such external shocks. This pre-existing economic fragility implies that the tariffs could amplify existing weaknesses, pushing the nation closer to recession and intensifying domestic discontent.
Beyond immediate trade concerns, Washington appears to be leveraging the tariff threat to compel allies like Japan to increase military spending, aiming for 5% of GDP amidst rising geopolitical tensions. This demand strains the "ironclad" US-Japan military alliance, as evidenced by diplomatic setbacks and Japan's internal political challenges in meeting such ambitious defense targets. The unpredictable nature of US trade policy, coupled with these geopolitical undercurrents, creates a complex environment where Japan's economic stability and strategic autonomy are simultaneously challenged, necessitating significant strategic adjustments in its international relationships.

Nikkei 225 stays bullish as Japan embraces AIWhile most traders have been focused on AI's impact on Western economies, Japan has been quietly chipping away at its own AI revolution. Not by building the flashiest tools, but by embedding AI into the guts of its economy.
Let's start with the obvious. Japan is an industrial giant. Toyota, Fanuc, Sony. These companies aren’t chasing fads. They’re integrating AI into factories, supply chains, and robotics. Not hype but rather real productivity.
The government gets it too. “Society 5.0” isn’t just a slogan. It’s a structural policy push. R&D spending is north of 3% of GDP. That’s capital well spent.
Now the deeper point, demographics. Japan’s working-age population is shrinking. That’s no longer a headwind. It’s fuel. AI offsets labour shortages. Healthcare, logistics, transport. These sectors are being rewired, not disrupted. They’re evolving, and profits will follow.
Then there’s valuation. The Nikkei 225 is still attractive with a forward P/E of around 14x, while the S&P trades above 22x. Yet Japanese firms are global leaders in high-value, AI-relevant sectors. That gap will close.
This is structural, it’s not about today’s trade. It’s about where capital flows over the next five years.
Japan’s quiet, calculated AI pivot is the most underpriced transformation in global markets.
Stay long Nikkei, we expect the 200-day moving average to hold. The re-rating is only beginning.
The forecasts provided herein are intended for informational purposes only and should not be construed as guarantees of future performance. This is an example only to enhance a consumer's understanding of the strategy being described above and is not to be taken as Blueberry Markets providing personal advice.

$JPIRYY -Japan CPI (May/2025)ECONOMICS:JPIRYY
May/2025
source: Ministry of Internal Affairs & Communications
- Japan's annual inflation rate edged down to 3.5% in May 2025 from 3.6% in the previous two months, marking the lowest level since November.
Price growth eased for clothing (2.6% vs 2.7% in April), household items (3.6% vs 4.1%), and healthcare (2.0% vs 2.2%), while education costs fell further (-5.6%). In contrast, inflation held steady for transport (2.7%) and miscellaneous items (1.3%), but accelerated for housing (1.1% vs 1.0%), recreation (3.0% vs 2.7%), and communications (1.9% vs 1.1%).
Meanwhile, prices of electricity (11.3% vs 13.5%) and gas (5.4% vs 4.4%) remained elevated.
On the food side, prices increased by 6.5%, staying at the slowest pace in four months, though rice prices soared over 100%, underscoring the limited impact of government efforts to rein in staple food costs.
Meanwhile, the core inflation accelerated to 3.7% from 3.5% in April, reaching its highest level in over two years, ahead of the summer election.
Monthly, the CPI rose 0.3%, after a 0.1% gain in April.

$JPINTR -Japan Interest Rates (June/2025)ECONOMICS:JPINTR
(June/2025)
source: Bank of Japan
- The Bank of Japan kept its key short-term interest rate unchanged at 0.5% during its June meeting, maintaining the highest level since 2008 and aligning with market expectations.
The unanimous decision underscored the central bank’s cautious stance amid escalating geopolitical risks and lingering uncertainty over U.S. tariff policies, both of which continue to pose threats to global economic growth.
Tokyo and Washington agreed to extend trade talks after failing to achieve a breakthrough during discussions on the sidelines of the G7 Summit in Canada. Meanwhile, as part of its gradual policy normalization, the BoJ reaffirmed its plan to cut Japanese government bond purchases by JPY 400 billion each quarter through March 2026.
Starting April 2026, it will then slow the reduction to JPY 200 billion per quarter through March 2027, targeting a monthly purchase level of around JPY 2 trillion—signaling a measured but steady path away from ultra-loose monetary policy.

USDJPY 1W forecast until September 2025A huge inverted Head&Shoulders has been started. Volatility chop-chop. Left shoulder is ready and the price is heading up to the base at 145.188
In the middle of June we will see a fast fall to print Head bottoming at 138.75
Before printing Right shoulder the price has to visit the base again in the beginning of August 2025
What will happen in September? I will keep posting and updating (if I see necessity) 1W chart here. For 1D weekly updates check 'Also on' in my Profile.

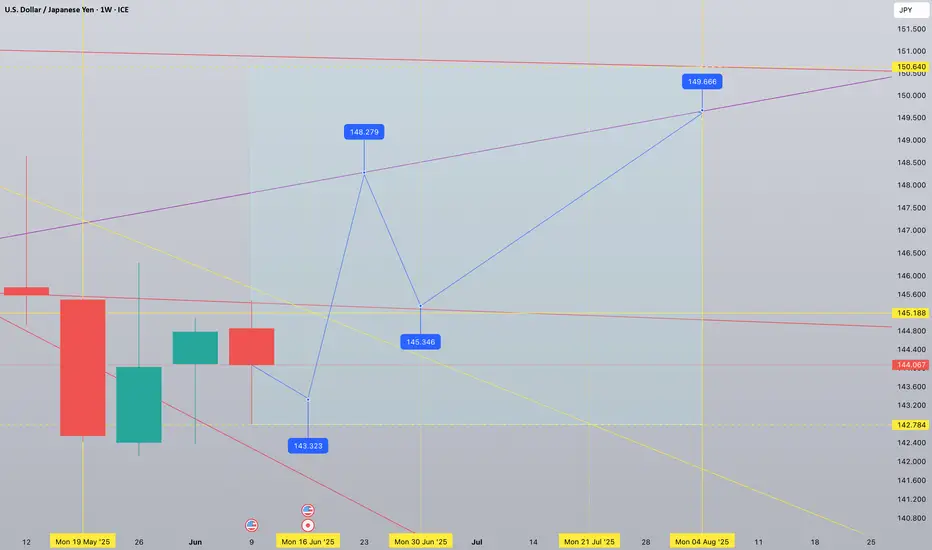
USDJPY 1W tf forecast until August 2025 Current midterm bias is bullish. 150,64 and 142,78 are extreme levels to be respected by the price action. One more week of red week of sideways movement will actually form a reversal pattern followed by a strong upward spike. A powerful breakout to 148,27 is to be retested at 145,34 - healthy retest. July will show an organic growth topping at 149.66 in the beginning of August 2025
(jasmy) jasmy "array"I can't share my indicator ideas unless I publish them publicly. I don't feel like sharing my indicators with the public is necessary so I guess I will not be publishing many new ideas because the Trading View website is removing features where unpublished custom indicators are allowed to be included in sharing. Trading View is too strict and they keep choking the freedoms of watchlist, now indicators, what's next to be taken away from users of the website?

Japan : Q1 2025 GDP Revision: Milder ContractionFinal data for Q1 2025 shows that Japan's economy contracted by 0.2% year-on-year (YoY), better than the initial estimate of -0.7%
(Sources: english.kyodonews.net, reuters.com, fxstreet.com).
Growth in household consumption and an increase in inventory levels were the main drivers, although the export sector remained a drag due to U.S. tariff pressures.
On a quarterly basis (QoQ), the economy recorded flat growth (0.0%), exceeding expectations of a -0.2% contraction
(Sources: reuters.com, fxstreet.com).
In summary: The revision shows that Japan’s economy is not as weak as initially feared, though it still reflects underlying sluggish conditions.

NIKKEI 1W forecast until end of July 2025Broadening wedge formation on the table - a lot of sideways movement within the range of 38,758 and 36,607
Upward momentum will last for a couple of weeks more. The most likely top is 38,758
Starting from second half of June 2025 we may see a start of correction strong, but healthy. Correction/rest bottom is expected in mid July at 37,075 and should not fall deeper than 36,607
Second half of July the index would probably try to climb up to 58,758 with doubtful success.

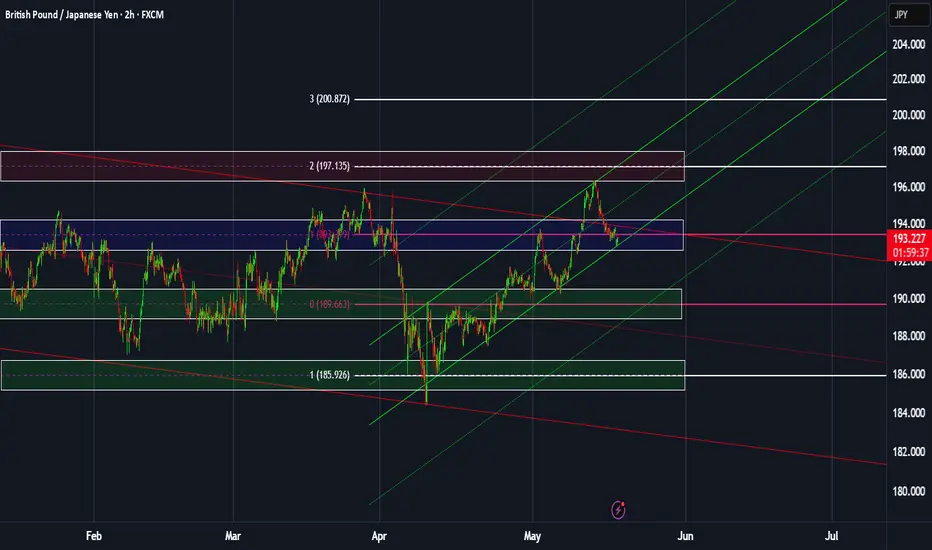
GBPJPY: Weekly overview + Significant zonesHello dear traders,
The indicated levels are determined based on the most reaction points and the assumption of approximately equal distance between the zones.
These points can also be confirmed by the mathematical intervals of Murray.
After reacting to the following zones, you can enter the trade. Place the stop loss slightly above/below the zone to which the reaction was shown. The profit point is the next zone.
The drawn channels and their medians can also be considered as moving support and resistance. I usually use them as target points. I've doubled the short-term channel because it was so thin ;-).
* I don't use 189.663 zone to take short! There are too many moving S&R around it.
This analysis is valid until the end of the week.
**************************************
Important news that could change the direction of the trade:
Wed: Great Britain CPI of April.
$JPIRYY -Japan's CPI (April/2025)ECONOMICS:JPIRYY 3.6%
April/2025
source: Ministry of Internal Affairs & Communications
- Japan's annual inflation rate stood at 3.6% in April 2025,
unchanged from March while remaining at its lowest print since December.
Food prices rose the least in four months (6.5% vs 7.4% in March) even as rice costs jumped 94.8% y-o-y, hitting a new record for the 7th straight month due to poor harvests and rising demand from record tourist numbers.
Price growth also eased for clothing (2.7% vs 3.0%) and household items (4.1% vs 4.5%).
Cost of education fell much steeper (-5.6% vs -1.2%).
In contrast, inflation was stable for transport (at 2.7%) while accelerating for housing (1.0% vs 0.8%), healthcare (2.2% vs 2.0%), recreation (2.7% vs 2.0%), communications (1.1% vs 1.0%), and miscellaneous items (1.3% vs 1.1%).
Prices of electricity (13.5% vs 8.7% ) and gas (4.4% vs 2.4%) rose the most in three months, as the impact of government subsidies faded.
Core inflation climbed to an over 2-year high of 3.5% from 3.2% in March.
Monthly, the CPI rose 0.1%, easing from a 0.3% gain in March.

apan’s Bond Market Is Flashing Alarms – Carry Trade at Risk?🚨 Japan just witnessed its weakest 20-Year Government Bond auction since 1987, triggering a spike in long-dated yields:
📉 Bid-to-cover ratio at lowest since 2012
📉 Tail (spread between avg. & lowest accepted bid) was massive
📈 40Y JGB yield hit all-time highs
📈 30Y at highest since it was introduced in 1999
📈 20Y at highest level since 2000
This is a BIBLICAL move in the JGB complex.
📌 The implications?
Japan’s carry trade—a pillar of global liquidity—could be under pressure
Global bond markets may reprioritize risk
BoJ is walking a tightrope: intervene now or risk a credit crunch later?
