Japan


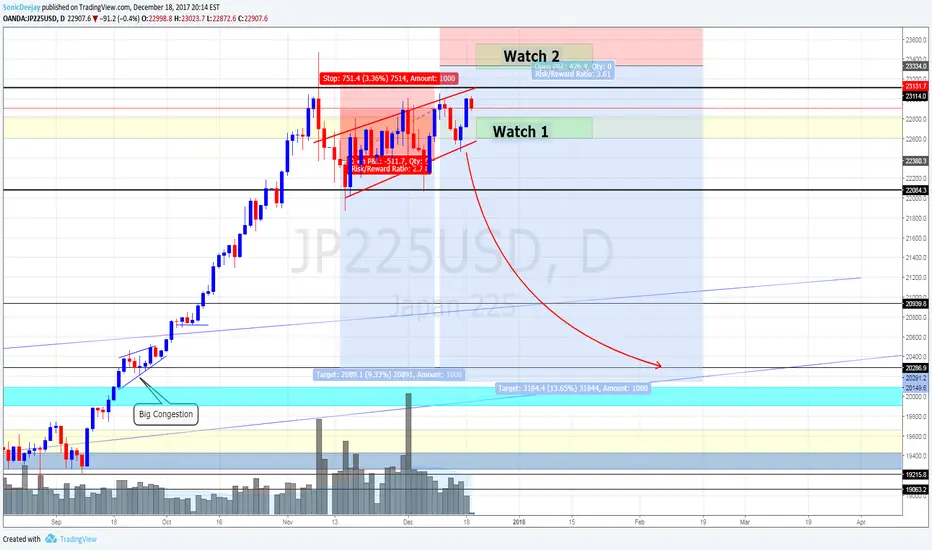
Nikkei (19/12/17) *Bulls are not cowering, Do not add shortNikkei is testing nerve of traders. Markets will not always agree with you.
Remember this is what the market does. Whenever there is a winner, there will always be a loser. We should stay out of the kitchen if we do not like the heat.
Anyway. the bull side is fighting back on Nikkei.
To reaffirm the bearishness, we need to see 22,600 level (watch 1)need to get broken again.
Do not add short as this moment. To throw the towel on the bear side. the level need to break strongly above (watch 2) first.
Trade Safe and read the disclaimer, too,
s0nic
Disclaimer:
The information contained in this presentation is solely for educational purposes, and does not constitute investment advice.
The risk of trading in securities markets can be substantial. You should carefully consider if engaging in such activity is suitable to your own financial situation.
SonicrMastery.com is not responsible for any liabilities arsing on the result of your market involvement or individual trade activities.
Nikkei Japan Index (15/12/17) *BEAR BEARDo not be so bothered a daily nomial swing. It is the best way to get high blood pressure.
I am still standing with BEAR and I am waiting for my BIG pay day.
Let's see. I can be wrong as well.
Trade Safe and read the disclaimer, too,
s0nic
Disclaimer:
The information contained in this presentation is solely for educational purposes, and does not constitute investment advice.
The risk of trading in securities markets can be substantial. You should carefully consider if engaging in such activity is suitable to your own financial situation.
SonicrMastery.com is not responsible for any liabilities arsing on the result of your market involvement or individual trade activities.

Buy TDK - a clear winner in the rechargeable battery marketTaking advantage of this week's mini wobble to get in to a core long for me...TDK
Nikkei news out on Monday already pushing OP estimates up towards the 120bn yen mark whilst street is still sat around 86.4bn yen
Q2 results were very strong with OP coming in c.14% above estimates and also revised OP guidance to Y85m (where street is)
Think good chance of an upside here and one of the best ways to get access to the rechargeable battery theme alongside auto applications and MLCCs


CAD/JPY: finally SHORTConfluences:
1/ Trend
2/ Fib play
3/ 91 as resistance
4/ High test candle ( 2 in a row )
5/ Bearish MACD
6/ We are bouncing of the 200 EMA on the Weekly chart
After day one of the trade, U can see that we broke the CTL, which is a great sign for this pair to finally head lower again.
It is not too late to enter, because today we got a pullback.
Target 89

Short on GBPJPYLooking for set up on this pair, after a quick rally just for speculation and some newbies from Europe's Bank who put too much money on it misleading calculation, this strong pair is now into Chinese shoes and that's the reason why is not going down as rejection, 'cause already broke the zone. However market's pressure is bearish.
Have a Good Weekend!
Cream Live Trading, Cheers!

Possible Short Position on GBPJPYNice Hawk to ride on. Almost ready to pull the trigger.
Easy but slow movement with Target around 142.260.
Converge with YEN majors pairs.
Have a Good Trading Week!
Cream Live Trading, Cheers!

Possible Short Position on EURJPYThis Pair is struggling a bit into this level, but has a large downside potential to pull the trigger, sell an hold 125.062 seems to be a clear level to find rejection so good to close position then. Convergence with GBP and USD.
Have a Good Trading Week
Cream Live Trading, Cheers!

Nikkei Daily Update (10/11/17)23,000 acting as a nice retracement.
Support at 22,000
Awaiting retracement for a better low risk entry trade.
Disclaimer :
This analysis does not include personal feeling/opinion, and pure base on technical analysis
Trading foreign currencies can be a challenging and potentially profitable opportunity for investors. However, before deciding to participate in the Forex market, you should carefully consider your investment objectives, level of experience, and risk appetite. Most importantly, do not invest money you cannot afford to lose

Big Possible Short Position on USDJPYBig possible short position on FX:USDJPY this pair is showing something else that numbers doesn't match in the equation, this is a warn issue to consider, 'cause seems to be hard for the pair do what it has to do, that's why I draw a vertical line in case of price should touch that levels into that period of time. In case it doesn't we may see a big impact news like a war or something else. I'll keep an eye on this pair, but on TVC:USOIL and FX_IDC:XAUUSD too, because they are following other kind of structures and levels in the wrong time.
Have a good Trading Week...
Cream Live Trading, Cheers!

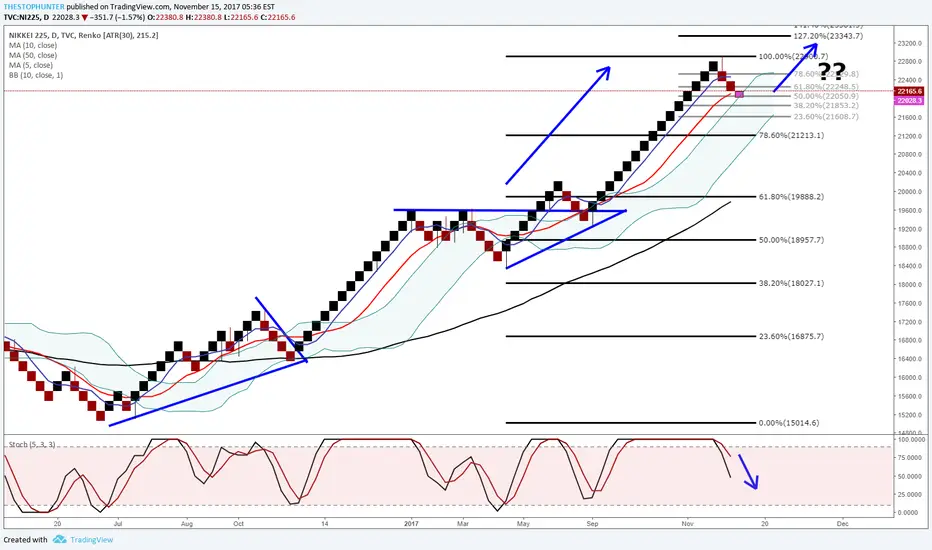
Nikkei end of the bull run or taking a breather?Has the #nikkei 225 recent spectacular bullish run come to an end, or just taking a breather before moving higher again? Momentum currently bearish as approaching psychological 22000 number. Cur trading 22028
Nikkei (15/11/17) *Our Sell Setup is paying us wellDid you follow our previous analysis?
We are in the BEAR mode and it is getting more obvious.
We suggest you to stay in BEAR side.
If there is any swing up, 22600 to 22800 region will be a good resistant regions.
Trade Safe,
S0nic
Disclaimer:
The information contained in this presentation is solely for educational purposes, and does not constitute investment advice.
The risk of trading in securities markets can be substantial. You should carefully consider if engaging in such activity is suitable to your own financial situation.
Sonicr Mastery is not responsible for any liabilities arsing on the result of your market involvement or individual trade activities.

EURJPY Possible Long PositionPossible long position . We have >1.5% upside potential movement on FX:EURJPY Clusters should be broken and go straight to 133.385 with rejections making 3 waves from now.
Have a good Weekend
Cream Live Trading, Cheers!


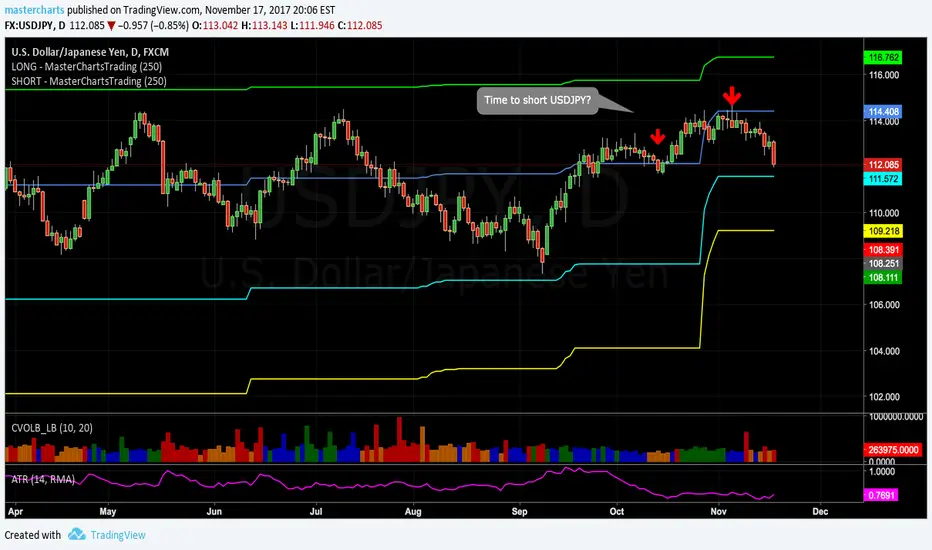
USDJPY ShortAs stated above, USDJPY is primed to short. Dollar is weak and the Yen has been sold off for far too long. USA political uncertainty and tax reform debacle will cause the already wobbling dollar to stumble further.

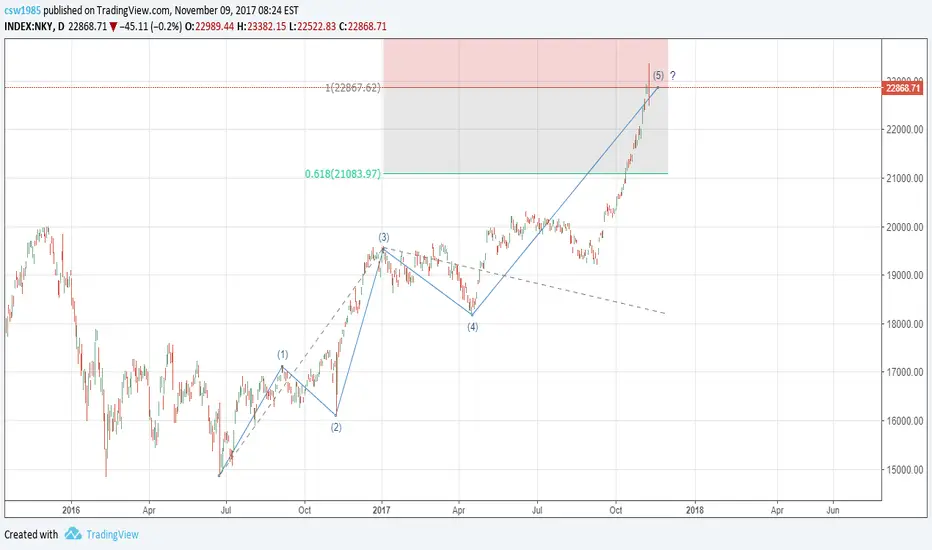
NiKKei topping An outside bar formed right on a possible target of wave 5 today (wave 5= wave 1+wave 3)
other markets to follow soon?!!


White House investigation is back to headlinesAsian markets gained on Tuesday dismissing weak factory data in the Chinese economy while the dollar has decided to hold up with growth, as the investigation into Russia’s meddling wth the US presidential election led to former campaign manager Manafort charged with money laundering and tax evasion, promising more intriguing data on possible POTUS collusion with Russians.
«Hunt for Russians" has long been a wandering pain for the US currency, eroding its strength time to time. This time investigators reached lobbyist Paul Manafort, former head of Trump's election campaign, charging him with conspiracy, money laundering and tax evasion. The Democrats hope that Manafort and his team members will prove to be a weak link in Moscow's involvement in the presidential election, as the long accusatory list promises many valuable details and possibly cooperation on his part.
The Korean KOSPI index rose 1% to a new high after Seoul and Beijing made concessions to each other on the deployment of US air defense in South Korea, which China regarded as a violation of the military balance in the region.
Wall Street retreated from the highs of Monday upset that US lawmakers can switch to the path of gradual changes instead of a one-time cut in the tax reform which is currently under discussion. Stock markets met the news swaying at record highs, what led to decrease to a more stable levels. The dollar witnessed some selloff for the second day in a row after the rally rested in a 3-month high at 95.00. Long positions from current levels may be unsafe, since the US currency will probably experience a more serious pullback on the White House investigation before rising again on expectations of reflation.
The US currency was also under fire on reports that Trump will opt for Jeremy Powell as next Fed fead, not quite market-friendly candidate, who is regarded the most dovish candidate among all. His most likely competitor to this position is economist John Taylor, known for his Taylor rule in the matter of the pace of money supply expansion in the economy.
The Japanese yen slightly reacted to the CB decision to keep QE unchanged, while the inflation forecast for the current fiscal year was reduced, which became a bearish signal for the yen. Markets hoped for QE cues from the board newcomer Gushi Kataoka, who last time took swipes on the absence of changes in bond-buying program. However, he limited himself to the statement that the Bank of Japan should make it clear about its commitment to stimulate economy in order to maintain the yields of debt market at a key level of 0 percent.
The Bank of Japan still hopes to achieve a target inflation rate of 2% by 2020.
Arthur Idiatulin
