USDJPY: The Fed & BOJ Likely To Keep Rates In Place. Buy It!Welcome back to the Weekly Forex Forecast for the week of July 28 - Aug 1st.
In this video, we will analyze the following FX market:
USDJPY
The FED and BOJ are expected to keep their perspective interest rates, come Wednesday. The USD is stabilizing, a US-Japanese tariff deal inked, and investors are slowing moving money from the Yen safe haven to riskier assets.
Look for USDJPY to slowly move higher.
Enjoy!
May profits be upon you.
Leave any questions or comments in the comment section.
I appreciate any feedback from my viewers!
Like and/or subscribe if you want more accurate analysis.
Thank you so much!
Disclaimer:
I do not provide personal investment advice and I am not a qualified licensed investment advisor.
All information found here, including any ideas, opinions, views, predictions, forecasts, commentaries, suggestions, expressed or implied herein, are for informational, entertainment or educational purposes only and should not be construed as personal investment advice. While the information provided is believed to be accurate, it may include errors or inaccuracies.
I will not and cannot be held liable for any actions you take as a result of anything you read here.
Conduct your own due diligence, or consult a licensed financial advisor or broker before making any and all investment decisions. Any investments, trades, speculations, or decisions made on the basis of any information found on this channel, expressed or implied herein, are committed at your own risk, financial or otherwise.
Japaneseyen

JP225 Long Trap or Bull Escape? Heist in Motion.🦹♂️🎯 JP225 Ninja Heist: Breakout Loot Plan 💥💰 (Long Game Playbook)
🌟Hi! Hola! Ola! Bonjour! Hallo! Assallamu Allaikum!🌟
Dear Money Makers, Market Raiders & Silent Robbers, 🤑💰💸✈️
It’s time to gear up for the ultimate breakout heist on the JP225 / NIKKEI Index CFD Market. Based on my 🔥Thief Trading style🔥—a mix of slick technical strategy and deep fundamental recon—this operation is primed for a bullish break-in.
🧠 Plan of Attack:
Our team is targeting a long-side entry only, aiming to loot the market before it hits the Electric Trap Resistance Zone ⚡—a known danger zone where big bears lie in wait. Let’s outsmart them!
🚪 Entry Plan – The Door to Gold
📈 "The heist is on once we crack that resistance vault!"
📍Trigger: Wait for candle close above 40,100 – that's your breakout cue.
🧲Pullback Setup: Place Buy Limit near recent swing low on the 15/30 min timeframe, or stack multiple DCA-style orders to scale in silently.
🔔 Don’t forget to set alerts—you snooze, you lose.
🛡️ Stop Loss – Don’t Get Caught
🛑 "Keep your escape plan ready, always!"
📍Preferred SL: Recent swing low on 4H timeframe @ 39,500
🎯 Adjust based on your risk level and lot sizing.
🧠 Smart robbers move stop loss only after breakout confirmation—don’t let hesitation cost you your cut.
🎯 Profit Target – Secure the Bag
🏴☠️ Escape Plan: Aim for 41,200 or bail early if the scene gets messy.
Use trailing SLs to protect your stash.
Scalpers, only play long side. Let the swing traders set the traps while you slice the pie.
📊 Why This Trade Works:
JP225 is currently fueled by:
🔼 Strong bullish momentum
🔍 Technical breakout setup
💹 Fundamental backdrop: macro trends, institutional flow, COT report, and global sentiment lining up like guards on break
🗞️ Want more intel? Check out the broaderr macroeconomic, sentiment, and positioning insights 🔗🔗🔗
⚠️ Risk Management Alert:
📰 During news hours, don’t act greedy.
❌ Avoid entries near big news drops.
✅ Use trailing SLs to protect profits from volatility whiplash.
❤️ Robbery Crew Boost Request
💥Hit that Boost if this plan helps you grab the market loot!
Let’s grow our Thief Trading Army together—every trader deserves a smooth escape and a fat wallet 🏆💪💸
📌 Disclaimer: This is not financial advice. Just a masterplan from a fellow market raider. Adapt your risk and strategy based on your own style. Markets can flip faster than you can say “bank run”—stay updated, stay sharp, and stay stealthy. 🕶️
🎭 See you at the next heist.

USD/JPY: A Bullish Thesis for Trend ContinuationThis analysis outlines a data-driven, bullish thesis for USD/JPY, identifying a strategic long entry within an established market trend. The setup is supported by a combination of fundamental catalysts and a clear technical structure.
📰 The Fundamental Picture
The primary driver for this trade will be the high-impact US economic data scheduled for release. This release is expected to inject significant volatility into the market. Fundamentally, this trade is a play on the deep policy differences between the US Federal Reserve and the Bank of Japan. While the Fed's future steps are a topic of debate, the Bank of Japan's policy remains one of the most accommodative in the world, creating a long-term headwind for the Japanese Yen. This dynamic provides a strong fundamental basis for relative US Dollar strength against the Yen.
📊 The Technical Structure
Chart analysis reveals that USD/JPY is in a confirmed and healthy uptrend. The current price action indicates a constructive pullback, presenting a strategic opportunity to join the dominant trend at a favorable price. The proposed entry point is positioned at a key technical level that offers a low-risk entry. Technical indicators support the continuation of the trend, suggesting that momentum remains with the bulls.
✅ The Trade Plan
This trade is structured with a clear and favorable risk-to-reward profile, aiming to capitalize on the established trend.
👉 Entry: 146.343
⛔️ Stop Loss: 145.233
🎯 Take Profit: 148.560
⚖️ Risk/Reward Ratio: 1:2

EUR/JPY: Bullish Thesis on Policy DivergenceOur primary thesis is built on a powerful confluence of compelling fundamental drivers and a clear technical structure. We are taking a long position in EUR/JPY with high conviction, anticipating significant upside fueled by a stark monetary policy divergence confirmed by a constructive chart formation.
📰 Fundamental Analysis: The core of this trade is the widening policy gap between the European Central Bank (ECB) and the Bank of Japan (BoJ). While the BoJ is only just beginning to exit its ultra-loose monetary policy, the global environment points toward continued JPY weakness. The upcoming high-impact US news will act as a major catalyst. A "risk-on" reaction to the data would significantly weaken the JPY, providing a strong tailwind for this trade.
📊 Technical Analysis: The chart structure for EUR/JPY is decidedly bullish. The pair has established a clear uptrend, and recent price action indicates a period of healthy consolidation above key support levels. This presents a strategic entry point, as the market appears to be gathering momentum for the next leg higher. The current setup suggests a low-risk entry into a well-defined upward trend.
🧠 The Trade Plan: Based on this synthesis, we are executing a precise trade with a favorable risk profile.
👉 Entry: 172.422
⛔️ Stop Loss: 171.292
🎯 Take Profit: 174.684
⚖️ Risk/Reward: 1:2

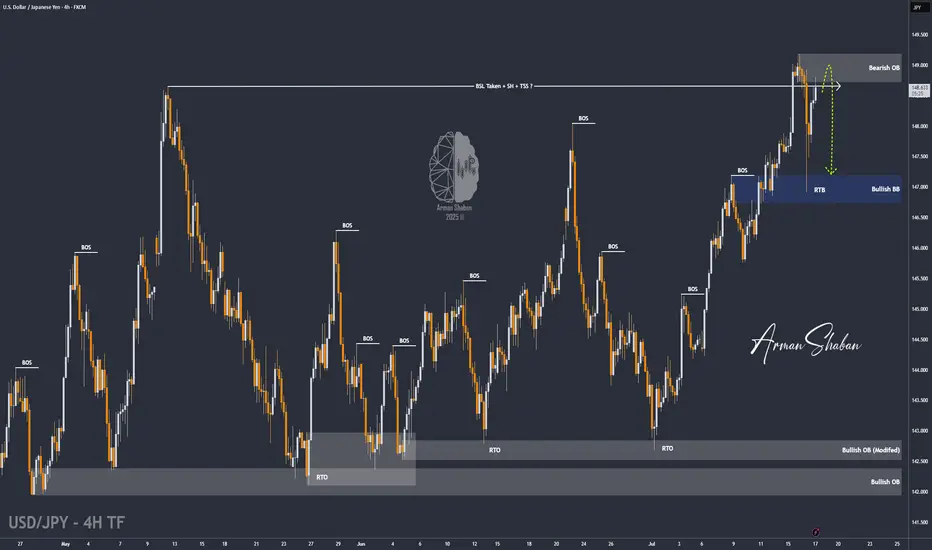
USD/JPY : Get Ready for another Fall ! (READ THE CAPTION)By analyzing the USDJPY chart on the 4-hour timeframe, we can see that after our last daily timeframe analysis, the price started its rally from the 144 zone and, as expected, hit all three targets at 145.5, 147.35, and 148.65, delivering over 500 pips in returns — even reaching as high as 149.2! Once the price broke above 148.65 and swept the liquidity above this level, it faced selling pressure and dropped to 146.9. Currently trading around 148.65, if USDJPY manages to hold below the supply zone between 148.65 and 149.2, we can expect further downside movement. This analysis will be updated with your support!
THE DAILY ANALYSIS :
Please support me with your likes and comments to motivate me to share more analysis with you and share your opinion about the possible trend of this chart with me !
Best Regards , Arman Shaban
CHF is the new gold? Safe-haven flows keep pressure on USDCHFBank of America argues that the Swiss franc has reasserted itself as the true safe-haven hedge.
BofA says the trend of the CHF being used more like gold, and a hedge against problems like rising US debt, could continue. Unlike the yen, which has lost much of its appeal as a pure haven.
Technically, recent candles might indicate buyers are attempting to build a base, but there’s no decisive reversal yet.
Should price fail to reclaim the 0.8030–0.8050 region soon, the broader bearish structure could resume - possibly testing fresh lows. Meanwhile, rallies in USD/CHF may face pressure as the franc’s macro backdrop continues to attract inflows.

The Chart Says ''Cheer Up Japan'' – JPY Looks Safe📊🇯🇵 The Chart Says "Cheer Up Japan" – JPY Looks Safe 💙✨
There’s been talk, worry, even viral prophecy this week… but I’m here to say:
I read charts — not fear.
And right now, the JPY is showing strength, not weakness.
After running a full scan with my AI-powered Precision Master Mode, the cleanest trade setup aligned with this view is:
AUDJPY SHORT 📉
🗾 Cheer up, Japan — the Yen’s got this.
No panic in the charts. Just structure, volume, and momentum confirming that JPY is holding its ground as a safe-haven currency.
🔍 TRADE SETUP – AUDJPY SHORT
ENTRY: Market (or 94.85 for better R:R)
STOP LOSS: 95.70 (above trap high)
TARGETS:
TP1: 93.50
TP2: 91.57
TP3: 87.84 (macro target)
📈 What the chart shows:
– Strong rejection from top channel zone (structure is King!)
– SuperTrend flip starting on multiple TFs
– VWRSI fading = momentum loss
– Volume Profile confirms resistance
So while the headlines play on emotions, my execution comes from structure.
Let’s ride this JPY strength into next week — calmly, confidently.
📸 Chart attached (8H view – AI tuned)
📰 Article on the 'prophecy' that sparked the buzz:
www.telegraphindia.com
Have a nice weekend Japan and all Asia! After a 'scary prophecy' troubling your minds the weekend can end up being a crazy happy one!
One Love,
The FXPROFESSOR 💙
Disclosure: I am happy to be part of the Trade Nation's Influencer program and receive a monthly fee for using their TradingView charts in my analysis. Awesome broker, where the trader really comes first! 🌟🤝📈

July 7 - 11th: Sell The RIPs, Buy The DIPs! (PART 2)Welcome back to the Weekly Forex Forecast!
This is Part 2 of the FOREX futures outlook for the week of July 7 - 11th.
In this video, we will analyze the following FX markets:
CHF and JPY
Last Friday was a bank holiday, so the price action is discounted. This Monday has no red folders on the calendar, so the environment is set for a day of misdirection. Be careful to take only trades that confirm your directional bias!
USD is still weak, and analyst have determined the FED will put off cutting rates until September. Tariffs wars may start up again July 9th. And Trumps Bill can add 3+ trillion to the debt.
None of this supports the USD!
Look to buy the dips xxx USD, and look to sell the rips vs USD xxx.
Enjoy!
May profits be upon you.
Leave any questions or comments in the comment section.
I appreciate any feedback from my viewers!
Like and/or subscribe if you want more accurate analysis.
Thank you so much!
Disclaimer:
I do not provide personal investment advice and I am not a qualified licensed investment advisor.
All information found here, including any ideas, opinions, views, predictions, forecasts, commentaries, suggestions, expressed or implied herein, are for informational, entertainment or educational purposes only and should not be construed as personal investment advice. While the information provided is believed to be accurate, it may include errors or inaccuracies.
I will not and cannot be held liable for any actions you take as a result of anything you read here.
Conduct your own due diligence, or consult a licensed financial advisor or broker before making any and all investment decisions. Any investments, trades, speculations, or decisions made on the basis of any information found on this channel, expressed or implied herein, are committed at your own risk, financial or otherwise.

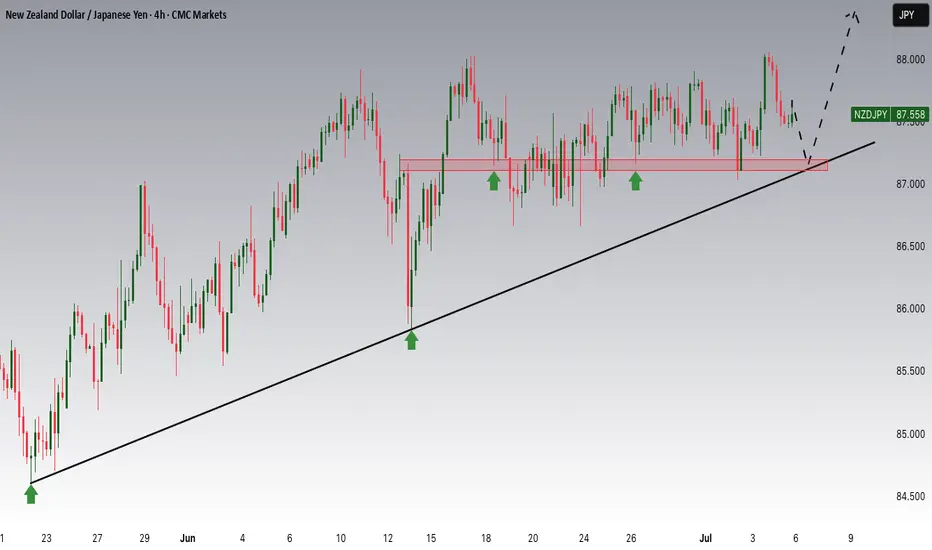
NZDJPY Potential UpsidesHey Traders, in the coming week we are monitoring NZDJPY for a buying opportunity around 87.200 zone, NZDJPY is trading in an uptrend and currently is in a correction phase in which it is approaching the trend at 87.200 support and resistance area.
Trade safe, Joe.
"(NZD/JPY) Kiwi-Yen Bandit Trade: Steal 200+ Pips This Week!"🚨 NZD/JPY Bank Heist: Loot the Kiwi-Yen Rally Before the Cops Arrive!
🌟Hola! Kia ora! Konnichiwa! Hello, thieves! 🌟
Attention all market bandits & profit pirates! 🏴☠️💰
Your favorite 🔥Thief Trading Crew🔥 is back with another high-stakes forex robbery—this time targeting the NZD/JPY "Kiwi vs Yen" vault!
🔓 The Master Plan:
Long entry = Our golden key to the bank.
Target: The high-risk Yellow ATR line (where traps lurk, but so do MASSIVE profits!).
Danger zone: Overbought signals, bearish ambushes, fakeouts—but we steal smarter!
📈 Entry Point:
"Vault doors cracked open—swipe those bullish gains NOW!"
👉 Pro thief move: Set buy limits near 15-30min swing lows/highs for sneaky pullback entries.
🛑 Stop Loss (Escape Route):
Thief SL: Hide below the 4H moving average (85.800).
Adjust based on your risk appetite & loot size.
🎯 Take Profit: 88.500 (Time to vanish with the cash!)
⚡ Scalpers’ Corner:
Only scalp LONG—no bearish bets!
Big stacks? Raid the market now.
Small budget? Join swing traders & execute the heist slow & steady.
Trailing SL = Your getaway driver. 🚗💨
💡 Why NZD/JPY?
Bullish momentum fueled by:
Fundamentals (COT data, macro trends)
Market sentiment & intermarket flows (Full analysis in bi0 linkks! 🔗👉👉👉)
⚠️ Heist Alert! News = Police sirens! 📢🚨
Avoid new trades during high-impact news.
Trailing stops = Your invisibility cloak.
💖 Support the Crew!
SMASH THAT BOOST BUTTON! 💥
Help us dominate the charts & loot daily with the Thief Trading Style! 💰🔥
Next heist coming soon… Stay sharp, thieves! 😎🔪

CHFJPY: Massive bullish breakout taking place.CHFJPY is highly overbought on its 1D technical outlook (RSI = 77.325, MACD = 1.496, ADX = 39.317), having crossed above its 1 year High (R1), staging a bullish breakout much like April 28th 2023. This is a direct outcome of the 1D Golden Cross, following also 1 year of accumulation. A 1W closing over the R1 validates a bullish extension to the 2.0 Fibonacci (TP = 194.000).
See how our prior idea has worked out:
## If you like our free content follow our profile to get more daily ideas. ##
## Comments and likes are greatly appreciated. ##

$JPIRYY -Japan CPI (May/2025)ECONOMICS:JPIRYY
May/2025
source: Ministry of Internal Affairs & Communications
- Japan's annual inflation rate edged down to 3.5% in May 2025 from 3.6% in the previous two months, marking the lowest level since November.
Price growth eased for clothing (2.6% vs 2.7% in April), household items (3.6% vs 4.1%), and healthcare (2.0% vs 2.2%), while education costs fell further (-5.6%). In contrast, inflation held steady for transport (2.7%) and miscellaneous items (1.3%), but accelerated for housing (1.1% vs 1.0%), recreation (3.0% vs 2.7%), and communications (1.9% vs 1.1%).
Meanwhile, prices of electricity (11.3% vs 13.5%) and gas (5.4% vs 4.4%) remained elevated.
On the food side, prices increased by 6.5%, staying at the slowest pace in four months, though rice prices soared over 100%, underscoring the limited impact of government efforts to rein in staple food costs.
Meanwhile, the core inflation accelerated to 3.7% from 3.5% in April, reaching its highest level in over two years, ahead of the summer election.
Monthly, the CPI rose 0.3%, after a 0.1% gain in April.

AUDJPY: Sell opportunity.AUDJPY is basically neutral on its 1D technical outlook (RSI = 56.422, MACD = 0.430, ADX = 19.989), ranging inside the 1D MA200 and 1D MA50 since the start of May. The last bullish wave top of the Channel Down got rejected around those levels and targeted the S1 Zone. Short, TP = 90.150.
## If you like our free content follow our profile to get more daily ideas. ##
## Comments and likes are greatly appreciated. ##

$JPINTR -Japan Interest Rates (June/2025)ECONOMICS:JPINTR
(June/2025)
source: Bank of Japan
- The Bank of Japan kept its key short-term interest rate unchanged at 0.5% during its June meeting, maintaining the highest level since 2008 and aligning with market expectations.
The unanimous decision underscored the central bank’s cautious stance amid escalating geopolitical risks and lingering uncertainty over U.S. tariff policies, both of which continue to pose threats to global economic growth.
Tokyo and Washington agreed to extend trade talks after failing to achieve a breakthrough during discussions on the sidelines of the G7 Summit in Canada. Meanwhile, as part of its gradual policy normalization, the BoJ reaffirmed its plan to cut Japanese government bond purchases by JPY 400 billion each quarter through March 2026.
Starting April 2026, it will then slow the reduction to JPY 200 billion per quarter through March 2027, targeting a monthly purchase level of around JPY 2 trillion—signaling a measured but steady path away from ultra-loose monetary policy.

CHFJPY - Warm up in ScalpingSo, with this beautiful structure,
We can just scalp! Our Scalp Position:
Entry: 176.168
TP: 175.251
SL: 177.083
Ratio 1.00
Good Luck!

GBPJPY Strong rebound. Buy opportunity.The GBPJPY pair has been trading within an Ascending Triangle pattern. Today's geopolitics made the price form its latest Higher Low at the bottom of the pattern, which also coincided with a 4H MA200 (orange trend-line) test, and rebounded.
That was a clear buy signal on the 4H RSI Support that signaled the last three bottom buys. Our Target is the top of the pattern at 196.300.
-------------------------------------------------------------------------------
** Please LIKE 👍, FOLLOW ✅, SHARE 🙌 and COMMENT ✍ if you enjoy this idea! Also share your ideas and charts in the comments section below! This is best way to keep it relevant, support us, keep the content here free and allow the idea to reach as many people as possible. **
-------------------------------------------------------------------------------
Disclosure: I am part of Trade Nation's Influencer program and receive a monthly fee for using their TradingView charts in my analysis.
💸💸💸💸💸💸
👇 👇 👇 👇 👇 👇

USDJPY Strong support formed. Excellent buy opportunity.The USDJPY pair is trading within a Channel Down since the start of the year but following the April 22 Low, it has been rising on Higher Lows. Today that trend-line was tested and again produced a rebound (so far).
Since the April 22 Low was very close to the 139.600 Support (from the September 16 2024 Low), there are higher probabilities that we will have a trend change to bullish, at least for the medium-term.
The natural Resistance now is the 1D MA200 (orange trend-line), so we will target just below it at 148.675 (Resistance 1).
-------------------------------------------------------------------------------
** Please LIKE 👍, FOLLOW ✅, SHARE 🙌 and COMMENT ✍ if you enjoy this idea! Also share your ideas and charts in the comments section below! This is best way to keep it relevant, support us, keep the content here free and allow the idea to reach as many people as possible. **
-------------------------------------------------------------------------------
Disclosure: I am part of Trade Nation's Influencer program and receive a monthly fee for using their TradingView charts in my analysis.
💸💸💸💸💸💸
👇 👇 👇 👇 👇 👇

USDJPY: Bottom formation successful. Strong buy.USDJPY is neutral on its 1D technical outlook (RSI = 46.191, MACD = -0.020, ADX = 12.744) as it is consolidating around the 1D MA50. This is the bottom formation process straight after rebounding on the S1 Zone. The wider pattern is a Descending Triangle and the bottom formation suggests that the new bullish wave is about to be initiated. Go long and target the 0.618 Fibonacci level (TP = 153.500).
## If you like our free content follow our profile to get more daily ideas. ##
## Comments and likes are greatly appreciated. ##

USDJPY - MR.GRINGO ThinkingsHello everybody.
Today, we have some discussion about this pair but only with using Technical ways.
The pair right now is very long, maybe 80 days' time period in trouble situation. I mean, the bears have the market of it...
As we see, this 80 day was so strong bearish range, but it's great try for bulls now!
We may have a hope, the price will go up with this next side of the acceding triangular figures.
We may open long position on the price 143.603 or Just make entry for long now.
If you will follow this trading idea, there we will have "the main" resistance levels.
They are...
1. 145.735
2. 146.892
3. 148.048 yes. so I recommend this price levels, because the market will check it maybe later... For sure if you think buy.
Have a profit maker day! :) ^)

EURJPY Be ready to sell soon.Last time we looked at the EURJPY pair (February 26, see chart below), we gave a clear buy signal that wasted no time hitting straight our 162.250 Target:
With the Lower Highs trend-line now broken, a new pattern has emerged and that's a (blue) Channel Up. The current Bullish Leg is headed straight to the 8-month Resistance Zone, so we will be turning bearish there, targeting the 1D MA200 (orange trend-line) at 162.250.
-------------------------------------------------------------------------------
** Please LIKE 👍, FOLLOW ✅, SHARE 🙌 and COMMENT ✍ if you enjoy this idea! Also share your ideas and charts in the comments section below! This is best way to keep it relevant, support us, keep the content here free and allow the idea to reach as many people as possible. **
-------------------------------------------------------------------------------
💸💸💸💸💸💸
👇 👇 👇 👇 👇 👇

EURJPY: Well supported Channel Up aiming for 166.700.EURJPY is bullish on its 1D technical outlook (RSI = 58.535, MACD = 0.340, ADX = 24.438) and is staging right now a rebound on the 1D MA50. This comes only days after the 1D MA200 HL rebound tight at the bottom of the Channel Up. This is a great opportunity to buy and aim for the R1 level (TP = 166.700).
## If you like our free content follow our profile to get more daily ideas. ##
## Comments and likes are greatly appreciated. ##

USDJPY Tests Channel Support After ADP Shock — Rebound Ahead?In the last hour's candle after the ADP Non-Farm Employment Change Index was released, USDJPY ( FX:USDJPY ) started to fall, but considering the position of this pair, I think we can have a good Risk-To-Reward even if the Stop Loss (SL) is touched.
USDJPY is trading near the lower line of the ascending channel and the Support zone(143.870 JPY-143.430 JPY) .
From an Elliott Wave perspective , USDJPY appears to be completing a corrective pattern .
I expect USDJPY to rise at least to the Potential Reversal Zone(PRZ) .
Note: Stop Loss = 143.220 JPY
Please respect each other's ideas and express them politely if you agree or disagree.
U.S. Dollar/Japanese Yen Analyze (USDJPY), 1-hour time frame.
Be sure to follow the updated ideas.
Do not forget to put a Stop loss for your positions (For every position you want to open).
Please follow your strategy and updates; this is just my Idea, and I will gladly see your ideas in this post.
Please do not forget the ✅' like '✅ button 🙏😊 & Share it with your friends; thanks, and Trade safe.

GBPJPY - BEARISH MOVE !Hello Traders !
The GBPJPY failed to create a new higher high!
The price broke the higher low (change of character).
So, I expect a bearish move📉
______________
TARGET: 192.790🎯
