EUR JPY TECHHello dear traders :) It's time to share my new tech!
As we see here we have many reasons to think its ok position to open Long EURJPY
We got a strong uptrend here. We have 16 days LONG strong up channel in this pair. also a nice support point inside.
Our trades price target is near +60 pips (Take Profit).
If you have any Questions? Ask me!
FxCROWN :)
Thank you
Japaneseyen

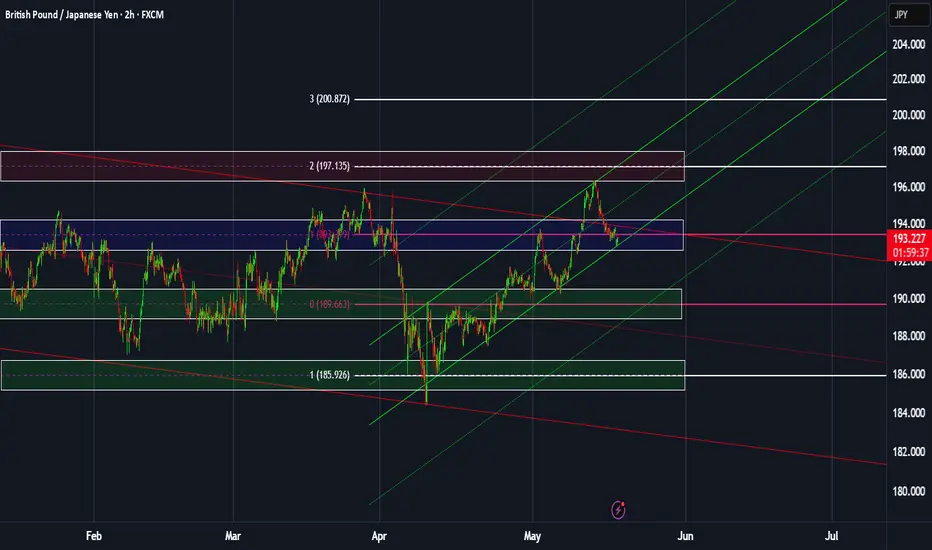
GBPJPY: Weekly overview + Significant zonesHello dear traders,
The indicated levels are determined based on the most reaction points and the assumption of approximately equal distance between the zones.
These points can also be confirmed by the mathematical intervals of Murray.
After reacting to the following zones, you can enter the trade. Place the stop loss slightly above/below the zone to which the reaction was shown. The profit point is the next zone.
The drawn channels and their medians can also be considered as moving support and resistance. I usually use them as target points. I've doubled the short-term channel because it was so thin ;-).
* I don't use 189.663 zone to take short! There are too many moving S&R around it.
This analysis is valid until the end of the week.
**************************************
Important news that could change the direction of the trade:
Wed: Great Britain CPI of April.
GBPJPY Channel Down making a Lower High rejectionThe GBPJPY pair rose aggressively since the last time we gave our buy signal (April 11, see chart below), quickly hitting our conservative 109.250 Target:
The price has since made a Lower High rejection at the top of the Channel Down but remains supported by the 1D MA50 (blue trend-line). Once broken and it closes a 1D candle below it, we will have bearish break-out signal. Our Targe will be 185.250, which will be the standard -5.85% decline that all 3 previous Bearish Legs had within the Channel Down.
-------------------------------------------------------------------------------
** Please LIKE 👍, FOLLOW ✅, SHARE 🙌 and COMMENT ✍ if you enjoy this idea! Also share your ideas and charts in the comments section below! This is best way to keep it relevant, support us, keep the content here free and allow the idea to reach as many people as possible. **
-------------------------------------------------------------------------------
💸💸💸💸💸💸
👇 👇 👇 👇 👇 👇

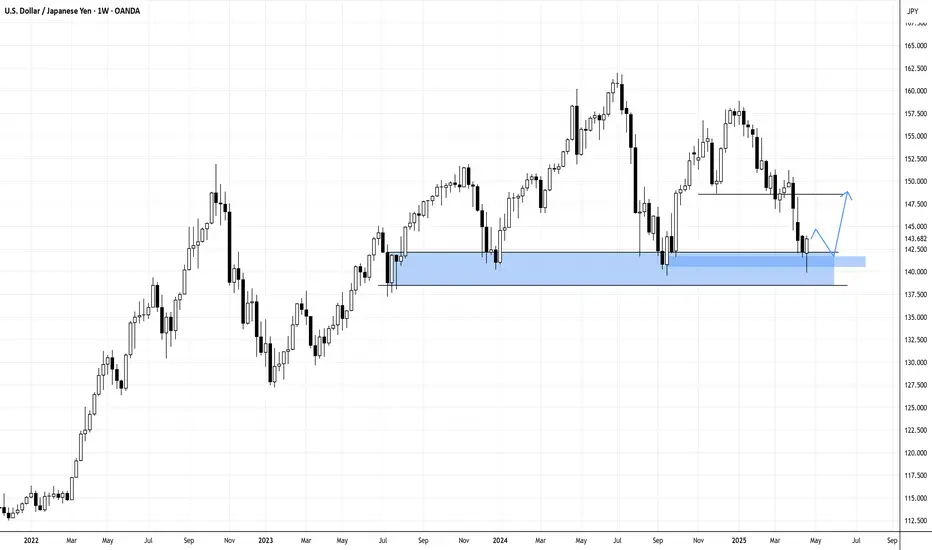
USDJPY Channel Down rejection aiming for the 2024 Support.The USDJPY pair has been trading within a Channel Down pattern since the January 10 2025 High and right now is on its latest Bearish Leg, an outcome of the rejection near the 1D MA200 (orange trend-line).
This has also been confirmed by the 1D MACD Bearish Cross and the next technical Support is on 139.600. By the time it gets tested, the price may also make contact with the 1W MA200 (red trend-line). Our short-term Target is 139.600.
-------------------------------------------------------------------------------
** Please LIKE 👍, FOLLOW ✅, SHARE 🙌 and COMMENT ✍ if you enjoy this idea! Also share your ideas and charts in the comments section below! This is best way to keep it relevant, support us, keep the content here free and allow the idea to reach as many people as possible. **
-------------------------------------------------------------------------------
Disclosure: I am part of Trade Nation's Influencer program and receive a monthly fee for using their TradingView charts in my analysis.
💸💸💸💸💸💸
👇 👇 👇 👇 👇 👇

LONG ON CAD/JPYCADJPY is rising off a major demand zone.
Us tariffs shaking up the JPY in a negative way.
I will be buying this pair looking to catch over 100 pips to the next fvg/supply area.

CADJPY - Bearish Rising WedgeHello Traders !
The CADJPY price formed a rising wedge pattern.
The price broke the support line.
So, I expect a bearish move📉
_______________
TARGET: 103.655🎯

USDJPY: FVG Then Bullish Overflow?It has been a significant week for USD/JPY. Following a break of structure (BOS) on the 4-hour timeframe, price moved away from equilibrium, leaving behind a Fair Value Gap (FVG). As the new week begins, we may observe a false move designed to induce traders into premature short positions before a potential bullish reversal—or vice versa. Additionally, given the recent BOS, price may temporarily stall to facilitate order accumulation. Next week will be pivotal in determining the pair’s next direction.
Watch out for the key levels

The Yen’s Comeback Starts Here—and it Seems the COT Knew First1. Introduction: A Market Everyone Gave Up On
For a while, the Japanese Yen looked like a lost cause. After topping out in early 2021, Yen futures (6J1!) began an unrelenting slide, shedding value week after week like an old coat in spring. Traders stopped asking, “Where’s support?” and started asking, “How low can it go?”
The macro backdrop didn’t help. The Bank of Japan clung to ultra-loose monetary policy, even as the Fed hiked aggressively. Speculators piled on shorts. The Yen was a one-way ticket down, and no one seemed interested in punching the brakes.
But beneath that apathy, a quieter shift was underway. While price kept bleeding, trader positioning began to hint at something different—something the chart didn’t show yet. And if you were watching the Commitments of Traders (COT) report closely enough, you might’ve seen it.
2. The COT Trend That No One Was Watching
The COT report isn’t glamorous. It’s slow, lagging by a few days, and rarely makes headlines. But for those who track what the big players are doing—those large enough to be required to report their positions—it’s a treasure trove of subtle clues.
One of those clues is Total Reportable Positions. This metric tells us how active large market participants really are—regardless of whether they’re long or short. When that number is dropping, it suggests the “big dogs” are losing interest. When it starts climbing again? Someone’s gearing up to play.
From 2021 through most of 2024, Total Reportable Positions in 6J were in a steady decline—mirroring the slow death of the Yen's bullish case. But in late 2024, something changed. Using a simple linear regression channel on this COT data, a clear breakout emerged. Positioning was picking up again—for the first time in nearly three years.
And it wasn’t just a bounce. It was a structural shift.
3. Did Price Listen?
Yes—and no. Price didn't immediately explode higher. But the structure began to change. The market stopped making new lows. Weekly closes began to cluster above support. And importantly, a Zig Zag analysis started marking a pattern of higher lows—the first signs of accumulation.
Here’s where the chart really gets interesting: the timing of the COT breakout coincided almost perfectly with a key UFO support at 0.0065425—a price level that also marked the bottom in COT Traders Total Reportable Longs. This adds a powerful layer of confirmation: institutional orders weren’t just showing up in the data—they were leaving footprints on the chart.
And above? There’s a UFO resistance level at 0.0075395. If the Yen continues to climb, that could be a significant price level where early longs may choose to lighten up.
4. The Contract Behind the Story
Before we go deeper, let’s talk about what you’re actually trading when you pull the trigger on Yen Futures.
The CME Japanese Yen futures (6J) contract represents 12.5 million Japanese Yen, and each tick move—just 0.0000005 per JPY—is worth $6.25. It’s precise, it’s liquid, and for traders who like to build macro positions or take advantage of carry flows, it’s a staple.
As of May 2025, margin requirements hover around ~$3,800 (Always double-check with your broker or clearing firm—these numbers shift from time to time.)
But maybe you’re not managing seven-figure accounts. Maybe you just want to test this setup with more flexibility. That’s where the Micro JPY/USD Futures (MJY) come in.
Contract size: 1/10th the size of 6J
Tick move: 0.000001 per JPY increment = $1.25
Same market structure, tighter margin requirement around ~$380 per contract
Important note: The COT report aggregates positioning across the whole futures market—it doesn’t separate out micro traders from full-size. So yes, the data still applies. And yes, it still matters.
5. Lessons from the Shift
This isn’t about hindsight bias. The value in this setup isn’t that the Yen happened to bounce—it’s how Total Reportable Positions broke trend before price did.
Here are the real takeaways:
COT data may or may not be predictive—but it is insightful. When positioning starts expanding after a long contraction, it often signals renewed interest or risk-taking. That’s tradable information.
Technical support and resistance as well as highs and lows give context. Without them, COT breakouts can feel theoretical. With them, you have real, observable UFO levels where institutions may act—and where you can plan.
6. Watchlist Insights: Where This Might Work Again
You don’t have to wait for another yen setup to apply this framework. The same structure can help you scout for early positioning shifts across the CME product universe.
Here’s a simple filter to start building your own COT watchlist:
✅ Look for markets where:
Price has been in a long, clean downtrend (or uptrend)
Total Reportable Positions are falling—but starting to reverse
A breakout occurs in positioning trend (draw a regression channel and watch for a clean violation)
A key support or resistance lines up with recent extremes in COT positioning
Whether it's crude oil, corn, or euro FX, this template gives you a framework for exploration.
🎯 Want to See More Setups Like This?
We’re just getting started. If this breakdown opened your eyes to new ways of using COT reports, UFO levels, and multi-dimensional trade setups, keep watching this space.
When charting futures, the data provided could be delayed. Traders working with the ticker symbols discussed in this idea may prefer to use CME Group real-time data plan on TradingView: www.tradingview.com - This consideration is particularly important for shorter-term traders, whereas it may be less critical for those focused on longer-term trading strategies.
General Disclaimer:
The trade ideas presented herein are solely for illustrative purposes forming a part of a case study intended to demonstrate key principles in risk management within the context of the specific market scenarios discussed. These ideas are not to be interpreted as investment recommendations or financial advice. They do not endorse or promote any specific trading strategies, financial products, or services. The information provided is based on data believed to be reliable; however, its accuracy or completeness cannot be guaranteed. Trading in financial markets involves risks, including the potential loss of principal. Each individual should conduct their own research and consult with professional financial advisors before making any investment decisions. The author or publisher of this content bears no responsibility for any actions taken based on the information provided or for any resultant financial or other losses.

AUDJPY - Bullish Double BottomHello Traders !
On Tuesday 6 May, The AUDJPY reached the support level (92.222 - 91.978).
The price formed a double bottom pattern.
At the moment, The Neckline is broken !
So, I expect a bullish move🚀
_______________
TARGET: 94.240🎯

GBPJPY: Entering the most optimal medium-term Sell Zone.The GBPJPY pair is bullish on its 1D technical outlook (RSI = 59.237, MACD = 0.300, ADX = 16.909) as it is expanding the bullish wave of the 6 month Channel Down. The two prior peaked on the 0.786 and 0.9 Fibonacci retracement level respectively. This bullish wave has already reached the 0.786 Fib, so it has entered the most optimal Sell Zone for the medium term. Even if it peaks on the 0.9 Fib, a -5.90% bearish wave (similar with the 3 prior) would test 183.500.
See how our prior idea has worked out:
## If you like our free content follow our profile to get more daily ideas. ##
## Comments and likes are greatly appreciated. ##

USDJPY - NEW BREAKDOWNHello Traders !
The USDJPY price formed an ascending channel.
Currently, The support line is broken!
So, I expect a bearish move📉
______________
TARGET: 140.850🎯

Japanese Yen Pairs: A Short Guide on Relative StrengthIndicators are a popular choice among many traders, and they certainly have their place in my own toolkit. But sometimes it is best to simply look the price to gauge strength. And doing so, it can help us scenario plan for future events. After I take a quick look at Japanese yen pairs, I wrap up on my preferred setup.
Matt Simpson, Market Analyst at Forex.com and City Index

USDJPY: Bounce on the 17 month Support starting massive rally.USDJPY is neutral on its 1D technical outlook (RSI = 50.306, MACD = -0.870, ADX = 40.251) but is on a massive bounce on the S1 Zone, which has been holding since December 25th 2023. That Low last week also approached the 1W MA200. The LH trendline is the Resistance level of this pattern (Descending Triangle) and since the last one hit the 0.786 Fibonacci, we expect this one to hit the 0.618 Fib (TP = 153.500).
## If you like our free content follow our profile to get more daily ideas. ##
## Comments and likes are greatly appreciated. ##

USD/JPY : Get Ready for another Rally! (READ THE CAPTION)By analyzing the USD/JPY chart on the daily timeframe, we can see that, as expected, the price has finally started to rise. So far, it has successfully reached the 143.5 and 144 targets, and extended up to 145.76, delivering a solid 350-pip move.
The main analysis remains valid, and I expect the price to hit the next target at 146.2 soon.
The total gain from this setup has now exceeded 570 pips, and the key upcoming supply zones are at 146.2, 148.7, and 150.
This analysis will be updated accordingly!
THE MAIN ANALYSIS :
Please support me with your likes and comments to motivate me to share more analysis with you and share your opinion about the possible trend of this chart with me !
Best Regards , Arman Shaban

USD/JPY 1H Chart AnalysisStructure: Bullish, with higher highs (H1) and higher lows consistently forming.
Key Zone: A demand zone around 143.00 – 143.20. Price could pull back here for liquidity before continuing higher.
Current Price: Consolidating near 143.70 after a strong impulse.
Bias: Bullish, as long as price holds above 143.00. Watching for a possible dip into demand before resuming the uptrend toward 144.20 highs.

USDJPY Weekly Rejection at Support-Revisit Bearish Order Block?USDJPY pair last trading week got rejected at the same level that the pair has previously acted as a support level. Will this rejection cause USDJPY to rally towards a bearish order block above 147.50?
Risk Zones: 146.50
N.B!
- USDJPY price might not follow the drawn lines . Actual price movements may likely differ from the forecast.
- Let emotions and sentiments work for you
- ALWAYS Use Proper Risk Management In Your Trades
#usdjpy
#usd
#jpy
I've Cracked the BEARISH Code for Japanese Yen Using COTJapanese Yen is setup for sells based on COT positioning and other underlying fundamental conditions.

AUDJPY - Bearish Triple TOPHello Traders !
The AUDJPY reached a strong resistance level !
The price formed a triple top pattern.
Currently, The neckline is broken !
So, I expect a bearish move📉
_________________
TARGET: 88.580🎯

CHFJPY - New Breakdown !Hello Traders !
On Thursday 10 April, The CHFJPY reached the resistance level (175.849 - 174.326).
Currently, The higher low is broken (change of character).
So, I expect a bearish move📉
________________
TARGET: 172.580🎯

CADJPY is perhaps the best sell signal long-term.The CADJPY pair has broken marginally below its 1W MA200 (orange trend-line) in recent weeks and turned sideways. This took place on the latest 1W MA50 (blue trend-line) rejection on January 13 2025. As long as the market remains below it, the long-term trend-line will be bearish.
The current 1W MA200 consolidation is in fact similar to what followed after the last major long-term rejection in December 2014. As you can see on the chart, we are on similar trading patterns as August - September 2015. Even the 1W RSI sequences among the two fractals are identical, starting off strong Bearish Divergencies that basically were an early signal for the 2015 - 2016 sell-off and possibly now the 2025 - 2026 sell-off.
As a result, we are bearish on this pair, expecting a 85.000 Target on high probabilities and a 2nd at 75.000 on lower, which is the 14-year Support Zone.
-------------------------------------------------------------------------------
** Please LIKE 👍, FOLLOW ✅, SHARE 🙌 and COMMENT ✍ if you enjoy this idea! Also share your ideas and charts in the comments section below! This is best way to keep it relevant, support us, keep the content here free and allow the idea to reach as many people as possible. **
-------------------------------------------------------------------------------
Disclosure: I am part of Trade Nation's Influencer program and receive a monthly fee for using their TradingView charts in my analysis.
💸💸💸💸💸💸
👇 👇 👇 👇 👇 👇

EURJPY TO BREAK 2022 LOWThe ascending channel is the first sign that indicates that price have a high chance to break 2022 low. After price impulsively broke the channel price formed a continuation of which I expect an impulsive break to the downside.

SIGNAL FOR TRADE IN 15m TIMEFRAMEBTCUSDT prepare for downward trend in 15m timeframe
its my opinion about this chart

Weekly FOREX Forecast: Wait To Buy JPY vs USD!In this video, we will analyze JPY futures and USDJPY. We'll determine the bias for the upcoming week, and look for the best potential setups.
The Yen is strong, and will outperform the USD in times of uncertainty. It is the worlds' safe haven of choice.
Look for a small retracement before JPY pushes higher.
Enjoy!
May profits be upon you.
Leave any questions or comments in the comment section.
I appreciate any feedback from my viewers!
Like and/or subscribe if you want more accurate analysis.
Thank you so much!
Disclaimer:
I do not provide personal investment advice and I am not a qualified licensed investment advisor.
All information found here, including any ideas, opinions, views, predictions, forecasts, commentaries, suggestions, expressed or implied herein, are for informational, entertainment or educational purposes only and should not be construed as personal investment advice. While the information provided is believed to be accurate, it may include errors or inaccuracies.
I will not and cannot be held liable for any actions you take as a result of anything you read here.
Conduct your own due diligence, or consult a licensed financial advisor or broker before making any and all investment decisions. Any investments, trades, speculations, or decisions made on the basis of any information found on this channel, expressed or implied herein, are committed at your own risk, financial or otherwise.
