AUD/JPY - Tight RangeOANDA:AUDJPY
Tight range for this pair.
Started to watch this late yesterday and early into todays FX sessions as maybe, just maybe the Aussie's and Japanese market makers would make some moves before the holiday weekend as there were first up in line.
Didn't happen, tight range under 70 pips for most of the major pairs.
AJ couldn't break below this support area all night/morning long
Trade Smart
Trade well
Japaneseyen

GBPJPY: Classic Bullish Setup Explained 🇬🇧🇯🇵
GBPJPY reached a solid horizontal support yesterday.
The price formed the inside bar formation on that.
Its range was successfully broken to the upside, and the 4H candle closed above that.
It will most likely push the pair higher.
Goals will be 164.6 / 165.78
❤️Please, support my work with like, thank you!❤️

USDJPY Reached our target. Critical move ahead.The USDJPY pair hit the sell target we set on our February 28 analysis as it got rejected on the 138.210 Resistance and dropped back to the (dashed) Higher Lows trend-line:
As long as this trend-line holds, it is more likely to see one more rebound first to the 1D MA50 (blue trend-line) for short-term traders and then to the 1D MA200 (orange trend-line) for medium-term traders.
A closing (1D candle) below the dashed trend-line, will be a sell break-out signal for us and we will take the small loss on the buy and target instead the January 05 2021 Higher Lows trend-line.
Similarly, a closing (1D candle) above the 138.210 Resistance will be a buy break-out signal, targeting Resistance Zone 1.
Notice the 1D RSI being on a Higher Lows trend-line of itself. A rebound or break below it respectively enhances the probabilities of buy and sell trades respectively.
-------------------------------------------------------------------------------
** Please LIKE 👍, FOLLOW ✅, SHARE 🙌 and COMMENT ✍ if you enjoy this idea! Also share your ideas and charts in the comments section below! **
-------------------------------------------------------------------------------
💸💸💸💸💸💸
👇 👇 👇 👇 👇 👇

NZDJPY - NEW BREAKOUT !
Hello Traders 💖
On The Daily Time Frame The NZDJPY Price Reached a Resistance Level!
Currently, The Price formed a Double TOP Pattern 📉
The Neckline is Broken, The Support Line is Broken 🔥
So, I Expect a Bearish Move 📉
i'm Waiting for a Retest...
-----------
TARGET: 81.655🎯
________
if you agreed with this IDEA, please leave a LIKE, FOLLOW or COMMENT!


GBPJPY - New Breakout 🔥On The Daily Time Frame The GBPJPY Price Reached a Resistance Level!
Currently, The Higher Low of The Bullish Structure is Broken (Break of Structure)🔥
The Support Line is Broken 🔥
So, I Expect a Bearish Move 📉
i'm Waiting for a Retest...
-----------
TARGET: 160.880🎯
________
if you agreed with this IDEA, please leave a LIKE, FOLLOW or COMMENT!

AUD/JPY - Not BadOANDA:AUDJPY
These moves looking good, not bad not bad.
Safe entries for scalps.
Trade the trend until someone else breaks it.

It's always the Employment chat these daysOANDA:USDJPY
Past few days, employment and payroll figures have guided the dollar index lower.
So to no surprise, the UJ pair follows.
Trade well
NZDJPY: High upside potential.The NZDJPY pair is on a neutral technical price action on the 1D time frame (RSI = 51.078, MACD = -0.120, ADX = 32.313) as it reached the 0.5 Fibonacci level and 1D MA50 yesterday. This is the middle level of the long-term trading range inside the S1 and R1 Zones since April 20th 2022. So essentially this pair has been trading sideways for almost 1 year.
Since the price recently rebounded (March 24th) at the top of the S1 Zone, we take this as a solid buy opportunity to target Fibonacci 0.786 (TP = 86.300).
## If you like our free content follow our profile to get more daily ideas. ##
## Comments and likes are greatly appreciated. ##

AUDJPY - BEARISH MOVE !On The Daily Time Frame The AUDJPY Price Reached a Resistance Level!
Currently, The Higher Low of The Bullish Structure is Broken (Break of Structure)🔥
The Support Line is Broken 🔥
So, I Expect a Bearish Move 📉
i'm Waiting for a Retest...
-----------
TARGET: 86.880🎯
________
if you agreed with this IDEA, please leave a LIKE, FOLLOW or COMMENT!

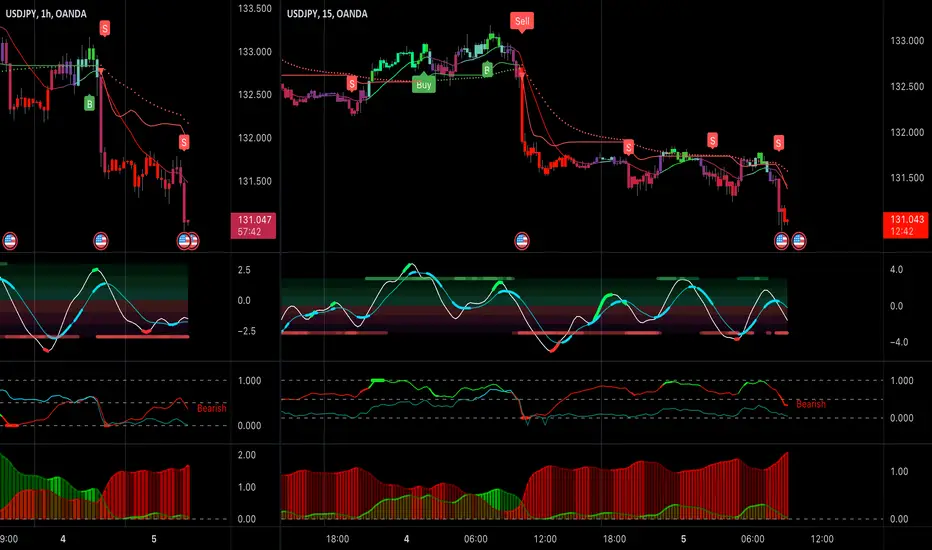
Japanese Yen has bounce from current support and can increasedHello traders, I want share with you my opinion about Japanese Yen. Looking at the graph, we see how the Japanese yen fell to the level 129.65, after which it changed direction and began to rise. For a long time, the price moved up, reached the level 133.80 and created a resistance area from which it began to fall. Thus, the local uptrend was completed and began a downward trend. Ethereum continued to decline and recently reached support level 131.30, which was retested. The price is currently trading above the current support level and can continue to rise. I think the price can reach the resistance line, so the targets for USD/JPY I set at level131.85, which corresponds to the Fibonacci level 0.236, and at level 132.25, which coincide with the resistance line and corresponds to the Fibonacci level 0.382. Possible this a correctional movement and in the future the price may continue to decline, so I will update this idea for you as soon as the market situation changes. Please share this idea with your friends and click Boost 🚀

USD/JPY some more correction in 1H TimeframeHi Dears
If you look carefully at the chart of the USD/JPY, you can see that we have to continue our bearish momentum until to reach the base of the pole. But why?
First of all, we had an SR line at around 131.764 that the price Engulfed later and made an FTR zone, and also the price pulled back to it later so we can say that we have a flag limit (FL) zone.
This FL zone was Engulfed later on 5 April and when this happened, we expect the price to reach the base of the pole.
Sincerely
Hosein Poursaei

GBPJPY ON THE BEST ZONE ?As the price coming to the resistance , the resistance level keeping pushing on the zone. Might be the change of trend. For long term, the price might going keeping on bullish trend. Thus, the GBPJPY price will lookup on current price for confirmation to short. The support level stated will be one of the most important level need to be watching for either trend change or not.

CADJPY: Mixed patterns. Trade these levels only.CADJPY is trading inside a Channel Down pattern with the 1D technicals neutral (RSI = 51.739, MACD = -0.070, ADX = 39.994). Right noe the price is on the 1D MA50 and is bearish within the Channel Down targeting for its bottom (TP = 94.250).
In spite of that, with a 1D RSI on HL and last time the price was on the 1D MA50 from a leg up, extending to the top of the Channel Down, we might see the emergence of a Channel Up targeting the 1D MA200. As a result, if we see a break over today's High, we will buy and target firstly Fibonacci 0.382 (TP = 100.400) and secondly Fibonacci 0.5 and the 1D MA200 (TP = 102.000).
## If you like our free content follow our profile to get more daily ideas. ##
## Comments and likes are greatly appreciated. ##

JPY BasketThese are levels that I'll be keeping an eye on when dealing with JPYBASKET, and I'll revise as price action progresses.
I adapt to the change in money flow.

USD/JPY - fRIdAYOANDA:USDJPY
Interesting Friday.
Typically, Fridays are boring range days.
But a couple USA news releases rocked price action in a few places.
Have a great weekend
Study hard
Trade well

NZDJPY - Bullish Falling Wedge 📈
As We Talked in The Previous Analysis:
On The Weekly Time Frame The NZDJPY Price Reached a Major Key Level !
Currently, The Price formed a Falling Wedge Pattern 📈
The Resistance Line is Broken
So, I Expect a Bullish Move 📈
i'm Waiting for a Retest...
-----------
TARGET: 83.630🎯
________
if you agreed with this IDEA, please leave a LIKE, FOLLOW or COMMENT!

USDJPY - Quiet Day for ScalpsOANDA:USDJPY
Quiet day as the overall S&P market crawls a bit higher, and the DXY heads lower.
Good day for UJ scalps, frustrating day if going for the huge runs.
Range was about 75 pips across all sessions.
Trade well

$USDJPY BUY Trade #BreakoutMarch 30, 2022
$USDJPY BUY Trade #Breakout
First breakout entry of the day.
Cheers,
G.

USDJPY Under Pressure! Sell!
My dear subscribers,
USD/JPY looks like it will make a good move, and here are the details:
The instrument tests an important psychological level 132.6.
Bias - Bearish.
Technical Indicators: Supper Trend generates a clear short signal while Pivot Point HL is currently determining the overall Bearish trend of the market.
Target - 131.9
About Used Indicators:
The pivot point itself is simply the average of the high, low and closing prices from the previous trading day.
———————————
WISH YOU ALL LUCK

EURJPY - Hmmmmm hmmm GoodOANDA:EURJPY
Deliciously good
Nice moves on the JPY pairs today, when others chopped all day. OANDA:EURJPY

USD/JPY - Not bad for a Boring DayOANDA:USDJPY
Just go with the trend, right?
Safe and sound with trade management.

EURJPY Will Fall! Short!
Please, check our technical outlook for EURJPY.
Time Frame: 12H
Current Trend: Bearish
Sentiment: Overbought (based on 7-period RSI)
Forecast: Bearish
The market is on a crucial zone of supply 143.6
Taking into consideration the current market trend & overbought RSI, chances will be high to see a bearish movement to the downside at least to 142.0 level.
P.S
Overbought describes a period of time where there has been a significant and consistent upward move in price over a period of time without much pullback.
The term Oversold describes a period of time where there has been a significant and consistent downward move in price over a period of time without much pullback.
Like and subscribe and comment my ideas if you enjoy them!
