InvestMate|USD/JPY Long-awaited correction💱USD/JPY Long-awaited correction
💱Continuing the thread started in a previous post in which I predicted a decline on USD/JPY .
💱In this post I would like to expand on my point of view
💱Last week the event everyone was waiting for was the interest rate decision, which rose to 4%.
💱This was followed by a press conference in which Jerome Powell spooked the markets with a hawkish tone, which first triggered a sharp wave of dollar weakness, and Powell's words were followed by a speculative attack to strengthen the dollar.
💱The next day already brought a cooling off and the market returned to discounting the scenario of a weakening dollar in the future and a slowdown in interest rate hikes.
💱 4 November Non Farm Payrolls performed very well with 261k new jobs created compared to the 200k the market was expecting.
💱After which the rate from the data we found out unemployment rose to 3.7%
💱All this data could have a positive impact on future inflation readings. Which has been falling for over 4 months.
💱All of the above data is contributing to the slow weakening of the dollar.
💱Looking at the USD/JPY chart where we are at 32 year highs.
💱In an uptrend since 2011.
💱The only significant corrections we have made in recent years were these 2:
💱Looking at the current one-year uptrend impulse, it is hard not to get the impression that in the long term we could use some kind of correction, at least to match the one in July this year
💱Or perhaps we are in for an even bigger correction returning to strong support points?
💱If Japan's rising inflation forced the central bank to raise interest rates, which are at record lows, and these developments combined with the BOJ's stated desire to strengthen the currency in recent weeks. We could see a massive downward slide, especially with the dollar
🚀If you appreciate my work and effort put into this post I encourage you to leave a like and give a follow on my profile.🚀
Japaneseyen

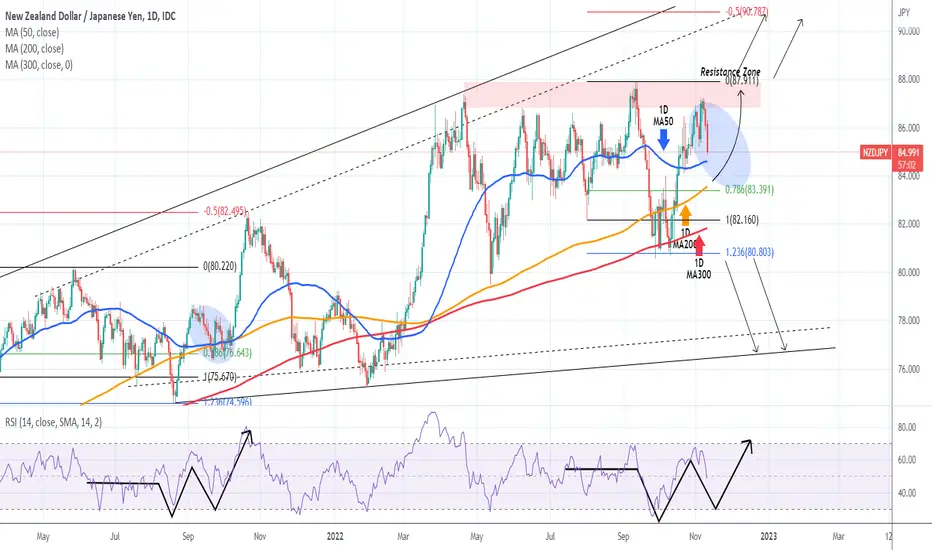
NZDJPY Pull-back first, 88.000 - 90.000 later.The NZDJPY pair followed very closely the trading plan we presented on our last September 22 analysis:
As you see after a drop to the 1.236 Fibonacci extension, the price rebounded aggressively back to the Resistance Zone. What helped us make this accurate projection were the striking similarities that presented early on with the June - September 2021 fractal. It appears that we are inside the blue oval pull-back which was completed just below the 0.786 Fibonacci level and then bounced for a new High on the -0.5 Fib extension.
See how similar their RSI patterns are as well. As a result, once this pull-back is completed, we expect a rise first to the 87.900 Resistance (top) and the -0.5 Fib above 90.000.
-------------------------------------------------------------------------------
** Please LIKE 👍, SUBSCRIBE ✅, SHARE 🙌 and COMMENT ✍ if you enjoy this idea! Also share your ideas and charts in the comments section below! This is best way to keep it relevant, support me, keep the content here free and allow the idea to reach as many people as possible. **
-------------------------------------------------------------------------------
You may also TELL ME 🙋♀️🙋♂️ in the comments section which symbol you want me to analyze next and on which time-frame. The one with the most posts will be published tomorrow! 👏🎁
-------------------------------------------------------------------------------
👇 👇 👇 👇 👇 👇
💸💸💸💸💸💸
👇 👇 👇 👇 👇 👇
EURJPY: Time to Sell 🇪🇺🇯🇵
Update for EURJPY.
The pair has recently retested a broken trend line on a daily.
The price formed a horizontal range on 4H time frame then
and broke its support.
I expect a bearish continuation to 144.4 now.
❤️If you have any questions, please, ask me in the comment section.
Please, support my work with like, thank you!❤️

is USDJPY on its way again?The USDJPY currency pair is currently located in its own one-year bullish channel and has continued to route itself with numerous touch of the middle line. The pair is currently in the price range of 146, which can move toward 150 by demand in this area.

CADJPY Accumulation before pump?The CADJPY pair continues to follow our trading plan presented on September 20, as it repeats the fractal of late 2021 - early 2022:
As you see, the MACD Bearish Cross was the correct sell signal we needed and the price hit the 0.618 Fibonacci target and rebounded. Right now it appears that the price has entered a consolidation phase similar to the post January 20 MACD Bearish Cross. As long as the Green Support Zone holds, we should expect within a 5 week horizon a break above the September High, targeting the 2.0 Fibonacci extension.
A break below the Zone though, shouldn't stop on the 1D MA200 (orange trend-line) but instead target the 1W MA50 (red trend-line) for the first time since December 20 2021. An additional bullish confirmation would be a break of the RSI above its own Lower Highs trend-line, which in more than a year has delivered very strong and rapid rallies.
-------------------------------------------------------------------------------
** Please LIKE 👍, SUBSCRIBE ✅, SHARE 🙌 and COMMENT ✍ if you enjoy this idea! Also share your ideas and charts in the comments section below! This is best way to keep it relevant, support me, keep the content here free and allow the idea to reach as many people as possible. **
-------------------------------------------------------------------------------
You may also TELL ME 🙋♀️🙋♂️ in the comments section which symbol you want me to analyze next and on which time-frame. The one with the most posts will be published tomorrow! 👏🎁
-------------------------------------------------------------------------------
👇 👇 👇 👇 👇 👇
💸💸💸💸💸💸
👇 👇 👇 👇 👇 👇

USDJPY: Your Trading Plan For Today 🇺🇸🇯🇵
USDJPY is approaching a rising trend line on a daily.
The price formed a double bottom pattern on that on an hourly time frame.
To buy with a confirmation, wait for a bullish breakout of its horizontal neckline.
We need an hourly candle close above 146.8.
A bullish continuation will be expected to 147.4 level then.
If the price sets a new lower low on an hourly, the setup will become invalid.
❤️If you have any questions, please, ask me in the comment section.
Please, support my work with like, thank you!❤️

CHFJPY Undecided around the 1D MA50.The CHFJPY pair has been trading on one of the most consistent patterns of the last 12 months as we accurately outlined on our last analysis in mid September:
Once again the signal played out as it pulled-back as low as the 0.5 Fibonacci retracement level and then the price has been trading sideways ever since. The 1D RSI has again formed Lower Highs but this time the MACD on the 1W time-frame is on a confirmed Bearish Cross.
As a result, we are only willing to approach this with break-outs. A 1D closing below the 1D MA100 (green trend-line), would be a sell break-out signal targeting the 1D MA200 (orange trend-line), while one above the 1D RSI Lower Highs and the price's 150.700 Resistance, would be a buy break-out signal targeting the 2022 Higher Highs trend-line.
-------------------------------------------------------------------------------
** Please LIKE 👍, SUBSCRIBE ✅, SHARE 🙌 and COMMENT ✍ if you enjoy this idea! Also share your ideas and charts in the comments section below! This is best way to keep it relevant, support me, keep the content here free and allow the idea to reach as many people as possible. **
-------------------------------------------------------------------------------
You may also TELL ME 🙋♀️🙋♂️ in the comments section which symbol you want me to analyze next and on which time-frame. The one with the most posts will be published tomorrow! 👏🎁
-------------------------------------------------------------------------------
👇 👇 👇 👇 👇 👇
💸💸💸💸💸💸
👇 👇 👇 👇 👇 👇

AUDJPY The Lower Highs the key to our trades.The AUDJPY pair is currently trading on its 1D MA50 (blue trend-line), being the pivot since the price turned sideways during Summer. The long-term trend remains bullish however within a 1 year Channel Up (better viewed with the Fibonacci levels as you see) with the 1D MA200 (orange trend-line) supporting.
Recently it has formed a Lower Highs pattern again with the 90.740 level as the Support. That seems to be consistent with the previous Lower Highs of June-July that broke upwards in late August and hit the 98.700 Resistance. As a result, if the price breaks above the current Lower Highs we expect again a push to the 98.700 Resistance. On the other hand, a break below the Support, would mean a break below the 1D MA200 as well, and that would change completely the trend to long-term bearish.
-------------------------------------------------------------------------------
** Please LIKE 👍, SUBSCRIBE ✅, SHARE 🙌 and COMMENT ✍ if you enjoy this idea! Also share your ideas and charts in the comments section below! This is best way to keep it relevant, support me, keep the content here free and allow the idea to reach as many people as possible. **
-------------------------------------------------------------------------------
You may also TELL ME 🙋♀️🙋♂️ in the comments section which symbol you want me to analyze next and on which time-frame. The one with the most posts will be published tomorrow! 👏🎁
-------------------------------------------------------------------------------
👇 👇 👇 👇 👇 👇
💸💸💸💸💸💸
👇 👇 👇 👇 👇 👇

EURJPY: Important Breakout 🇪🇺🇯🇵
Have you seen that bearish breakout on EURJPY?
The price broke and closed below a major rising trend line on a daily.
Now a bearish continuation is expected.
Next supports: 144.0 / 141.4
❤️If you have any questions, please, ask me in the comment section.
Please, support my work with like, thank you!❤️

EURJPY Huge bullish break-out!The EURJPY pair emphatically broke above the June Resistance Zone confirming our view of the market since early August. This continues to repeat the fractal of 2020 as we pointed out in our last analysis:
This helped us make this accurate projection as the price got rejected initially on the Resistance Zone and after pulling-back to the 1D MA50 (blue trend-line) it rebounded again emphatically above the Resistance Zone this time and even hit the 4.0 Fibonacci extension, which was our Target. If the fractal continues to play out, then we should see an extension of this rise to the next Fib 4.5 which is at 152.550.
Basically based on the RSI on the 1W time-frame, we are in a spot similar to late February 2021, after the RSI broke above its Lower Highs trend-line. Only a closing below the 1D MA200 (orange trend-line) can reverse this long-term bullish trend and drop the price as low as the 1W MA200 (red trend-line) and the bottom of the 2021 Fibonacci Channel.
-------------------------------------------------------------------------------
** Please LIKE 👍, SUBSCRIBE ✅, SHARE 🙌 and COMMENT ✍ if you enjoy this idea! Also share your ideas and charts in the comments section below! This is best way to keep it relevant, support me, keep the content here free and allow the idea to reach as many people as possible. **
-------------------------------------------------------------------------------
You may also TELL ME 🙋♀️🙋♂️ in the comments section which symbol you want me to analyze next and on which time-frame. The one with the most posts will be published tomorrow! 👏🎁
-------------------------------------------------------------------------------
👇 👇 👇 👇 👇 👇
💸💸💸💸💸💸
👇 👇 👇 👇 👇 👇

GBPJPYHELLO GUYS THIS MY IDEA 💡ABOUT GBPJPY is nice to see strong volume area....
LIKE AND FOLLOW FOR MORE IDEAS
TURTLE TRADER 🐢

USDJPY may jump up and down for a whileThere are two bullish scenarios for The dollar yen breaking the trend line and going up and reversing to the zone and going up!
But there is absolutely a bearish potential move for the pair too! Strong supply zone is around the the top up there.
I'll put both sell and buy orders around the zones.

GBPJPY Finally Touching The Strong ResistanceExpecting The price to The Weekly Resistance level and drop to the New Buy Zone.
Keylevel as follows:
Red: Sell
Yellow: Weekly Buy Fibo 50-60%

⚜️ USD/JPY : NEW TA : 10.28.22 ⚜️In this chart, the possible trends with high accuracy examined and various support and resistance zones have been identified on the chart !
Follow me for more analysis & Feel free to ask any questions you have, I'm here to help.
⚠️ This Analysis will be updated ...
👤 Arman Shaban : @ArmanShabanTrading
📅 10.28.2022
⚠️(DYOR)
❤️ If you apperciate my work , Please like and comment , It Keeps me motivated to do better ❤️

USDJPY: Classic Trend-Following Trade 🇺🇸🇯🇵
USDJPY dropped to a peculiar zone of confluence yesterday.
We see a perfect intersection between a horizontal demand area and 0.5 retracement of the last bullish impulse.
The price was nicely rejected and a doji candle was formed.
On an hourly time frame, I spotted an ascending triangle formation.
It confirms a highly probable bullish continuation.
Goals: 148.276 / 149.26
❤️If you have any questions, please, ask me in the comment section.
Please, support my work with like, thank you!❤️

💶💴EUR/JPY The rally is not over yet💶💴EUR/JPY The rally is not over yet.
💶Euro is showing signs of strength in the current week.
💶 Looking at the Unemployment rate in the Eurozone, it stands at 6.6%, the lowest on record.
💶Inflation is already close to 10% and on the 31st when the flash year-on-year reading is forecast to be 10.1%
💶Interest rates have been raised by 75 basis points and the market is betting on another 75 point hike to 2%. The decision will be made on Thursday 27 October.
💶The consumer sentiment indicator which is off its lowest levels in years has started to rise slowly and the market expects the positive trend to continue in the coming months. There will be another reading on 28 October.
💶💴On the other side of the globe.
💴In Japan, no change.
💴Unemployment Rate low at 2.5%
💴Inflation low 3%. Japan is one of those countries that has not been hit by Inflation as much as Europe and the USA.
💴Interest rates at -0.1%. Still negative from 2016. Hence these falls in the Yen. When other countries raise rates causing their currencies to strengthen, their strength against the Yen increases.
💴For now, there are no increases on the horizon. The Bank of Japan says it has no intention of changing its monetary policy.
💴But the government doesn't want the Japanese Yen so cheap either, hence in recent days we have seen sharp falls which were interventions to stop the Yen weakening sharply against other currencies.
💴I don't think this will stop investors from pushing prices up again.
Turning to the chart.
📈It probably doesn't need to be told to everyone that we have been in an uptrend since 2000.
📈In the last few days, after the interventions and the attempt to dump the price which was momentarily pushed upwards. This took place at support levels zoned between 143 and 145.
📈 We do not see any signs that the price is going to make any correction in the coming days seeing such big pullbacks on the 1D candles.
📈In order to determine the target we move to the 1M chart.
📈Where after measuring the 2 biggest downward waves using fibo. We come out with a cluster at levels of 160 which seems a very likely scenario if the policy of the central bank of Japan remains unchanged and we enter a time of growths on the Euro.
📈Entering at the current moment and setting a stop below the recent price pullbacks after the interventions with a take profit at the 160 level brings out our best profit/risk ratio so far since I've been posting at.
🚀If you appreciate my work and effort put into this post I encourage you to leave a like and give a follow on my profile.🚀

The dollar retreated after possible Japanese interventionEUR/USD 🔼
GBP/USD 🔼
AUD/USD 🔼
USD/CAD 🔽
USD/JPY 🔽
XAU 🔼
WTI 🔼
Last week, the Yen/Dollar pair have went above the 150.0 level, then it plunged to a low of 146.31 and recovered to 147.64. As the market believed the Bank of Japan had intervened to prevent further depreciation, more is expected ahead of the Federal Reserve interest rate decision. Meanwhile, USD/CAD dropped to 1.3638.
In the UK, the race for the newly vacated position of Prime Minister is likely a two-horse race, upon the decision from Boris Johnson to withdraw his candidacy. GBP/USD rebounded from 1.1074 to 1.1302, as the Euro surged from 0.9713 to 0.986 versus the greenback.
AUD/USD met resistance at 0.6400 and closed at 0.6377. Gold price climbed almost $30 to 1,657.82 per ounce, thanks to a weakened dollar. WTI oil futures slightly increased to $85.05 a barrel.

USDJPY: How High Will It Go? 🇺🇸🇯🇵
Detailed analysis on USDJPY.
Multiple time frame outlook.
Thoughts and trading recommendations.
❤️If you have any questions, please, ask me in the comment section.
Please, support my work with like, thank you!❤️

GBPJPY: Time to Grow?! 🇬🇧🇯🇵
GBPJPY bounced from a solid confluence zone based on a horizontal structure and 0.5 retracement of the last bullish impulse.
The price has easily broken and closed above a trend line, confirming the strength of the underlined zone.
I think that the pair will keep growing
Goals: 169.76 / 170.5
❤️If you have any questions, please, ask me in the comment section.
Please, support my work with like, thank you!❤️

💱 Is it time for the Euro? 💱 InvestMate💱 Is it time for the Euro?
💱 For some time now I have been watching the Eur/jpy pair which is, in my opinion, beginning its journey towards breaking out and landing finally at the 150 levels.
💱 Looking at the key indicators. We see bullish signals everywhere. Given today's upward candle and the formation of increasingly higher lows, it is hard not to hold a bullish attitude.
💱 Target was set on the basis of 2 fibo measurements, the last biggest corrections and the target level is the cluster 1.618, which ideally touches on the round level of 150
💱 The stop was set below today's upward candle.
💱 As a result, the Risk/Reward ratio is 3 times for profit, which in my opinion is a very good result.
🚀 If you like my analysis leave a like and follow my profile 🚀

GBPJPY Highly important trend-lines to watch.The recent volatility on the GBPJPY pair has been extreme. This price action can only be traded on the long-term by taking break-out positions on key Support and Resistance levels.
As you see, the long-term trend has been a Channel Up ever since the March 2020 COVID bottom. Recently, the 148.600 - 149.000 Support Zone that has been holding since March 24 2021, was successfully tested and provided a massive rebound to the pair. On Monday this rebound hit the Higher Highs trend-line of 2022. As long as it holds, expect a pull-back towards the 1D MA50 (blue trend-line) and the 1D MA200 (orange trend-line), even the Internal Support of 160.000.
As per the 2021 fractal there are high chances of a rebound there but a weekly close below can put the bottom of the 2 year Channel Up to test again. Any time we close above the 2022 Higher Highs trend-line, consider a short-term break-out buy targeting the top of the Channel Up. This pattern can break to the upside if the 2.0 - 2.5 Fibonacci fractal seen at the end of each Higher Highs sequence is repeated again. In that case, take the Fib from the last low of 2022 and calculate the 2.0 - 2.5 extension zone.
-------------------------------------------------------------------------------
** Please LIKE 👍, SUBSCRIBE ✅, SHARE 🙌 and COMMENT ✍ if you enjoy this idea! Also share your ideas and charts in the comments section below! This is best way to keep it relevant, support me, keep the content here free and allow the idea to reach as many people as possible. **
-------------------------------------------------------------------------------
You may also TELL ME 🙋♀️🙋♂️ in the comments section which symbol you want me to analyze next and on which time-frame. The one with the most posts will be published tomorrow! 👏🎁
-------------------------------------------------------------------------------
👇 👇 👇 👇 👇 👇
💸💸💸💸💸💸
👇 👇 👇 👇 👇 👇

CHFJPY: Trend-Following Trading 🇨🇭🇯🇵
One more Yen pair looks very bullish:
CHFJPY broke and closed above a solid horizontal supply area.
Now, the broken structure and a rising trend line compose a contracting demand zone
from where a bullish wave will be expected.
Next resistance - 151.3
❤️If you have any questions, please, ask me in the comment section.
Please, support my work with like, thank you!❤️

NZDJPY: Very Bullish Setup 🇳🇿🇯🇵
Hey traders,
NZDJPY was consolidating within a wide horizontal trading range on a daily for 3 weeks.
This week, its resistance was broken with a high momentum bullish candle.
Taking into consideration, that the pair is trading in a long-term bullish trend,
the breakout may push the price higher.
Next resistances: 86.16 / 87.65
❤️If you have any questions, please, ask me in the comment section.
Please, support my work with like, thank you!❤️
