JASMYUSDT 5DJASMY ~ 5D Analysis
#JASMY Buy gradually from here if you still have a Conviction on this coin with a short -term target of at least 15%+.
Jasmy

(jasmy) JASMY bar array pattern fading in and out of a low motion pattern indicator. Use examples from the past to understand the meaning. included lines from previous posts unchanged in purple representing key moments of the jasmy chart for reference. The price broke the previous lows.

(BTC) bitcoin "history"bitcoin compared to the 9 weeks down of jasmy. The last time Bitcoin went down for 9 weeks straight was during April-May 2022.

(JASMY) jasmy {9 weeks of down for Jasmy} that certainly was not expected based on the previous performance.

(JASMY) JASMY "that sux"Jasmy losing like there is no tomorrow. The Elliott Wave prospects of Jasmy seem to have fallen through. The December price was what I wanted to believe was a peak of Elliott Wave patterns with two more to follow only slightly lower but this prolonged down angle on the chart is a bummer.

(jasmy) JASMYperhaps the numerical ideologies are not here, perhaps the theoretical possibility is not strong, perhaps the chance, rare, perhaps perhaps; what else can a person do other than wait and wonder and watch as the world storms to the top, only to crash all the way back down. What is learned is nothing other than the same redundant story about how to wait for the moment to jump from the top and be freed of the burden of care running off into the sunset never to worry about anyone left behind.

Are you watching closely?Don't listen to all those dramatic fools screaming and shouting at the top of their lungs so that you give up here. Would you dare to give up here?
Benjamin Cowen keeps crying stating he would prefer not to have a 2nd wave of inflation like it happened in the 70s because his children would suffer. Come now, while he's telling people he wishes for altcoins to die, technicals suggest otherwise.
This is the part where almost everyone gives up, will you give up?
I most certainly won't.

Jasmy short profitJasmy fly. Possible target 0.13 usd, long. Diamond hands. I like Jasmy.
JasmyCoin (JASMY) is a cryptocurrency project of a Tokyo-based Internet of Things (IoT) provider Jasmy Corporation. As a system, the Internet of Things includes mechanical and digital elements endowed with an identifier and the ability to transmit data. The IoT company Jasmy specializes in buying/selling data, and the Jasmy platform connects two categories: service providers and data users.
Max. supply: 50B JASMY
Circulating supply: 49.44B JASMY
Jasmy short 0.027 usdt, or more.
We continue downwards, but Jasmy long-term upward target 0.13 usdt.
2030 ai predict price 0.90 usdt.
This is only my idea guys.
This is not financial advice !
Please do your analysis and consider investing !! Thanks for supp.

#JASMY/USDT#JASMY
The price is moving in a descending channel on the 1-hour frame and is adhering to it well and is heading to break it strongly upwards and retest it
We have a bounce from the lower limit of the descending channel, this support is at a price of 0.02046
We have a downtrend on the RSI indicator that is about to break and retest, which supports the rise
We have a trend to stabilize above the moving average 100
Entry price 0.02280
First target 0.02438
Second target 0.02718
Third target 0.02962

#JASMY/USDT Ready to go up#JASMY
The price is moving in a descending channel on the 1-hour frame and is adhering to it well and is heading to break it strongly upwards
We have a bounce from the lower limit of the descending channel, this support is at a price of 0.02380
We have a downtrend on the RSI indicator that is about to be broken, which supports the rise
We have a trend to stabilize above the moving average 100
Entry price 0.02470
First target 0.02670
Second target 0.02955
Third target 0.03210

JASMY at a Crossroads: Breakout or Deeper Drop?Yello, Paradisers! JASMY remains in a bullish market structure on the higher timeframe, but the question is—will the current retracement lead to a breakout or a deeper correction?
💎Right now, JASMYUSDT is retracing into a crucial support zone. If the price breaks above the resistance trendline with strong volume and confirms a bullish I-CHoCH on lower timeframes, it would significantly increase the probability of an upward move. However, patience is key—confirmation is crucial before entering a trade.
💎If the retracement deepens or panic selling kicks in, we’ll be watching the next strong support zone. A bounce from there is possible after taking inducement, but confirmation will still be necessary—look for a bullish I-CHoCH on lower timeframes or classic reversal patterns like a W pattern or inverse head & shoulders.
💎However, if the price breaks below the strong support zone and closes candle below it, our bullish scenario becomes invalid. In that case, it’s best to step back and wait for a stronger price action setup before making any moves.
🎖The key here is discipline and patience. Don't chase trades—wait for high-probability setups and let the market come to you. This is the only way to stay consistently profitable in the long run.
MyCryptoParadise
iFeel the success🌴

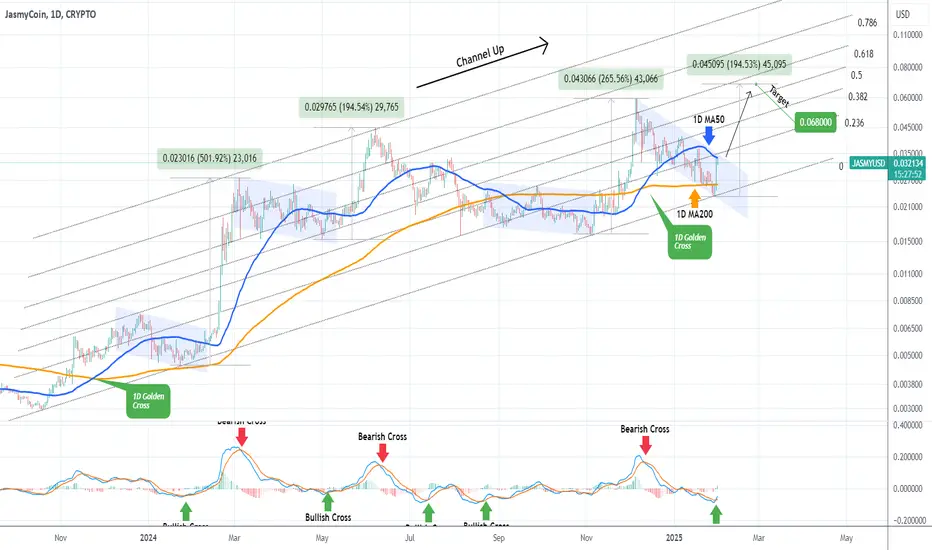
JASMYUSD testing the 1D MA50 for a break-out. $0.068 on sight.JasmyCoin (JASMYUSD) has been trading within a 15-month Channel Up and the price made this week a direct contact with its bottom. This is technically a Higher Low for the pattern and naturally it immediately reacted with a rebound.
The price is currently testing its 1D MA50 (blue trend-line), which happens to be at the top of the Bearish Leg (blue Channel) of the previous High. This is a Bull Flag pattern, which has always produced a rally eventually, with the lowest % rise being +194.50%.
With the 1D MACD just completing a Bullish Cross below the 0.0 mark, we expect Jasmy to break-out and go for at least another +194.50% rise from its bottom. Target 0.06800.
-------------------------------------------------------------------------------
** Please LIKE 👍, FOLLOW ✅, SHARE 🙌 and COMMENT ✍ if you enjoy this idea! Also share your ideas and charts in the comments section below! This is best way to keep it relevant, support us, keep the content here free and allow the idea to reach as many people as possible. **
-------------------------------------------------------------------------------
💸💸💸💸💸💸
👇 👇 👇 👇 👇 👇
JASMY/USDT: BREAKOUT ALERT!!🚀 Hey Traders! Ready to Catch the JASMY Breakout? 👋
If this setup excites you, smash that 👍 and hit Follow for top-tier trade ideas that deliver real results! 💹🔥
JASMY is looking strong and bullish! 📈 It has broken out of a falling wedge on the 4-hour timeframe and successfully retested the breakout level. Now, it’s primed for a major move! Long some here and add on dips.
🔹 Entry Range: $0.031 - $0.033
🎯 Targets:
✅ Target 1: $0.038
✅ Target 2: $0.046
✅ Target 3: $0.054
✅ Target 4: $0.060
🛡 Stop Loss (SL): $0.0282
⚙️ Leverage: Use low leverage (Max 5x)
💬 Your Thoughts?
Are you bullish on JASMY’s breakout potential? Drop your analysis, predictions, or strategies in the comments! Let’s ride this wave and secure those gains together! 💰🔥

(JASMY) jasmy - gray lineWhen the pivot line touches the price the price is moving into higher price targets according to the last few months. (gray line)

JASMY final leg up to 0.09?Upon re-evaluating JASMY, it appears we could see a final leg up, targeting a range between $0.06 (1 Fibonacci extension) and $0.09 (1.618 Fibonacci extension), provided the bounce at the $0.025 price level—which aligns with the 0.5 Fibonacci retracement—is confirmed. This outlook is further supported by the ongoing downtrend in the DXY, adding a bullish undertone to the analysis.
Let’s monitor closely to see if the price continues its upward momentum.

jasmy (JASMY) - lines from before nowI logged in to see the coverage of lines I drew awhile ago. Looks like the price of jasmy is close to one of those lines. I wonder if the price will rebound. Not much else to say. My inclination to believe the price of jasmy would sustain itself was not aligned well with the amount of seduction people found from selling. typical scenarios of investment. I am really trying hard to find an investment that does not lose like this but I remain confident in Jasmy.

Jasmy to 1$? More than realGATEIO:JASMYUSDT
Always should analyse coin on exchanges with history! Big difference between chart Jasmy on Binance and GateIO.
When we check weekly tf we can find out more than 400 days Jasmy in accumulation and disbelief zone around -0.618 FIB
Depends of unlock and adding coins in circulation supply, now only 10% coins on market! But also only 48 Mil Market Cap.
So we can find out next sells zone is around 0.25 cents on weekly timeframe (not now) and next big sales will be at psychological target around 1$.
Whales who accumulate coin over than 400 days know what they do!
Hope you enjoyed the content I created, You can support with your likes and comments this idea so more people can watch!
✅Disclaimer: Please be aware of the risks involved in trading. This idea was made for educational purposes only not for financial Investment Purposes.
* Look at my ideas about interesting altcoins in the related section down below ↓
* For more ideas please hit "Like" and "Follow"!

JASMY , the coin that will melt faces this bull runHello everyone as always I wish u all a very good day, Today we look at JASMY , along with the huge community JASMY has it also has a lot of potential to be an easy 20-30 billion market cap coin. As we can see on the chart we are on a huge cup and handle, we also formed a huge inverse head and shoulders pattern that took ages to form! Measuring from the neckline and the cup and handle target we can see that a 50 cent target is achievable. My personal opinion? JASMY has the potential to go even higher! Definitely keep a bag of this coin within your portfolio.

JASMY is Bullish now & many Traders don't see it !!The price has gradually formed a triangle on the 4-hour time frame, and I don't think this is a descending triangle. This could potentially raise the price to 0.04 in the medium term.
Give me some energy !!
✨We spend hours finding potential opportunities and writing useful ideas, we would be happy if you support us.
Best regards CobraVanguard.💚
_ _ _ _ __ _ _ _ _ _ _ _ _ _ _ _ _ _ _ _ _ _ _ _ _ _ _ _ _ _ _ _
✅Thank you, and for more ideas, hit ❤️Like❤️ and 🌟Follow🌟!
⚠️Things can change...
The markets are always changing and even with all these signals, the market changes tend to be strong and fast!!

J_A_S-M-Y - Its not Jarvis its JASMYJASMYUSDT - So lets introduce you to the magnet lines! Magnet lines are nothing but are places which suck you to bring at that posiiton to give you a hulk smash. If breaching blackline and if only IFF buyers are heavy you see direct wicks to the orange line, But as mentioned scalps can be done, but im more of a green box fan. Mind i am putting shorts or longs based on my overall prospects I am not giving calls, i am showing directions!

Alikze »» Jasmy | Ascending channel - 1W🔍 Technical analysis: Ascending channel - 1W
📣 BINANCE:JASMYUSDT currency was examined on the daily time frame. In the previous analysis, it was noted that it is in a concentration that touched the targets specified in the ascending channel upon exiting it.
🟢 Currently, in the weekly time frame, after reaching the final target in the previous analysis, it encountered selling pressure, which is now below the middle area of the ascending channel.
💎 If it encounters selling pressure again in the middle of the channel, the correction to the channel bottom area can continue, which will be a broken pullback to the swing, and then, if there is demand and support in the channel bottom area, it can continue its growth to the ceiling of the first ascending channel.
💎In addition, if the first channel breaks, it can continue its growth to the large supply area of the second ascending channel ceiling, as wide as the channel width.
»»»«««»»»«««»»»«««
Please support this idea 💡 with a LIKE 👍 and COMMENT 💬 if you find it useful and Click "Follow" on our profile if you'd like these trade ideas delivered straight to your email 📧 in the future.
Thanks for your continued support.🙏
Best Regards,❤️
Alikze.
»»»«««»»»«««»»»«««

JSMY A&E after the IH&SJASMY looks for a way up
SEED_DONKEYDAN_MARKET_CAP:JASMY Has broken the neckline of the IH&S (Inverse head & shoulders) and that target is the baseline for the A&E (Adam and Eve) drawn in white.
The TT (technical target) of this Adam and Eve could jumpstart the revival of JASMY here. The top of the TT could reach the $0.05. And if it's coincidence that happoens to be a major S/R line. So reaching that target and breaking it would bring new highs for $JASMY.
DYOR and use the fibonacci tools to see the potential targets and take profit on the way up. Are you i with leverage then check the potential pullbacks and place the stop loss accorinding to that data. HH and HL wil give you new places for the SL so use that if you want to secure your profits.

