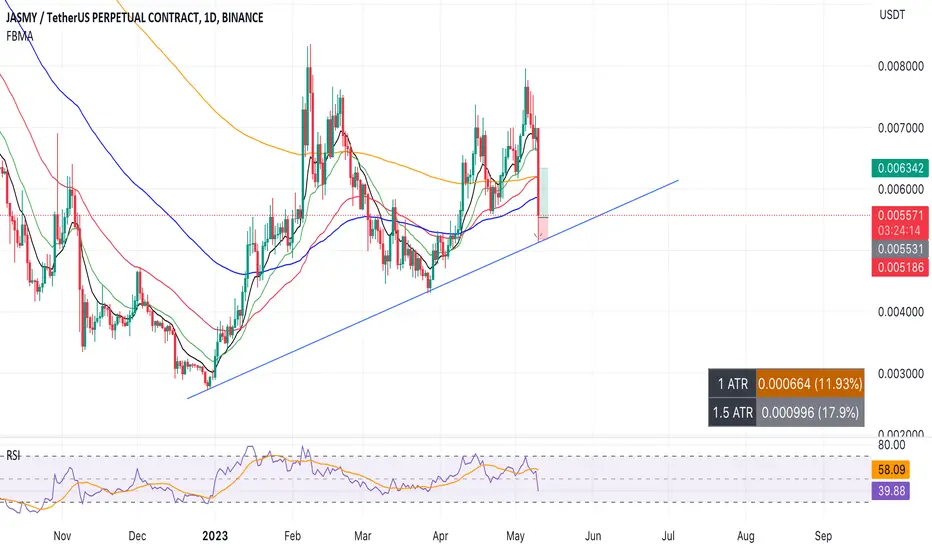
Jasmy Needs To Hold This SupportJasmyusdt
Jasmyusdt needs to hold this support for remain bullish
Iam expecting buyers activity again on this daioy support
If we see any momentup candle on this support it will confirm that jasmy is going for breakout this time
Note : Always wait for confirm & most important ideas are just persnol opinion do your own resreach
JASMYUSDT

JASMY HIGH RISK LONGJASMY came to its support line. Bounced very well. Very oversold. So i expect its growth. Ofc if we break the support line, its better to open SHORT
Jasmy 4 hr time frame H & Shello folks
jasmy 4HR Tf head and sholder pattren formed after righht sholder breakout again coming to the resistance level
now bullish pull back is started already i mention in jasmy head and sholder pattren so now use the pattren but dont forget stop loss
STOP LOSS : mehtod 1 -- Use ATR indicator for stop loss
STOP LOSS : Method 2 - Use moving averages corssover
STOP LOSS : Method 3 - Use combine both of mehtod
if anything wrong please leave your comment below
thanks

JASMY/USDT WCA - Cup and Handle Reversal PatternHello and thank you for taking the time to read my post. Today, we analyze the chart of JASMY/USDT on the weekly scale, focusing on an interesting price pattern known as the "Cup and Handle Pattern." This pattern suggests that JASMY/USDT could be signaling a potential bottoming and reversal after a downtrend.
Cup and Handle Pattern:
The cup and handle pattern is a bullish continuation or reversal pattern that occurs in both uptrends and downtrends. It is characterized by a rounded bottom, called the "cup," followed by a smaller consolidation, called the "handle." The pattern is completed by a horizontal line, known as the breakout level, which connects the high points of the handle. In a nutshell, the formation of the cup and handle pattern signals a potential continuation or reversal of the current trend.
Analysis:
Since 20/11/2021, JASMY/USDT has undoubtedly been in a downtrend. However, the cup and handle pattern on the chart could indicate a potential bottoming signal and reversal of the downtrend. As classical chart analysts, we can immediately recognize this pattern, with the rounded bottom forming the "cup" and the smaller consolidation forming the "handle." A horizontal line at 0.007931 serves as our breakout level, which we want to see surpassed.
It's important to note that the 50 EMA is still far from signaling a bullish environment. Therefore, it is crucial to carefully study and observe the price pattern. However, if a breakout occurs above the horizontal line, we can expect a price increase of approximately 65%.
Conclusion:
The JASMY/USDT chart analysis highlights the cup and handle pattern as a potential bottoming signal and reversal of the ongoing downtrend. Traders should closely monitor this pattern and the breakout level for any signs of a breakout. As always, it's essential to consider risk management and proper position sizing when trading based on chart patterns.
Please note that this analysis is not financial advice. Always do your own due diligence when investing or trading.
If you found this analysis helpful, please like, share, and follow for more updates. Happy trading!
Best regards,
Karim Subhieh

Jasmy Higher timeframe Jasmyusdt
Chart look ultra bullish on higher time-frame
Breakout already confirmed retest is in process incase of succesful retest expecting massive bullish rally

Jasmy Getting Ready For Moon Jasmyusdt
As we mention in previous analysis jasmy successful breakout done retest is in process incase of succesful retest expecting massive bullish move

Jasmy retest of 0,0083Hello friends, so we are waiting to see what will happen with BTC, if it will be a rocket or a spectacular crash. Anyway, in my spare time I test Jasmy and long with higher LV.
Hold on to your hats it's going to be a ride.

Jasmy/usdt Breakout Jasmyusdt
As we discus recently, jasmy is moving as expected
Breakout already confirmed we will wait for retest if retest will successful I am expecting 90-120% Bullish move incoming days

JASMYUSDTDisclaimer: This chart and analysis are not meant to be, and do not constitute financial, investment, trading, or other types of advice or recommendations. #DYOR

JASMYUSDT → Attempted breakthrough. A chance of success JASMYUSDT forms another retest of the strong resistance line. If the daily candlestick closes in the green zone, the growth is likely to continue with the subsequent achievement of our goals.
The previous attempt to break through the resistance resulted in the retest to the strong support at 0.005742.
If you pay attention to the forcing support, we can assume that the whales were actively gaining liquidity in these areas.
Another retest of resistance is formed (counter-trend movement) and there is an attempt to break through the resistance.
Strong support: 0.00675 and 0.00574.
Strong resistance: descending line (channel boundary), level 0.008325 .
I expect that this time the breakout attempt may be successful. Consolidation of the price above the resistance will form bullish potential with further growth to 0.008325 and 0.01200
Regards R. Linda!


JASMY BREAKOUT Eminent Jasmy is Respecting this Symmetrical Triangle for More than 2 weeks And finally Price Reach to Certain Level where breakout is eminent in Next few days
Jasmy still Prime to Test 0.0083$ and then 0.012$ in case Breakout if break down first Major support 0.0058$ Good luck Guys

JASMY is ready for 200-300% short term pump!!Hi dear community and my loyal followers, as you see my RAD pumped more than 200% which I posted earlier. Now I think it's Jasmy's turn to melt faces. As you see I expect this Inverse H&S pattern to play out after breaking major trendline and pump 200-300% with huge green dildo candle. DOn't be surprised if Jasmy jumps 100-150% in a single day. BTW past 3-4 months interest in Jasmy has been increased which proves buying volume.

Time to Buy Jasmy 40-70 % profitJasmy is making Head and sholder and is going to give 40- 70 %profit in next two weeks

Jasmy 4 hr time frame H & SHellow foks
today i find jasmy four hour time frame INVERTED HEAD AND SHOLDER PATTEERN
IF BREAK THE TREND LINE TARGET 1 IS POSSIBLE TO ACHIVE
OR BELOW THE PRICE CONTINUE AGAIN WE GO TO SHORT ORDER TARGET HEAD SUPPORT LINE
TOMMOROW BTC MOVEMENT BASED ON THIS ORDER BLOCK
IF ANY THING I MISSED PLEASE PUT YOUR COMMENT BELOW
Thanks and regards

JASMYUSDTHello Traders,
Hope all are good, we can a recent bullish trend in here which is likely to come to an end as bearish divergence can be seen and unable break the last high and successfully broken last low. We can place an sell stop entry as per marking on the chart.
Cheers.


JASMYUSDT fast pushAfter breaking above the triangle, the probability favors the short-term uptrend. We have a buy limit order, slightly below the current price.

#Jasmy | #Usdt#Jasmy | #Vip_Pack | #NUM_SV35
Long
Max lev 1~10x
Entry : 0.00596
SL: 0.005694
TPs :
0.00602
0.00608
0.006218
0.00639
Don’t risk more than 1% of your capital.

JASMYUSDT → Another attempt to break the trendJASMY forms a global reversal pattern, which opens new potential.
The coin forms a pre-breakout consolidation near the upper limit of the channel. The price successfully breaks the line.
JASMY opens for itself a new range. On the daily chart, yesterday, the price breaks the resistance and closes above the line, forming a local resistance level at 0.006577 and with another retest and breakout of that area, we might see a strong momentum towards 0.01000
Daily moving averages are acting as support, on the daily timeframe the price consolidates above the previously broken line. The way is open for the upside towards 0.008325
Strong support: previously broken channel line, support at 0.005742
Strong resistance: 0.006577 (breakdown strategy) 0.0069
I expect the continuation of growth after the final fixation of the price above the channel. The medium-term target is 0.008325 , the long-term target is the liquidity zone 0.012
Regards R. Linda!

Jasmy Another Possible Breakout Jamsyusdt
In the Jasmyusdt chart, we have observed the formation of a descending broadening wedge pattern. This indicates a potential bullish move of 70-100% in the case of a successful breakout. It is important to keep a close eye on the price action and volume to determine the likelihood of a breakout. If the breakout does occur, it is recommended to manage risk properly and consider taking advantage of the potential bullish move.


JASMY Long setup: MASSIVE moveMajor trend reversal is in progress for Jasmine, As its currently retesting trend line on weekly chart,
Two entries are shown in chart based on my golden 0.5 and 0.66 pull backs,
Also its BTC pair is testing a very strong support level,
Basically its great time to get a long position on spot as first entry.
Lets see
