JASMYUSDT LONG#JASMYUSDT
I think that in the near future we will reach the price of 0.006982, where we may face resistance. If this range is broken, the next global resistance may be the price around 0.0085.
"Long" as long as we are above 200 ema (yellow line on the chart) and 20 ema (green line) on the Daily TF.
JASMYUSDT

$JASMY/USDT 2D (#Bybit) Big falling wedge breakout & retestJasmyCoin finally regained 50MA support and downtrend seems over, let's swing long on demand zone, targeting 100EMA.
⚡️⚡️ #JASMY/USDT ⚡️⚡️
Exchanges: Binance Futures, ByBit USDT
Signal Type: Regular (Long)
Leverage: Isolated (1.0X)
Amount: 4.5%
Current Price:
0.004642
Entry Zone:
0.004420 - 0.003402
Take-Profit Targets:
1) 0.005969
2) 0.007519
3) 0.009069
Stop Targets:
1) 0.002189
Published By: @Zblaba
Risk/Reward= 1:1.2 | 1:2.1 | 1:3.0
Expected Proft= +52.6% | +92.3% | +131.9%
Possible Loss= -44.0%


Jasmy Breakout Jasmyusdt
Breakout Confirmed, Expecting 25-40% Bullish Move
Remember: We only give ldea's from our
experience and knowledge, it does not
mean that it will be 100% correct, the
market is always unpredictable, anything
can happen anytime.
Always trade with your own research and
knowledge. If You Are Satisfied With Our
Work Then Join.

JASMY SHOOOOOORT!Some level of overbuying
SQZMOM shows that it won't take too long to go into decline
I think it could be a good quick short.

JASMY CAN GO UPPER VERY SOONHi, dear traders. how are you ? Today we have a viewpoint to BUY/LONG the JASMY symbol.
For risk management, please don't forget stop loss and capital management
When we reach the first target, save some profit and then change the stop to entry
Comment if you have any questions
Thank You

Jasmycoin Breaking descending Channel Breaking descending channel in h4 timeframe incase Of successful Breakout expecting 40 to 45% Bullish Move

MOST MEN LIVE LIVES OF QUIET DESPERATION.We all know how price action works.
My message to you is look at the chart and see the patern.
We can see in this chart that there is volume and there is money in this coin.

Jasmy looks delicious for a long Hi friends, I just checked out Jasmy Long and it looks very promising, respecting the trendline. The RSI is also indicating a potential pump from the trendline.
I'm expecting a 13% increase from here to .006251
Follow me for more charts
and please don't forget to like :)

JASMYUSDT long-term uptrend starts hereWhile we have a very conservative upside target, JASMY should fly in the coming weeks. It seems we have bottomed out and buyers are on the hunt.

$JASMY - Long Idea.Odin Zone. I can finally give away this awesome looking setup. With an astonishing 35:1 RR, this one is a no brainer.
Keep in mind that this could take 2-3 weeks to play out, and we're not safe from the black swan event. So putting the SL will be super important, as well as having a plan B for if that SL hits: There are other entries to be had as well, the .786 zone has some confluence as well.
Looking the macro count, where you can see I have the initial bearish move being done, with the 1st wave of the new impulse also done, barring a Black Swan event. If we zoom in a bit... we see the subwaves of C. So depending on whether C is a diagonal or an impulse, that will determine the timing of our entry hitting.
I won't provide the exact numbers for the ideas here, you'll have to look on the chart.
Safe trades to all, and don't forget your SLs.

Jasmy expected move Jasmy holding major s&r area with good volume
And ready for a 50% move if Bitcoin reamin bullish Jasmy clear move expected.
Target's
0.0084
0.0094
0.01045
0.01900
Buy and hold in spot
DYOR

✴️ JasmyCoin | Focus On The Positive (Name Your Altcoin #31)We have a situation here with JasmyCoin (JASMYUSDT) which immediately called my attention after opening this chart.
We have the same pattern of a reversal forming after a low was hit/support found in late December, the same pattern as most of the Cryptocurrency trading pairs within the Altcoins market but JASMY's reversal compared to the others is weak.
While one of the main signals I look for in these charts is the recovery above the May/June 2022 low, this hasn't taken place here.
After six weeks straight closing green, JASMYUSDT is still trading below this level, in fact a rejection happened this week as this level was hit.
Marked here with a dark green dashed line.
Let's focus on the positive!
While this is a negative signal, we have many more bullish ones.
A major downtrend has been broken, coinciding with a bullish breakout off a falling wedge pattern.
The 26-Dec. hammer candlestick pattern has been confirmed by the following 5 weeks closing green, this is already old news.
More recently, JASMYUSDT managed to close above EMA21.
EMA10 was conquered in early January.
EMA10 gauges the short-term potential of a pair but here we are looking at the weekly timeframe, closing above this level sends out that much stronger of a signal.
While this week is red, we have a very strong support level marked light blue on the chart.
While JASMYUSDT stays above this level the bulls remain in full control, mid-term bullish potential remains active. That is above 0.004176.
Even if JASMYUSDT were to enter a strong correction and move below this level, the bullish potential remains intact above the late December low (0.002726).
We have 460% potential based on the current chart.
This is huge... Even if one is greedy this is still a lot and this can happen within a few short weeks or 1-2 months maximum.
Of course, things can vary and that's why we define/look at the support levels first.
If our support levels fail, the bullish bias is invalidated.
Also, knowing these levels we can remain calm if prices drop because we know exactly what to expect.
The first target on this weekly chart is EMA50 for 175%.
Why this level?
If you look at FETUSDT, FTMUSDT and other altcoins that went ahead, you will notice that they stopped at EMA50 first and then continued higher.
As these pairs retrace, money flows to smaller projects and they grow.
If you see them moving ahead, you know that the smaller pairs will also go there when it is their turn.
There are many groups and many sections of altcoins, first one group, then the next and the next.
First Bitcoin, then the TOP10, then TOP50, etc.
One can figure out what is going to happen to the entire market just by tracking the few projects that moved first.
One can spot the trend reversal before it happens by looking at all the markets together, futures, stocks, indexes, crypto, etc.
I am writing for your learning and entertainment of course... You never see 6 weeks closing green to be followed by a new low.
When you get this type of price action, is because the bulls are in full control.
Bullish for us simply means higher highs and higher lows.
Thank you for reading my friend.
I hope you enjoy the content.
Namaste.

Jasmy update, is it done retracing? If you find this info inspiring/helpful, please consider a boost and follow! Any questions or comments, please leave a comment! Also, check out the links in my signature to get to know me better!
Played out as the bearish Elliott Wave variant was laid out.
if it prints an impulse down the correction could just be beginning. If it prints a ZZ, could lead to continuation.
Cheers!

JASMYbroke major trend line , retesting now ,
may retest 0.0028 bottom , depends on btc !
not financial advice.

Jasmy jamminIf you find this info inspiring/helpful, please consider a boost and follow! Any questions or comments, please leave a comment! Also, check out the links in my signature to get to know me better!
This would probably be the most conservative Elliott wave impulse variant.
Got others, but want to see if it gives a retrace first.
Coming up and breaking .0082 and flipping it would have me considering more bullish alts.
Cheers!

WHAT'S WRONG WITH JASMY ?There are many reasons for shorting Jasmy, but the biggest reason is that the supply of this token was unlocked recently. Will or how can it be stable. That's why I am shortening it

JASMY GO TO MOON VERY SOONHi, dear traders. how are you ? Today we have a viewpoint to BUY/LONG the JASMY symbol.
For risk management, please don't forget stop loss and capital management
When we reach the first target, save some profit and then change the stop to entry
Comment if you have any questions
Thank You

JasmyCoin Chart AnalysisThe thing about the altcoins vs USD/USDT is that most of them move just like Bitcoin and this is the case with JasmyCoin (JASMYUSDT).
I am doing this analysis on the request of @Jay3000, a precious follower of ours.
So, the chart is the same as Bitcoin.
Peak/All-Time High in November 2021 followed by a major downtrend.
Lower low with lower highs.
There is just one question possible here, is the downtrend over?
Is the bear market over?
Impossible to figure out from the chart.
We only know after the bottom is in.
We can only know when the bottom is in/confirmed when the downtrend is broken.
As long as the downtrend remains active, our bias remains with the trend.
We can expect lower prices until the downtrend ends.
What to expect?
It is likely we see another major drop as the bear market climax or the bottom can... This is just guessing ...
Here is what the chart says:
- Above $0.0065, the bulls can move ahead.
- Any trading below this level and the bear market hasn't end.
I hope that helps.
Namaste.
✴️ JasmyCoin Update by Request (350% Profits Potential)I see your interest in this altcoin pair and acknowledge it, so here is the update as requested.
We look at the chart fresh/new, even though the last trade idea was good.
We have the major downtrend taking place for JasmyCoin (JASMYUSDT) since November 2021, here we are looking at it since March 2022.
Since March 2022 a long-term bullish divergence has been building up on the RSI.
A stronger bullish divergence came in again from October 2022 vs the current December 2022 low.
JASMYUSDT hit a strong lower low between these two dates while the RSI hit a strong higher low.
So the yellow cup on the chart is the 'liquidity hunt'/stop-loss hunt move by the market.
A new low is hit but prices quickly recover and this is marked with a bullish divergence on the RSI, which confirms that JasmyCoin is not due to go lower but instead the market was looking for needed liquidity.
Now that this has been taken care of, the trend can change... Or so the signals are saying.
We have a very strong RSI at 60.
A strong RSI near support/low prices is a heavy signal, it is worth a lot.
JASMYUSDT is also now trading above EMA50, another very strong signal.
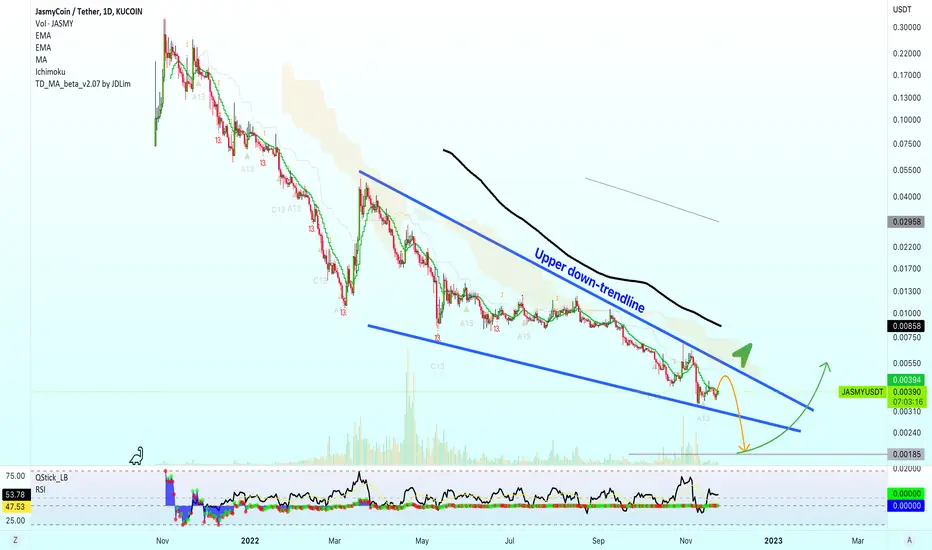
And the major down-trendline here marked as a falling wedge pattern has also been broken.
All this opens the door to higher prices.
Knowing this, reading these signals one would be tempted to take action.
Here is how a professional or experienced trader would go about using this information:
1) Buy with a bullish bias (anticipating prices will grow).
The targets are on the chart, if it grows then sell according to his/her own system/strategy.
2) Control risk/define risk.
A short-term stop-loss can be used around 0.00335.
(If prices move and close below this level, close the trade).
A stronger stop-loss can be used around 0.00273.
(If prices move and close below this level, close the trade).
This experienced trader did the job.
He bought with the right signals and defined his risk in case things go wrong.
If there is a bullish follow up, then we are green and the rest is to enjoy the ride on the way up.
This is not financial advise.
I am sharing my experience, views and opinion.. Initial, I was just reading the chart.
Thank you for your continued support.
Namaste.

JASMY/USDT | looks Bullish here..!!
#JASMY Looks Bullish here..🏄♂️
Finally, Falling Wedge Breakout has Confirmed in Daily timeframe Chart..
RSI is Printing Bullish Divergence.
Pretty Decent Buying Volume Coming in..
Grab Some with Low Risk & Hold with Patience..
Please like the idea for Support & Subscribe for More ideas like this and share your ideas and charts in Comments Section..!!
Thanks for Your Love & Support..!!

#Jasmy | #UsdtTargets : Chart (Green lines)
Don't risk more than 3% of capital.
_____________________________________

viewpoint Short For JASMYHi, dear traders. how are you ? Today we have a viewpoint to SELL/SHORT the JASMY symbol.
For risk management, please don't forget stop loss and capital management
When we reach the first target, save some profit and then change the stop to entry
Comment if you have any questions
Thank You
