NEW POSITION $JBLU Target 22.55 for 18.37% $JBLU Target 22.55 for 18.37%
Or next add level is at 15.55
I'm looking at Airlines and Cruise Ships around here...
—
On the far right of the chart is my Average (Grey) Current Target (Green), and Next Level to add (Red) Percentage to target is from my average.
I start every position with 1% of my account and build from there as needed and as possible.
I am not your financial advisor. Watch my setups first before you jump in… My trade set ups work very well and they are for my personal reference and if you decide to trade them you do so at your own risk. I will gladly answer questions to the best of my knowledge but ultimately the risk is on you. I will update targets as needed.
GL and happy trading.
JBLU
American Airlines AAL ready to bounce yet?I've never traded airline stocks. I like AAL here though-seeing a potential broadening formation. I might consider a small position and set a target for that unfilled gap. Longer term, airline stocks appear cheap right now although I'm not ready to turn bullish on them yet. I'm just not that familiar with them.. but this looks like it has good potential.
JetBlue IdeaThe current fair value of the stock based on Buffets equation is just over $40 meaning there is a lot of room for the stock price to grow. Earnings was stong and price tested the new resistance of $20 and looks to be testing to make new highs currently. Looking for potential pullback or rejection of next level to enter in on a lower price.
JetBlue BreakdownThe daily chart of JetBlue created a cup & handle type pattern but the price has broken down today out of the symmetrical triangle pattern it had created in recent days. The price has come close to touching my initial price target before finding some buyers again.
Note that the initial price target is near the 200-day EMA line as well, an important level for this stock to hold. There is not a lot of volume supporting the price before reaching the $17.30 price range should the price break its 200-day EMA.
JBLU - DAILY CHARTHi, today we are going to talk about the Jetblue Airways and its current landscape.
With more than 400 planes grounded, 737 Max crisis is still backlashing Boeing Co., and now the Boeing problem could become the industry "problem" as the Federal Aviation Administration (FAA), may fundamentally change the certification process of aircraft, by prioritizing the human factor in the proceeding. The FAA wants to appraise how quickly airline pilots can react to emergency situations and possibly evaluating how the design o planes make it easier or harder for the pilot's reaction. The proposals need to be the debated of Congress, that has been criticizing the FAA administrator Stephen Dickson over its close relationship with the industry, Dickson it's a former employee of Delta Air Lines.
The effects of the 737 problems, combined with the slowing down economy entails strong headwinds for the whole industry, plus this new regulatory change, companies could see a shrinking of its orders, and more costs to have products in-line with the new possible FAA framework. The positive highlight of the day for the sector goes to the orders coming from several airlines, like Emirates that ordered 50 Airbus A350 jets in a deal worthing $16 billion; Air Arabia ordered 120 Airbus A320s in a $14 billion deal, and Etihad will take 20 Boeing Co. 787 Dreamliners.
Thank you for reading and leave your comments if you like.
To have access to our exclusive contents, join the Traders Heaven today! Link Below.
Disclaimer: All content of Golden Dragon has only educational and informational purposes, and never should be used or take it as financial advice.
JBLU: Swing trade opportunityBuy here, risk 1-3 Average True Ranges down, to ride it back up to the recent top or into resistance. Watch the 'key earnings levels' for a support/resistance map in price. You can get this indicator in @timwest's indicator pack. Really useful to navigate through the chop.
With oil so extended, airlines oversold into support, we have a nice low risk setup. I'm loading up here.
Cheers,
Ivan Labrie.
JBLU Approaching Resistance, Potential Reversal! JBLU is approaching its resistance at 18.59 (100% Fibonacci extension x2, 50% Fibonacci retracement, horizontal pullback resistance) where it could potentially drop to its support at 17.47 (76.4% Fibonacci retracement, horizontal swing low support).
Stochastic (55, 5, 3) has reversed off its resistance at 96% where a corresponding drop could occur.
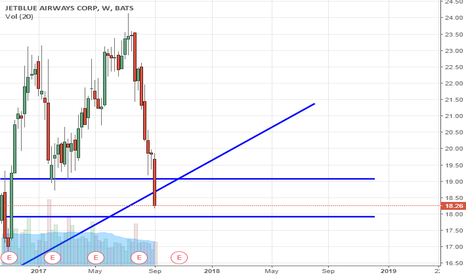
JBLU - Wait to Long JBLUJBLU just breaks its $19 support, and also the multi-years upward trend.
With no major news recently, the recent downward trend is driven by fear of poor travel activities after Harvey and Irma.
Recent drop is a good opportunity to initiate a position. However, it is good to wait for the drop is stable down and after the impact of Irma is uncovered, which is going to be the next couple trading sessions.
JBLU Bearish Daytrade Played the Gap Bearish. The point of the idea post is to show the succession of Stop placement as the trade moved in my direction. The dotted line is the 200 EMA on the daily chart which is why the stop movements happened more frequently as the trade got closer to that price point.
Trade was setup on the 1 minute chart and then followed on the 5 minute chart. Was stopped out of trade near the end of the day at about 1.5R


