JD.cm | JD | Long at $33.16Like Amazon NASDAQ:AMZN and Alibaba NYSE:BABA , I suspect AI and robotics will enhance JD.com's NASDAQ:JD automation in warehousing, delivery, and retail. There is some risk here, like other Chinese stocks, that they could be delisted from the US market if trade/war tensions rise. But I just don't think that is likely (no matter the threats) due to the importance of worldwide trade and investment. I could be way wrong, though...
NASDAQ:JD has a current P/E of 8.1x and a forward P/E of 1.2x, which indicates strong earnings growth ahead. The company is healthy, with a debt-to-equity of 0.4x, Altmans Z Score of 2.6, and a Quick Ratio of .9 (could be better).
From a technical analysis perspective, the historical simple moving average (SMA) band is still in an overall downtrend but starting to level out (accumulation of share area). It is possible, however, that the price may drop into the $20s to close out the existing price gaps on the daily chart as tariff threats arise. But that area is another personal entry zone if fundamentals hold.
Thus, while it could be a bumpy ride and the risk is there for delisting, NASDAQ:JD is in a personal buy zone at $33.16 (with known risk of drop to the $20s in the near-term).
Targets into 2028:
$44.00 (+32.7%)
$52.00 (+56.8%)
Jdcom

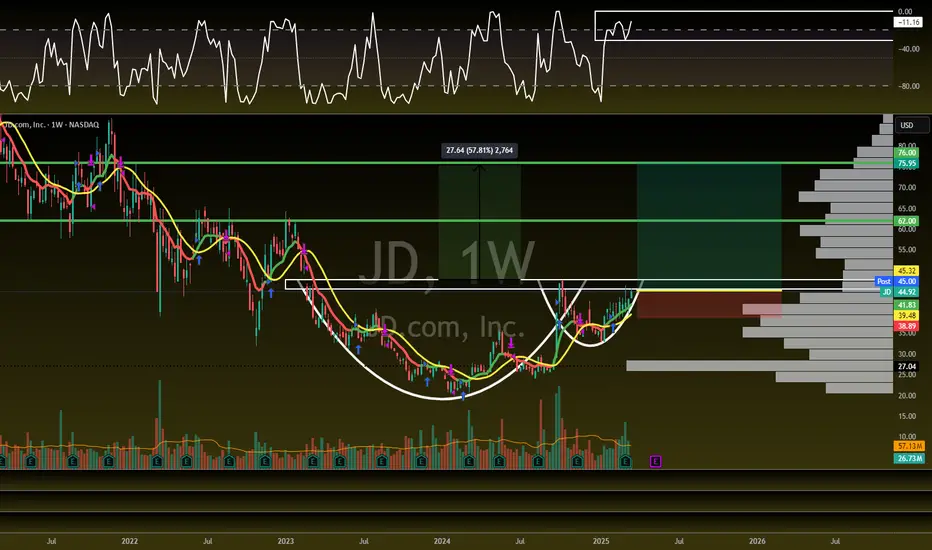
China Trade Setup with 67% Upside!NASDAQ:JD - H5_W Trade Setup: 🚨
CupnHandle Breakout =
🎯$62
📏MM: $76
- Multi Year CupnHandle
- Green H5_W
- Volume Shelf with GAP
- Thriving WCB
- China is HOT!
Not financial advice
China's money supply explodes.China's revision of its M1 money supply calculation in January 2025, which now encompasses individual checking accounts and assets held in non-bank financial institutions, seeks to deliver a clearer understanding of liquidity within its economy. The reported surge from $67 trillion in December 2024 to $112 trillion in January 2025 has ignited discussions, with some viewing it as a strategy to obscure underlying economic issues, such as a potential deflationary debt spiral.
The People's Bank of China has declared a "moderately loose" monetary policy for 2025, aiming to boost the money supply and lower interest rates to foster economic growth, a move that may be connected to the M1 recalibration. This shift takes place against a backdrop of broader macroeconomic adjustments, including a 5% GDP growth target and initiatives to stabilize the real estate sector, as detailed in China's 14th Five-Year Plan for 2025.

JD.com (JD) AnalysisCompany Overview:
JD.com NASDAQ:JD is one of China’s leading e-commerce and logistics giants, rapidly expanding into cloud computing and AI-driven solutions. With a strong focus on efficiency, retail innovation, and policy-driven tailwinds, JD.com is well-positioned for long-term growth.
Key Catalysts:
Chinese Government's “Trade-In” Policy Boost 📈
The extended consumer electronics trade-in policy is expected to accelerate sales, driving demand across JD’s platform.
Full Acquisition of Dada Nexus 🚚
JD’s 100% ownership of Dada Nexus strengthens its last-mile delivery efficiency, improving logistics and customer satisfaction.
Omnichannel Expansion: JD MALL & JD E-Space 🏬
JD is expanding its offline footprint with JD MALL and JD E-Space, enhancing its omnichannel retail strategy for deeper customer engagement.
AI & Cloud Computing Growth ☁️
JD’s investment in cloud and AI positions it as a tech-driven e-commerce leader, driving new revenue streams.
Investment Outlook:
Bullish Case: We are bullish on JD above $34.00-$35.00, supported by policy tailwinds, logistics integration, and AI-driven retail innovation.
Upside Potential: Our price target is $60.00-$62.00, reflecting enhanced logistics, e-commerce expansion, and growing cloud adoption.
📢 JD.com—Innovating E-Commerce with AI & Logistics. #JD #ECommerce #AI #CloudComputing

Can China's E-commerce Giant Defy Economic Gravity?In a landscape where economic headwinds meet technological innovation, JD.com's recent performance presents a fascinating paradox. Despite China's persistent economic challenges, the e-commerce powerhouse delivered a 5.1% revenue growth and an impressive 29.5% surge in earnings per share, demonstrating resilience in an increasingly competitive market. This dichotomy between macroeconomic pressures and corporate performance raises intriguing questions about the future of digital retail in the world's second-largest economy.
The company's strategic metamorphosis reveals a sophisticated approach to market challenges. By leveraging its robust logistics infrastructure and forging strategic partnerships with former rivals like Alibaba's Taobao, JD.com is rewriting the rules of competitive dynamics in Chinese e-commerce. The firm's participation in government stimulus programs, particularly the 150-billion-yuan trade-in initiative, showcases its ability to align corporate strategy with national economic objectives, creating a powerful synergy that benefits both shareholders and consumers.
However, the true intrigue lies in JD.com's balancing act between growth and profitability. While marketing expenses surged 25.7% and free cash flow turned negative, the company's core retail division achieved a remarkable 6.1% revenue growth. This apparent contradiction points to a larger truth about modern retail: success in today's market requires bold investments in future capabilities, even at the cost of short-term financial metrics. With analysts maintaining an 89% Buy rating and the stock trading at an attractive 8.9 times forward earnings, the market seems to believe in JD.com's long-term vision despite near-term turbulence. Will this calculated gamble on future growth pay off in China's evolving economic landscape?

JD.COM PT63$ after breaking the long term trendlineJD.com broke the minor trend lines and is heading towards the long term trendline. This level is also enforced by prior highs/lows that acted as pívot points.
If broken, I would expect to extend the final of the third Elliot leg to the 63$ area, then back test the broken trendline, and then attack the ATH again.
Please let me know your thoughts!

JD.com (JD): Massive 97% Rally—What's Next?We mentioned Chinese stocks a while ago, and finally, they're starting to pay off—big time. We bought shares of JD.com back in July, and after a small dip, the stock soared an impressive 97% in just 65 days.
Shares of U.S.-listed Chinese companies are gaining momentum, fueled by continued stimulus efforts. September's PMI data beat expectations despite a decline in factory activity, which has further bolstered hopes for increased stimulus. Over the past week, JD.com's stock surged following the People’s Bank of China's aggressive monetary easing measures. The central bank reduced the reserve requirement ratio (RRR) by 50 basis points, bringing it down to 9.5%. This move will inject around 1 trillion yuan (approximately $140 billion) into the financial system. The increased liquidity gives banks more capital to lend, easing financial pressures on businesses like JD.com that rely heavily on consumer spending and economic confidence.
JD.com, often considered a barometer for China’s domestic consumption, has benefited significantly from this shift in sentiment, with investors betting that further stimulus measures could lead to increased consumer spending on e-commerce platforms.
From a technical perspective, there's not much left to say—we took some profits on JD.com, as this parabolic rise could either continue or see a pullback before another leg higher. All indications point towards further gains for JD.com, as it has smashed through all resistance and trend channels with remarkable strength. Our stop loss is set at break even, and we’re letting this trade continue to run.

Technical Analysis on JD.comJD.com has experienced a strong bearish trend since February 2021, reaching its lowest point in 2024, near the support area of $20, with an overall loss of about 80% of its value.
By conducting a volume analysis using the Volume Profile of the entire history, we can see that JD.com was recently rejected from a significant support level, POC 1, around the $25 price zone, also breaking the descending trendline. This provides a strong signal for a potential reversal.
In a short time, the stock has reached another important volumetric area, POC 2, which could act as the first resistance level. At this point, we might observe the first reaction of price rejection.
Considering the broader momentum, particularly the economic situation in China, the stock may quickly overcome this resistance. If JD.com moves above POC 2, it would likely face few obstacles in reaching the next resistance level (R1) just below $70, given the low trading volume in this price range.

JD.com Stock Jumps in Premarket Trading on $5 Bln Buyback PlanJD.com, (NASDAQ: NASDAQ:JD ) one of China’s largest e-commerce giants, made headlines this week with the announcement of a substantial $5 billion share buyback program, effective from September 2024 to August 2027. This move has sent positive ripples through the market, with U.S.-listed shares of JD.com jumping over 4% in premarket trading. But what does this mean for investors, and how does it align with the broader market dynamics?
JD.com's Bold Decision
JD.com’s decision to implement a $5 billion share repurchase program is a bold signal of confidence from the company’s leadership. The buyback is JD.com's second major repurchase initiative this year, following a $3 billion repurchase in March 2024, which the company fully utilized within just five months. This rapid execution highlights JD.com’s commitment to enhancing shareholder value, even in a challenging economic environment.
The timing of this buyback is particularly noteworthy. It comes shortly after Walmart’s decision to sell its entire $3.7 billion stake in JD.com (NASDAQ: NASDAQ:JD ), a move that raised concerns about the e-commerce giant’s future in the world’s second-largest economy. The announcement of the buyback has helped mitigate some of these concerns, showcasing JD.com’s robust financial position, supported by a cash reserve of $20.2 billion.
Citi analysts, who had anticipated this move, placed JD.com on a 30-day upside Catalyst Watch, citing the company’s aggressive buyback pace as a key factor in maintaining investor interest. The analysts also maintained a "Buy" rating on JD.com, underscoring the stock’s attractive valuation.
Technical Analysis: A Mixed Signal for Traders
From a technical perspective, JD.com’s stock shows both promise and caution. The stock's recent premarket surge of over 4% is encouraging, but it also reveals underlying concerns. As of Monday’s close, JD.com’s Relative Strength Index (RSI) stood at 43.67, placing the stock in a potentially oversold region. This indicates that while the stock has experienced downward pressure, there may be limited buying momentum to sustain a prolonged uptrend.
For a sustained bullish reversal, JD.com (NASDAQ: NASDAQ:JD ) would need to break through key technical levels. The immediate pivot point is at $27.52, a level that, if breached with strong buying volume, could confirm a resurgence in price. However, the stock's current RSI suggests that any bullish momentum might be short-lived unless supported by broader market conditions and positive news flow.
The stock is also trading below its 50-day moving average, which typically signals a bearish trend. However, the recent buyback announcement could act as a catalyst for the stock to test this moving average in the coming days. If JD.com (NASDAQ: NASDAQ:JD ) can sustain its price above this level, it would be a positive signal for long-term investors.
Market Context: Navigating a Sluggish Chinese Economy
JD.com’s buyback plan comes at a time when China’s retail market is grappling with macroeconomic challenges. The ongoing property slump, consumer spending hesitancy, and employment uncertainties have made it difficult for even the largest players to maintain growth. This is evident from the recent market reaction to PDD Holdings’ earnings report, which wiped $55 billion from its market cap and dragged down other Chinese e-commerce stocks, including JD.com.
Despite these challenges, JD.com’s buyback strategy demonstrates the company’s resilience and its commitment to returning capital to shareholders. It also reflects the broader trend among Chinese tech giants, like Alibaba, which announced a $25 billion share buyback earlier this year, to use buybacks as a tool to stabilize stock prices amidst economic uncertainty.
Conclusion: A Calculated Bet with Cautious Optimism
JD.com’s $5 billion share buyback plan is a calculated bet to instill confidence in the market and support its stock price amid a challenging economic backdrop. For investors, this move signals JD.com’s financial strength and its willingness to reward shareholders, despite external pressures.
However, from a technical standpoint, caution is warranted. While the stock’s recent premarket surge is a positive development, the underlying technical indicators suggest that a sustained uptrend may require more robust buying momentum. Investors should keep a close eye on key technical levels, particularly the $27.52 pivot point, and monitor broader market conditions as JD.com navigates the complexities of China’s economic landscape.
In summary, JD.com’s buyback plan is a positive fundamental development, but the stock's technical signals urge a cautious approach. Investors with a long-term view may find value in JD.com, but those with a shorter horizon should watch for confirmation of a bullish reversal before committing capital.

JD.com Stock Plummets 10% on Walmart Sellout Key Points:
- Walmart to sell its 9.4% stake in JD.com ( NASDAQ:JD ), raising up to $3.74 billion.
- The move aligns with Walmart’s strategy to focus on its core Chinese operations, including Walmart China and Sam’s Club.
- JD.com’s shares plummet over 10% in Hong Kong following the announcement, highlighting the fragility of Chinese tech stocks.
Walmart’s Move
In a significant strategic shift, Walmart has confirmed its intention to sell its 9.4% stake in Chinese e-commerce giant JD.com. ( NASDAQ:JD ) The decision, which could raise up to $3.74 billion, underscores Walmart's renewed focus on strengthening its core operations in China, specifically its Walmart China and Sam’s Club brands. This move marks the end of an eight-year partnership between the two retail giants, a relationship that was once seen as a gateway for Walmart to tap into China’s burgeoning e-commerce market.
Walmart’s decision to divest from JD.com ( NASDAQ:JD ) comes as part of a broader strategy to redeploy capital towards other priorities. A spokesperson for Walmart told CNBC, "This move allows us to focus on our strong China operations for Walmart China and Sam’s Club, and deploy capital towards other priorities." Despite the sale, Walmart emphasized its commitment to maintaining a commercial relationship with JD.com, reflecting the value both companies have seen in their partnership over the years.
Impact on JD.com
The announcement had an immediate and severe impact on JD.com’s stock price. Shares of JD.com plummeted over 10% in Hong Kong and fell 9.5% in after-hours trading in the U.S., making it the largest loser on Hong Kong’s Hang Seng Index. The sharp decline highlights the vulnerability of Chinese tech stocks, which have been battered by market volatility and economic uncertainties.
The sale of Walmart’s stake in JD.com ( NASDAQ:JD ) is being priced between $24.85 and $25.85 per share, representing a discount of up to 11.8% compared to JD.com’s closing price in the U.S. on Tuesday. This pricing strategy signals the challenges JD.com faces in maintaining investor confidence amid a rapidly changing economic landscape in China.
The End of an Era
Walmart first acquired a 5% stake in JD.com ( NASDAQ:JD ) in 2016, entering into a strategic alliance that was expected to benefit both companies. For Walmart, the partnership was a way to tap into China’s fast-growing e-commerce market, while JD.com ( NASDAQ:JD ) gained access to Walmart’s extensive retail expertise and global supply chain.
Over the years, Walmart increased its stake in JD.com ( NASDAQ:JD ), reaching 9.4% by March 31, 2023, with over 289 million shares. However, the economic environment in China has shifted dramatically since the partnership began. The once-promising alliance has delivered diminishing returns as JD.com struggled to maintain its growth trajectory amid a challenging market environment for Chinese tech companies.
JD.com’s recent earnings results for the June quarter showed only a 1.2% growth in revenue, reflecting the difficulties the company faces in sustaining its momentum. The company's market value has halved since early 2022, a stark indication of the challenges it now faces.
Walmart’s Future in China
Walmart’s decision to sell its stake in JD.com ( NASDAQ:JD ) reflects a broader trend among multinational corporations to reassess their investments in China amid growing economic and regulatory challenges. By focusing on its core Chinese operations, Walmart aims to strengthen its position in the country’s retail market, particularly through its Walmart China and Sam’s Club brands, which continue to perform well.
The sale of JD.com ( NASDAQ:JD ) shares will provide Walmart with significant capital that can be redeployed to enhance its retail operations in China, invest in new technologies, and pursue other strategic priorities. While the sale marks the end of an era for Walmart and JD.com, it also signals a new phase for both companies as they navigate the complexities of China’s evolving market.
Technical Outlook
At the time of this writing, shares of JD.com ( NASDAQ:JD ) are experiencing a notable decline, having dropped 7.9% during the premarket trading session on Wednesday. This decline has resulted in a relatively weak Relative Strength Index (RSI) reading of 48, which suggests some underlying weakness in the stock's momentum. When examining the daily price chart, there is a distinct gap down that has formed, signaling a robust bearish reversal pattern, which raises concerns for investors. Should the stock price continue to depreciate and fall below its one-month low, this movement could trigger a considerable amount of selling pressure from traders and investors alike, potentially resulting in further erosion of JD.com’s stock value.
Moreover, it is important to note that JD.com ( NASDAQ:JD ) is currently trading below its 50-day, 100-day, and 200-day Moving Averages (MA), which further consolidates a bearish outlook for the stock. This positioning below these crucial moving averages is often interpreted by market participants as a sign of ongoing weakness, leading to a lack of investor confidence and potentially prompting more sellers to enter the market. The combination of these factors paints a challenging picture for JD.com as it navigates these troubling market conditions.
Conclusion
Walmart’s decision to sell its stake in JD.com ( NASDAQ:JD ) is a calculated move that reflects the company’s strategic priorities and the shifting economic landscape in China. As JD.com ( NASDAQ:JD ) faces increasing challenges in maintaining its growth, Walmart’s focus on strengthening its core Chinese operations could position the retail giant for sustained success in one of the world’s most dynamic markets. The implications of this sale will be closely watched by investors and market analysts as both companies chart their respective futures in a rapidly changing environment.

JD.com Shares Surge 5.7% as Earnings Beat ExpectationsJD.com (NASDAQ: NASDAQ:JD ) shares experienced a significant uptick, climbing 5.7% on Friday after the Chinese e-commerce giant reported better-than-expected quarterly earnings. The company’s impressive performance was driven by strategic price cuts that successfully attracted cost-conscious consumers, despite a challenging economic environment in China.
Earnings Boost Amidst a Competitive Landscape
For the quarter ending June 30, JD.com (NASDAQ: NASDAQ:JD ) reported a 92% year-over-year increase in net income, reaching 12.64 billion yuan (approximately $1.77 billion). This surge in profitability comes despite a modest revenue growth of just 1.5% to 257 billion yuan. The results highlight JD.com's ability to maintain its profitability even as China’s e-commerce sector faces intense competition and sluggish consumer spending.
JD.com’s Chief Financial Officer, Ian Su Shan, attributed the strong financial performance to the company's focus on enhancing price competitiveness through a disciplined supply chain approach, rather than relying heavily on subsidies. This strategy has not only helped JD.com (NASDAQ: NASDAQ:JD ) maintain its market position but also led to a substantial increase in gross margin by 137 basis points, reaching a record 15.8% in the quarter.
The Surge in Share Price: A Closer Look
Friday’s 5.7% surge in JD.com’s share price was a welcome relief for investors, especially considering the stock had been down 8% year-to-date and 28% over the past 12 months. The positive market reaction underscores investors’ confidence in JD.com’s ability to navigate the challenges of a weakened Chinese consumer market.
However, this rapid price increase has pushed JD.com’s Relative Strength Index (RSI) to 66, suggesting the stock is approaching overbought territory. The Relative Strenght Index (RSI), a momentum oscillator that measures the speed and change of price movements, indicates that a reading above 70 typically signals overbought conditions, potentially leading to a price correction. With the current RSI at 66, investors should be cautious as the stock flirts with this critical threshold.
Navigating a Weak Consumer Market
JD.com’s strong quarterly results come at a time when major Chinese e-commerce players, including Alibaba, are grappling with a slowdown in consumer spending. Alibaba’s latest earnings also reflected this trend, with revenue from its China platforms showing minimal growth. This has led to a highly competitive environment, with e-commerce platforms like JD.com (NASDAQ: NASDAQ:JD ), Alibaba, and Pinduoduo fiercely battling for the attention of increasingly value-conscious consumers.
Despite these challenges, JD.com (NASDAQ: NASDAQ:JD ) has managed to differentiate itself by focusing on next-day delivery and higher-priced products, leveraging its in-house logistics capabilities. This approach has resonated with a segment of Chinese consumers who value convenience and quality, helping JD.com maintain its market share amidst the broader economic slowdown.
What’s Next for JD.com?
As JD.com’s ability to sustain its recent momentum will be closely watched. The recent surge in share price, while encouraging, raises questions about the sustainability of this rally, especially given the approaching overbought conditions indicated by the RSI.
For now, JD.com (NASDAQ: NASDAQ:JD ) remains a formidable player in China’s e-commerce sector, with a proven ability to adapt to changing market conditions. However, investors should remain vigilant, keeping an eye on both the stock’s technical indicators and the broader economic environment in China.
In conclusion, while JD.com’s latest earnings report and subsequent stock price surge are positive signs, the current RSI level suggests caution may be warranted. The company’s focus on price competitiveness and logistics efficiency has paid off, but with the stock nearing overbought territory, a period of consolidation or even a pullback could be on the horizon. Investors will need to weigh the potential for continued gains against the risks of a market correction as they consider their positions in JD.com (NASDAQ: NASDAQ:JD ).

JD.com (JD): Key Levels to Watch for Potential ReversalJD.com has seen the expected drop towards the High Volume Node and Point of Control (POC) on the daily and three-day charts, between $27.50 and $26.80. Now, the price is falling further, and we think the lowest it could go is $24.65. This area is about $1 wide, and if it goes below that, it might drop to $20.
Current Situation:
The current situation shows the main support levels between $27.50 and $26.80. We believe the maximum downside is around $24.65. If it drops below this level, it could fall to $20. This support area is important because a lot of trading happened here, so it’s a key level to watch.
Possible Scenarios:
There are two possible scenarios: a continued decline or a bullish reversal. If the price keeps dropping, it's best to wait until we see some signs of strength. If it falls below $24.65, it could go down to $20. For the price to go up again, JD.com needs to get back above the resistance between $35 and $38. This would show a possible upward trend.
Strategy:
Our plan is to wait to see if the price shows some strength in the current support area. If it keeps falling, we should avoid entering the market. We need to keep an eye on the $24.65 level for any signs of a bigger drop. Also, watch if the price goes back above $35-$38 to signal a possible upward move.
We are closely watching the current support area and will wait for signs of strength before making any decisions. We won't be catching falling knives at the moment, and if the price drops below $24.65, we expect it to fall towards $20. On the other hand, if it goes above $35-$38, it might start a bullish trend.

1 Stock to buy. And MIGI, SDIG and EVRI updateJD stock looks good to enter. We may wait for confirmation or enter right now. MIGI and SDIG will show their hands maybe next year. Hopefully it will give us a great return. EVRI is the best setup right now but it may take 2 years or so to see good profits on this trade. I also closed all oil und Natural Gas positions.

JD.com (JD): Key Levels to Watch Amid Potential BreakoutFor the Chinese stock JD.com listed on the Nasdaq, we observe a significant pattern. Initially, we had a prolonged sideways movement that concluded with an initial surge, establishing the current resistance zone. This zone held twice before the price fell through.
Starting from point X in our Elliott Wave count in November 2018, we saw a rapid increase of approximately 470% in a short period. However, this was followed by a steep sell-off, leading to the formation of Wave (2) within a trend channel.
The correction's time horizon places it in the perfect zone, typically between 2 and 2.618 on the higher time frame, which is a good indicator that this could indeed be Wave (2). To continue the upward movement, it is crucial for JD.com to flip this resistance zone.
The current question is whether the price will first return to the High-Volume Node Point of Control (POC) or break out upwards directly. Flipping the support-resistance zone will be key for any significant upward momentum.
We'll be closely monitoring these levels to determine the next move.
Zooming in on the 12-hour timeframe, we can observe the scenario at the end of the assumed Wave (2). This pattern is characteristic of what we like to see at the conclusion of Wave 2. Initially, we experienced an accumulation phase, which transitioned into a manipulation phase, followed by an expansion phase. This sequence is generally a positive sign.
Currently, we are witnessing a pullback after touching the resistance level. Despite this, we maintain our outlook that the price should continue to rise and not retest the $20 mark.
There's a breakout gap that partially filled but remains open near the bottom. This gap formed just before we entered the expansion phase, and it's a critical point to consider.
Given the ongoing volatility in the Chinese market and the uncertainty among investors, we remain cautious. We are closely watching how JD.com behaves within the $24.50 to $26.80 range. With a drop towards the gap close near $21, we will consider making significant buys.
If the price breaks out upwards, we will look for opportunities to enter positions.

JD.COM showing upside soon to come to $35Inverse Head and SHoulders seems to be forming on the JD.COm
The market has come down from a high of $42 down to $21 since July 2023.
Then there was a solid consolidation and higher lows forming, before the next move.
Now we do have a potential Inv H and S but it's still of a Medium Nature.
Price>20
Price<200
The target is around $35.01 but we need the price to first break up and out of the neckline.
Let's wait and see.

JD.com Resurgence: Surpassing Expectations JD.com (NASDAQ: NASDAQ:JD ), the Chinese e-commerce giant, has emerged victorious in the face of economic headwinds, defying expectations with impressive fourth-quarter revenue figures that have ignited a surge in investor confidence. With shares soaring 15% , JD.com's strategic maneuvers and resilience in a challenging market landscape have captured the attention of analysts and stakeholders alike.
The company's success in the final quarter of 2023, buoyed by aggressive price cuts and heavy discounts during China's renowned Singles Day shopping festival, underscores its ability to adapt and thrive amidst economic turbulence. Despite China's shaky economic growth and concerns surrounding youth unemployment and stagnant wages, JD.com's ( NASDAQ:JD ) innovative approach to stimulating consumer demand has yielded remarkable results.
Chief Executive Sandy Xu Ran's announcement of plans to expand JD.com's international presence marks a pivotal moment in the company's trajectory. With a keen focus on supply chain optimization, JD.com ( NASDAQ:JD ) aims to establish itself as a global powerhouse, leveraging its distinct business model and competitive advantages to penetrate new markets.
The prospect of JD.com's ( NASDAQ:JD ) potential acquisition of UK electronics retailer Currys further underscores its commitment to international expansion. As the company seeks to diversify its revenue streams and mitigate risks associated with domestic market fluctuations, analysts anticipate a strategic move that could bolster JD.com's ( NASDAQ:JD ) global footprint and drive long-term growth.
JD.com's ( NASDAQ:JD ) stellar quarterly performance, with net revenue surpassing analyst estimates at 306.1 billion yuan ($42.52 billion), reflects its enduring popularity among cost-conscious consumers. Despite concerns stemming from an internal audit of its Dada Nexus unit, JD.com's overall revenue remains robust, alleviating investor apprehensions and reaffirming confidence in the company's resilience.
Moreover, JD.com's ( NASDAQ:JD ) announcement of a $3 billion share repurchase program underscores its commitment to enhancing shareholder value and capitalizing on market opportunities. With its U.S.-listed shares experiencing a recent downturn, JD.com's proactive measures signal a strategic pivot towards revitalizing investor sentiment and unlocking future growth potential.
As JD.com ( NASDAQ:JD ) reports a net income attributable to shareholders of 3.4 billion yuan, marking a significant increase from the previous year, the company's trajectory appears poised for further success. With a steadfast focus on innovation, expansion, and shareholder value, JD.com ( NASDAQ:JD ) continues to navigate the complexities of the global market with confidence and determination.

Going Global JD.Comnever seen this chart before, dont know anything about them other than their success may be helpful for BABA. green targets to the upside, red to the down. interested to see how this one plays out. im bullish on this one tho $

JD - Washing The Stops Out First?A follower asked to chart JD.com
And since it's Sunday and I'm sipping my fresh brewed coffee from my "La Pavoni" Espresso Machine, I have time to help out a buddy in the Trading Space.
Here we go:
The Monthly (Daily will follow below) Chart is nice and orderly. It has a good Base. And we also see where the last bunch of buyers where from 2019 to 2020.
JD had it's shiny days when it went up to P0.
From there the clouds began to darken. It was, and still is on the path down to a potential P5, which is not achieved yet.
So, that would mean a break of the Base?
Yes!
But, what about the Last Real Buyers (Green Box)?
Put it in perspective. These old buyers had the Job to not let the Stock go down anymore, but to encourage the CROWD to buy more. Big boys where already loaded there...
Any other ideas why a break of the Base and a Wash of the Stop/Loss orders could happen?
Yes.
1. If I where one of the Whales who's behind JD.com, I would want to buy low and sell high. So, my advice to the Market Maker would be to take out all the Stop/Loss orders, sitting below the Base. Throw the final Max. Pain to all HODLERs of JD and prove their bravery.
And then, when everyone and their Mothers throw the towel, I would pick them all up...of course for a very low price.
Please, if you have JD in your portfolio, don't hate me for this. I just throw out my thoughts and tell about my experience. I love you §8-)
Is there more...?
Sure:
2. The Fork
The red Pitchfork projects the most probable path of price. That's the nature of the Andrews Pitchfork. And it does it very well as we see.
Until price has climbed above the U-MLH (The Upper-Medianline-Parallel) there is absolutely no intention that JD will start to stop from falling.
So there we have it.
Can we build a plan to buy out of this information?
Why not:
Wait for the wash.
Wait for something important that shouts in your face.
Then start to gather the facts together that give you many good reasons to buy JD for the long term and make a killing in the next Pump. For example:
1. Wash is over
2. Price climbed above the Base again
3. Price is above the U-MLH
4. The earth did not end despite the climate activists predicting it for the 48th time and the Christmas Tree didn't burn down last year §8-)
Wish you all a happy Sunday and - Go get your free ForkTrading-BLUEPRINT on my website.
T8N3

JD.com Inverted H&SJD.com has created an inverted H&S pattern over the summer and is attempting to break above the neckline. This isn't a textbook H&S since the neckline hasn't been a hard resistance level for price when looking at the violation above the neckline at the right shoulder, but that appears to have been an outlier with a gap up and almost immediate gap back down below the neckline. Although not textbook, this pattern is similar enough to warrant attention as price is currently attempting a break above the neckline.
The PPO indicator shows the green PPO line rising above the purple signal line which indicates short-term bullish momentum. Both lines trending above the 0 level indicates intermediate to long-term bullish price momentum. Going forward we want to see the green PPO continue to rise above the signal line.
The TDI indicator shows the green RSI line rising and crossing above the 60 level while trending inside the upper half of the white Bollinger Bands. This indicates a short-term bullish trend in price. Going forward we want to see the green RSI line continue to rise above the 60 level, with an overall trend between the 40-80 levels to indicate intermediate to long-term bullish price trend.
My entry on this trade was at $38.98 with a current stop-loss at $35.57. Should price break above the neckline and continue to rise I'm looking at resistance near the 200ma at the $45 area to take profit, but am also going to be watching for a potential measured move near the $48 level if price manages to push through the 200ma with ease.

JD bullish divergences - LONG position11 % to be made on JD stock
bullish divergences on 4h time frame are playing out and we expect a pump towards the resistance.
Entry , stop loss and Target are shown on the chart
Good luck

BABA Short IdeaGood setup for a short. Equity reached highs of the last run and starting to stumble while market ripping and showing some reversial potential here. Also not surprising is that it was one of the leaders in the up move and now is signalling where the market may go next. Red line SL, green lines TP 1, and 2, respectively. GL

Selling JD into strong resistance.JD.com - 30d expiry - We look to Sell at 66.98 (stop at 71.07)
Bespoke resistance is located at 67.
Resistance could prove difficult to breakdown.
67 continues to hold back the bulls. 67.87 has been pivotal.
We look for a temporary move higher.
Early optimism is likely to lead to gains although extended attempts higher are expected to fail.
Our profit targets will be 57.04 and 55.04
Resistance: 62.00 / 64.50 / 67.00
Support: 54.50 / 52.00 / 49.24
Daily chart
Disclaimer – Saxo Bank Group.
Please be reminded – you alone are responsible for your trading – both gains and losses. There is a very high degree of risk involved in trading. The technical analysis , like any and all indicators, strategies, columns, articles and other features accessible on/though this site (including those from Signal Centre) are for informational purposes only and should not be construed as investment advice by you. Such technical analysis are believed to be obtained from sources believed to be reliable, but not warrant their respective completeness or accuracy, or warrant any results from the use of the information. Your use of the technical analysis , as would also your use of any and all mentioned indicators, strategies, columns, articles and all other features, is entirely at your own risk and it is your sole responsibility to evaluate the accuracy, completeness and usefulness (including suitability) of the information. You should assess the risk of any trade with your financial adviser and make your own independent decision(s) regarding any tradable products which may be the subject matter of the technical analysis or any of the said indicators, strategies, columns, articles and all other features.
Please also be reminded that if despite the above, any of the said technical analysis (or any of the said indicators, strategies, columns, articles and other features accessible on/through this site) is found to be advisory or a recommendation; and not merely informational in nature, the same is in any event provided with the intention of being for general circulation and availability only. As such it is not intended to and does not form part of any offer or recommendation directed at you specifically, or have any regard to the investment objectives, financial situation or needs of yourself or any other specific person. Before committing to a trade or investment therefore, please seek advice from a financial or other professional adviser regarding the suitability of the product for you and (where available) read the relevant product offer/description documents, including the risk disclosures. If you do not wish to seek such financial advice, please still exercise your mind and consider carefully whether the product is suitable for you because you alone remain responsible for your trading – both gains and losses.

JD daily bearish hammer retestOrder BUY JD NASDAQ.NMS Stop 38.26 LMT 38.26 will be automatically canceled at 20230401 01:00:00 EST
JD daily bearish hammer retest be quick for earning. Maybe that's it for downtrend JD. Beware stock is political too.
